Prevalence of Clinical Manifestations and Comorbidities of Coronavirus (COVID-19) Infection: A Meta-Analysis
Article Information
Farha Musharrat Noor*, Md. Momin Islam
Department of Statistics, University of Dhaka, Dhaka, 1000, Bangladesh
*Corresponding Author: Farha Musharrat Noor, Department of Statistics, University of Dhaka, Dhaka, 1000, Bangladesh
Received: 10 May 2020; Accepted: 20 May 2020; Published: 23 May 2020
Citation: Farha Musharrat Noor, Md. Momin Islam. Prevalence of Clinical Manifestations and Comorbidities of Coronavirus (COVID-19) Infection: A Meta-Analysis. Fortune Journal of Health Sciences 3 (2020): 55-97.
View / Download Pdf Share at FacebookAbstract
Abstract
Background: Since late December, 2019 an outbreak of coronavirus (COVID-19) emerged in China and continued to spread across the world. The main aim of this study was to investigate the prevalence of clinical characteristics and comorbidities of coronavirus (COVID-19) infected patients.
Methods: A meta-analysis was performed using three electronic databases PubMed, Science Direct and Google Scholar to assess clinical characteristics and comorbidities of COVID-19 confirmed cases from January 1, 2020 to April 2, 2020. The pooled prevalence rate (PR) and 95% confidence interval (CI) was calculated using a random effects model.
Result: Total 44 eligible studies were selected for analysis, including 7673 infected patients. Form the result it was found that the most prevalent clinical symptom was fever [PR: 84.49 %, 95 % CI: (81.87- 87.11)], following cough [PR: 56.39%, 95% CI (51.06 - 61.73)], fatigue [PR: 33.65%, 95% CI: (26.77 – 40.54)] , dyspnea [PR: 22.34%, 95% CI: (17.18 – 27.50)], sputum production [PR: 20.72%, 95% CI: (11.18 – 30.27)] and myalgia [PR: 16.26%, 95% CI: (12.93 – 19.59)]. The most prevalent comorbidity was hypertension [PR: 20.00%, 95% CI: (16.53 – 23.46)], following cardiovascular disease [PR: 11.19%, 95% CI: (6.76 – 15.62)], diabetes [PR: 9.78%, 95% CI: (8.02 – 11.55)], chronic liver disease [PR: 2.65%, 95% CI: (1.85 – 3.46)] and cerebrovascular disease [PR: 2.63%, 95% CI: (1.06 – 4.19)].
Conclusion: Fever, cough, fatigue were the most strongly predictive clinical symptoms and hypertension, cardiovascular disease, diabetes were the most prevalent comorbidities for COVID-19 infection.
Keywords
Coronavirus (COVID-19); Clinical characteristics; Comorbidity; Meta-analysis
Coronavirus (COVID-19) articles, Clinical characteristics articles, Comorbidity articles, Meta-analysis articles, Coronavirus (COVID-19) articles Coronavirus (COVID-19) Research articles Coronavirus (COVID-19) review articles Coronavirus (COVID-19) PubMed articles Coronavirus (COVID-19) PubMed Central articles Coronavirus (COVID-19) 2023 articles Coronavirus (COVID-19) 2024 articles Coronavirus (COVID-19) Scopus articles Coronavirus (COVID-19) impact factor journals Coronavirus (COVID-19) Scopus journals Coronavirus (COVID-19) PubMed journals Coronavirus (COVID-19) medical journals Coronavirus (COVID-19) free journals Coronavirus (COVID-19) best journals Coronavirus (COVID-19) top journals Coronavirus (COVID-19) free medical journals Coronavirus (COVID-19) famous journals Coronavirus (COVID-19) Google Scholar indexed journals Clinical characteristics articles Clinical characteristics Research articles Clinical characteristics review articles Clinical characteristics PubMed articles Clinical characteristics PubMed Central articles Clinical characteristics 2023 articles Clinical characteristics 2024 articles Clinical characteristics Scopus articles Clinical characteristics impact factor journals Clinical characteristics Scopus journals Clinical characteristics PubMed journals Clinical characteristics medical journals Clinical characteristics free journals Clinical characteristics best journals Clinical characteristics top journals Clinical characteristics free medical journals Clinical characteristics famous journals Clinical characteristics Google Scholar indexed journals Comorbidity articles Comorbidity Research articles Comorbidity review articles Comorbidity PubMed articles Comorbidity PubMed Central articles Comorbidity 2023 articles Comorbidity 2024 articles Comorbidity Scopus articles Comorbidity impact factor journals Comorbidity Scopus journals Comorbidity PubMed journals Comorbidity medical journals Comorbidity free journals Comorbidity best journals Comorbidity top journals Comorbidity free medical journals Comorbidity famous journals Comorbidity Google Scholar indexed journals Meta-analysis articles Meta-analysis Research articles Meta-analysis review articles Meta-analysis PubMed articles Meta-analysis PubMed Central articles Meta-analysis 2023 articles Meta-analysis 2024 articles Meta-analysis Scopus articles Meta-analysis impact factor journals Meta-analysis Scopus journals Meta-analysis PubMed journals Meta-analysis medical journals Meta-analysis free journals Meta-analysis best journals Meta-analysis top journals Meta-analysis free medical journals Meta-analysis famous journals Meta-analysis Google Scholar indexed journals
Article Details
1. Introduction
The development of novel coronavirus, formally known as severe acute respiratory syndrome-coronavirus-2 (SARS-CoV-2), has introduced an exceptional test for the medicinal services network over the world. High infectivity, capacity to get transmitted in any event, during asymptomatic stage and generally low harmfulness have brought about fast transmission of this infection beyond geographic regions, leading a pandemic [1]. The first case of this disease, known as coronavirus disease 2019 (COVID-2019), happened on December 8, 2019 in Wuhan, the Hubei province of China [1]. From that point forward within a short span of just around 4 months, the infection has spread to 208 countries/ area/territories across the world, with 1210956 confirmed cases and 67594 deaths (World Health Organization statistics as on April 6, 2020) [2]. SARS-CoV-2 is a betacoronavirus that has a place with a generally notable viral family coronaviridae and the order nidovirales [3]. Modern, six coronavirus species have been distinguished to contaminate people and cause disease. Among them, 229E, OC43, NL63, and HKU1 diseases are often mild, generally caused normal cold side effects [4]. The opposite two species, severe acute respiratory syndrome coronavirus (SARS-CoV) which had an epidemic in 2002 and Middle East respiratory syndrome coronavirus (MERS-CoV) which had an epidemic in 2012, might cause fatal illness [5]. SARS-CoV-2 is that the seventh member of the coronaviruses that infects humans [6]. Based on recent reports, the novel coronavirus infected patients predominantly can be identified through various symptoms such as fever, cough, dyspnea, myalgia, and fatigue [7-11]. Severity of COVID-19 infection was significant for several chronic conditions such as hypertension, cardiovascular disease and diabetes [12-15].
Reverse transcription-polymerase chain reaction (RT-PCR), chest computed tomography (CT) scanning and nucleic acid test can provide a more comprehensive overview of the disease, in order to help the clinical diagnosis and management [8, 9, 16].
A recent meta-analysis of symptoms in 46248 COVID-19 patients from 8 studies found that the highest prevalent of clinical symptom was fever, following cough, fatigue and dyspnea. On the other hand, the highest prevalent of co-morbidities were hypertension, diabetes, cardiovascular diseases and respiratory system disease [17]. This means that, complications could also be a risk factor for adverse outcomes. Estimating the prevalence of those chronic diseases is that the basis for preventing complications in patients with COVID-19 infections.
The case mortality rate is high for COVID-19 infection. According to World Health Organization statistics as on April 6, 2020, globally the death rate was 5.58%. The highest confirmed number of cases was reported in European region (655339) with the highest mortality rate 7.55%. Among this region mortality rate were for Italy (12.3%), Spain (9.5%), UK (10.3%), and France (11.58%). In Region of Americas the number of confirmed cases was 352592 with mortality rate 2.7%. In South-East Asia the number of confirmed cases was 8828 with death rate 3.89%. Among this region the highest mortality rate was observed in Bangladesh as 9.09% and for India was 2.68% [2]. In a recent meta-analysis it was found that 20.3% of total hospitalized patients required intensive care unit (ICU), 32.8% presented with acute respiratory distress syndrome (ARDS), 6.2% with shock and the case fatality rate (CFR) was higher than 13% among hospitalized patients [18].
This review is aimed toward providing a more convincing result, we’ll provide a meta-analysis aggregating all currently available data (indexed up to 2nd April, 2020) from published studies of clinical symptoms and comorbidities predictive for severe illness with COVID-19.
2. Methods
2.1 Search Strategy
A systematic search was conducted on studies published from January 1, 2020 to April 2, 2020 through PubMed, Science Direct and Google Scholar using advanced search strategy with the following combined text heading as (“COVID-19” or “coronavirus” or “novel coronavirus”). Published peer reviewed articles were also included. Only English language articles and human based studies were included in the analysis. All the articles were screened by title and abstract to identify the suitable articles for this meta-analysis. Retrospective studies for coronavirus disease were only considered for analysis purpose. Cross-sectional study, case-control study and case reports were excluded for this meta-analysis. Also, editorials, and review articles were excluded. All the identified articles were searched by hand and not recognized by electronic inquiry. At last, duplicate articles were found out and removed. Titles and abstracts were searched independently by two reviewers. Controversial matters were solved by discussion.
2.2 Study Inclusion and Exclusion Criteria
We included articles that reported cases with demographic characteristics, clinical characteristics and comorbidities of SARS-CoV-2 infected patients confirmed by real time reverse transcriptase polymerase chain reaction (RT-PCR) or chest computed tomography (CT). Studies that included only pediatric patients were excluded due to heterogeneous results found among this group for coronavirus disease. Published articles and peer reviewed articles were included in the analysis. Unpublished articles were not included because of data uncertainty.
2.3 Data Extraction Process and Study Quality Assessment
The results of the initial search strategy were first screened by title and abstract. Full articles were inspected for inclusion and rejection criteria. Two reviewers independently extracted data from included articles for analysis. From each articles, various information following confirmation of SARS-CoV-2 infected patients, study design, time and place of data collections, year, country, total number of reported cases, gender, age, clinical characteristics (e. g., fever, cough, fatigue, etc.), comorbidities (e. g., hypertension, diabetes, cardiovascular disease, etc.) were extracted. PRISMA checklist was used for reporting the paper [19]. The quality assessment of the included studies were conducted by utilizing Newcastle-Ottawa technique in this meta-analysis [20].
2.4 Statistical Method
This meta-analysis was performed utilizing Stata, version 12. Pooled prevalence rate (PR) and 95% CI were estimated using random effects model [REM] [21] to summarize the weighted effect size for each study. REM were used due to between study heterogeneity [21]. In REM, effect size can vary among the study’s results [21, 22]. Heterogeneity of this meta-analysis was estimated by chi square test, tau square test ( ) and index. Chi-square test statistic (Q) was utilized to discover the nearness of heterogeneity among the investigations, was used to discover between studies difference [21] and was used to quantify the level of variety because of heterogeneity among the included study [23]. Consolidating just the published investigations may prompt a bias result in meta-analysis. Funnel plot was used to detect publication bias among the included studies [24].
3. Result
3.1 study selection and characteristics
Total 1903 articles were searched from PubMed, Science Direct and Google Scholar. Those articles were first screened by title and abstract and found 286 articles. Among total 286 articles, 146 were selected for full text assessment. Among those articles, 102 articles were excluded due to lack of information on clinical characteristics or comorbidities and duplication. Finally, 44 articles were included for quantitative analysis (Figure.1). Articles included in this study were published between 1 January, 2020 and 2 April, 2020. Most of the studies were from China and one from Hong Kong [25]. This meta-analysis was conducted for twenty one variables. Geological, demographical, clinical characteristics of the patients, study design, total number of patients (N) were described in Table 1. Quality assessment of the included variables were also appeared in Table 1.
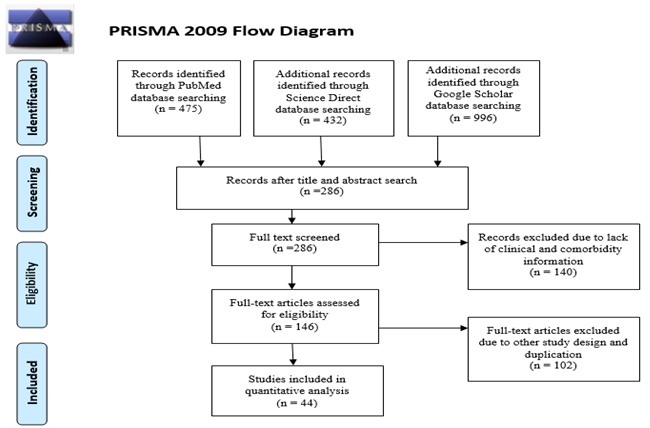
Figure 1: PRISMA flowchart for search strategy and the process of selecting articles
|
Author [Ref] |
Place, Country |
Study period |
Study design |
N (Male %) |
Age (year) |
Quality score |
|
Xi Xu et al. [7] |
Guangzhou Hospital, China |
Jan 28-Feb 9 |
Retrospective |
90 (43.3%) |
Group 18-86 |
5 |
|
Jing Yuan et al. [8] |
Shenzhen People’s Hospital, China |
Jan 5-Feb 13 |
Retrospective |
94 (44.7%) |
Group 1-78 |
5 |
|
Kunwei Li et al. [9] |
Zhuhai, China |
Jan 18-Feb 7 |
Retrospective |
78 (48.7%) |
Mean 44.6 |
6 |
|
Yang-Kai Li et al. [10] |
Tongji Medical College ,China |
Jan 1-Feb 20 |
Retrospective |
25 (48%) |
Group 51-69 |
4 |
|
Rang Chen et al. [11] |
Renmin hospital, China |
Jan 24-Feb 24 |
Retrospective |
17(76.47%) |
Mean 29.5 |
4 |
|
Yu Shi et al. [12] |
Zhejiang Province, China |
up to feb 17 |
Retrospective |
487(53.18%) |
Mean 46 |
5 |
|
Ke Wang et al. [13] |
Chongqing hospital, China |
Jan 1-Mar 4 |
Retrospective |
17 (41.17%) |
Group 56-75 |
5 |
|
Simin Zhang et al. [14] |
Guan'an Hospital, China |
Upto Jan 30 |
Retrospective |
17 (47%) |
Group 23-74 |
5 |
|
Lei Wang et al. [15] |
Zhengzhou hospital, China |
Jan 21-Feb 05 |
Retrospective |
18 (44.4%) |
Median 39 |
5 |
|
Shuyi Yang et al. [26] |
Shanghai, China, China |
Jan 20-Jan 30 |
Retrospective |
44 (56.81%) |
Group 20-76 |
4 |
|
Wei-Jie Guan et al. [27] |
China |
Dec 11-Jan 31 |
Retrospective |
1590(56.9%) |
Mean 48.9 |
6 |
|
Gianfranco Spiteri et al. [28] |
WHO European region |
Jan 24 -Feb 21 |
Retrospective |
38 (65.8%) |
Group 2-81 |
4 |
|
Iek Long Lo et al. [29] |
Macau, China |
Jan 21-Feb 16 |
Retrospective |
10 (30%) |
Median 54 |
6 |
|
Mingli Yuan et al. [30] |
Hubei Public Health Center, China |
Jan 1-Jan 25 |
Retrospective |
27 (44.4%) |
Median 60 |
6 |
|
Kai-Cai Liu et al. [31] |
Anhui province, China |
Jan 21-Feb 3 |
Retrospective |
73 (56.1%) |
Group 5-86 |
7 |
|
K. Wang et al. [32] |
Xiaogan Hospital, China |
Jan 25-Feb 9 |
Retrospective |
114(50.8%) |
Median 53 |
7 |
|
Zuhua Chen et al. [33] |
Zhejiang Chinese Medical, China |
Jan 20-Feb 17 |
Retrospective |
98 (46.9%) |
Group 4-88 |
6 |
|
X. Zhao et al. [34] |
Anhui Province, China |
Jan – Feb |
Retrospective |
80 (53.7%) |
Group 17-72 |
4 |
|
Zili Zhou et al. [35] |
Central hospital of Wuhan, China |
Dec 19-Feb 9 |
Retrospective |
254 (45.3%) |
Group 15-87 |
6 |
|
Huijun Chen et al. [36] |
Zhongnan Hospital, China |
Jan 20-Jan 31 |
Retrospective |
9 (0%) |
Group 26-40 |
7 |
|
Fei Zhou et al. [37] |
Jinyintan &Wuhan Hospital, China |
Dec 29-jan 31 |
Retrospective |
191 (62.3%) |
Group >=18 |
7 |
|
Wenjie Yang et al. [38] |
Zhejiang, China |
Jan 17-Feb 10 |
Retrospective |
149 (54.4%) |
Mean 45.11 |
7 |
|
Yu-Huan Xu et al. [39] |
China |
Jan – Feb |
Retrospective |
50 (58%) |
Group 3-85 |
5 |
|
Guangming Ye at al. [40] |
Zhongnan Hospital, China |
Jan 8-Feb 10 |
Retrospective |
5 (40%) |
Group 22-67 |
5 |
|
Jun Chen at al. [41] |
Shanghai, China |
Jan 20-Feb 6 |
Retrospective |
249 (50.6%) |
Median 51 |
5 |
|
Lang Wang et al. [42] |
Renmin Hospital, China |
Jan 1-Feb 6 |
Retrospective |
339 (48.9%) |
Group >=60 |
7 |
|
Tianmin Xu et al. [43] |
Hospital of Changzhou, China |
Jan 23-Feb 18 |
Retrospective |
51 (49%) |
Group 24-65 |
6 |
|
Xioli Zhang et al. [44] |
Zhejiang, China |
Jan 17-Feb 8 |
Retrospective |
645 (50.8%) |
Mean 46.65 |
5 |
|
Heshui Shi et al. [45] |
Wuhan, China |
Dec 20-Jan 23 |
Retrospective |
81 (51.8%) |
Mean 50 |
7 |
|
Nan Yu et al. [46] |
Tongji Hospital in Wuhan, China |
Jan 1-Feb 8 |
Retrospective |
7 (0%) |
Group 29-34 |
7 |
|
Kelvin Kai-Wang To et al. [25] |
Hong Kong |
Jan 22-Feb 12 |
Retrospective |
23 (56.5%) |
Group 37-75 |
5 |
|
Yihui Huang et al. [47] |
Wuhan, China |
Dec 21-Jan 28 |
Retrospective |
34 (41.2%) |
Group 26-88 |
4 |
|
Xiaobo Yang et al. [48] |
Jin Yin-tan hospital hospital, China |
Dec-Jan 26 |
Retrospective |
52 (67.3%) |
Mean 59.7 |
5 |
|
Sijia Tian et al. [49] |
Beijing Hospital, China |
Jan 20-Feb 10 |
Retrospective |
262 (48.4%) |
Median 47.5 |
7 |
|
L. Zhang et al. [50] |
Wuhan, China |
Dec 20-Jan 23 |
Retrospective |
28 (60.7%) |
Median 65 |
7 |
|
Fang Liu et al. [51] |
Xixi hospital, China |
Jan 22-Feb 11 |
Retrospective |
10 (40%) |
Group 34-50 |
6 |
|
Jin-jin Zhang et al. [52] |
No. 7 Hospital of Wuhan, China |
16 Jan-Feb 3 |
Retrospective |
140 (50.7%) |
Median 57 |
6 |
|
Xiao-Wei Xu et al. [53] |
Seven hospitals in Zhejiang, China. |
10 Jan-26 Jan |
Retrospective |
62 (56%) |
Median 41 |
6 |
|
Tao Chen et al. [54] |
Tongji Hospital , China. |
13 Jan-12 Feb |
Retrospective |
274 (62%) |
Median 62 |
7 |
|
Dawei Wang, MD et al. [55] |
Zhongnan Hospital, China |
1 Jan–28 Jan |
Retrospective |
138 (54.3%) |
Median 56 |
6 |
|
Shaobo Shi, MD et al. [56] |
Renmin Hospital of Wuhan, China |
20 Jan-10 Feb |
Retrospective |
416 (49.3%) |
Median 64 |
5 |
|
Rui Han et al. [57] |
Wuhan No. 1 Hospital, China |
4 Jan-5 Feb |
Retrospective |
108 (35.2%) |
Mean 45 |
5 |
|
Jiong Wu et al. [58] |
Outside of wuhan, China |
Jan to Feb |
Retrospective |
80 (52%) |
Mean 44 |
6 |
|
W. Guan et al. [59] |
China |
11 Dec-29 Jan |
Retrospective |
1099 (58%) |
Median 47 |
5 |
Table 1: Characteristics table for the included studies
3.2 Clinical manifestations and Comorbidities
Summary of the meta-analysis for clinical manifestations and comorbidities of COVID-19 infected patients were shown in Table 2. Following the clinical symptoms, the prevalence rate (PR) were found for fever 84.49 % [95 % CI (81.87- 87.11), z = 63.13, p < 0.001] (Figure. 2), cough 56.39% [95% CI (51.06 - 61.73), z = 20.72, p < 0.001] (Figure. S1) and fatigue 33.65% [95% CI (26.77 – 40.54), z = 9.58, p < 0.001] (Figure. S2), which were the most frequent clinical symptoms for COVID-19 infected patient. PR for clinical manifestations were also found 8.51% [95% CI (6.63 – 10.39), z = 8.87, p < 0.001] for diarrhea (Figure. S3), 16.26% [95% CI (12.93 – 19.59), z = 9.57, p < 0.001] for myalgia (Figure. S4), 9.04% [95% CI (6.22 – 11.86), z = 6.29, p < 0.001] for headache (Figure. S5), 14.05% [95% CI (9.54 – 18.56), z = 6.10, p < 0.001] for chest pain (Figure. S6), 4.35% [95% CI (3.14 – 5.57), z = 7.00, p < 0.001] for vomiting (Figure. S7), 22.34% [95% CI (17.18 – 27.50), z = 8.49, p < 0.001] for dyspnea (Figure. S8), 11.00% [95% CI (7.24 – 14.76), z = 5.73, p < 0.001] for sore throat (Figure. S9), 20.72% [95% CI (11.18 – 30.27), z = 4.25, p < 0.001] for sputum (Figure. S10), 15.20 % [95% CI (8.49 – 21.91), z = 4.44, p < 0.001] for poor appetite (Figure. S11), 9.45 % [95% CI (5.09 – 13.81), z = 4.25, p < 0.001] for chills (Figure. S12).
Several comorbidities were also presented among SARS-CoV-2 infected patients, among them hypertension [PR: 20.00%, 95% CI (16.53 – 23.46), z = 11.33, p < 0.001] (Figure. S13), cardiovascular disease [PR: 11.19%, 95% CI (6.76 – 15.62), z = 4.95, p < 0.001] (Figure. S14) and diabetes [PR: 9.78%, 95% CI (8.02 – 11.55), z = 10.88, p < 0.001] (Figure. S15) were significantly high. The PR were also found for chronic kidney disease [PR: 1.24%, 95% CI (0.87 – 1.61), z = 6.60, p < 0.001] (Figure. S16), chronic liver disease [PR: 2.65%, 95% CI (1.85 – 3.46), z = 6.48, p < 0.001] (Figure. S17), chronic pulmonary disease [PR: 1.97%, 95% CI (1.06 – 2.87), z = 4.26, p < 0.001] (Figure. S18), malignancies [PR: 2.28%, 95% CI (1.49 – 3.08), z = 5.63, p < 0.001] (Figure. S19) and cerebrovascular disease [PR: 2.63%, 95% CI (1.06 – 4.19), z = 3.29, p < 0.001] (Figure. S20).
|
Variables |
Number of Studies |
Total number of patients |
Pooled Prevalence Rate (95% CI) |
Test for overall effect |
Test for heterogeneity |
||||
|
z- value |
p- value |
Q statistic |
p- value |
||||||
|
Clinical features |
|||||||||
|
Fever |
41 |
7089 |
84.49 (81.87- 87.11) |
63.13 |
< 0.001 |
408.07 |
< 0.001 |
51.05 |
90.2% |
|
Cough |
41 |
7160 |
56.39 (51.06 - 61.73) |
20.72 |
< 0.001 |
850.04 |
< 0.001 |
258.79 |
95.3% |
|
Fatigue |
24 |
6126 |
33.65 (26.77 - 40.54) |
9.58 |
< 0.001 |
860.25 |
< 0.001 |
275.07 |
97.3% |
|
Diarrhea |
28 |
6081 |
8.51 (6.63 - 10.39) |
8.87 |
< 0.001 |
189.20 |
< 0.001 |
15.13 |
85.7% |
|
Myalgia |
22 |
5357 |
16.26 (12.93 - 19.59) |
9.57 |
< 0.001 |
221.39 |
< 0.001 |
43.53 |
90.5% |
|
Headache |
20 |
5686 |
9.04 (6.22 - 11.86) |
6.29 |
< 0.001 |
352.60 |
< 0.001 |
32.06 |
94.6% |
|
Chest pain |
17 |
3549 |
14.05 (9.54 - 18.56) |
6.10 |
< 0.001 |
268.61 |
< 0.001 |
75.21 |
94.0% |
|
Vomiting |
17 |
4814 |
4.35 (3.14 - 5.57) |
7.00 |
< 0.001 |
45.03 |
< 0.001 |
2.91 |
64.5% |
|
Dyspnea |
26 |
5886 |
22.34 (17.18 - 27.50) |
8.49 |
< 0.001 |
893.02 |
< 0.001 |
150.37 |
97.2% |
|
Sore throat |
16 |
2997 |
11.00 (7.24 - 14.76) |
5.73 |
< 0.001 |
131.15 |
< 0.001 |
36.91 |
88.6% |
|
Sputum |
10 |
2356 |
20.72 (11.18 - 30.27) |
4.25 |
< 0.001 |
356.92 |
< 0.001 |
223.44 |
97.5% |
|
Poor appetite |
11 |
1524 |
15.20 (8.49 - 21.91) |
4.44 |
< 0.001 |
237.96 |
< 0.001 |
114.41 |
95.8% |
|
Chills |
4 |
1284 |
9.45 (5.09 - 13.81) |
4.25 |
< 0.001 |
8.23 |
> 0.001 |
10.90 |
63.5% |
|
Comorbidities |
|||||||||
|
Diabetes |
25 |
6068 |
9.78 (8.02 - 11.55) |
10.88 |
< 0.001 |
100.20 |
< 0.001 |
10.97 |
76.0% |
|
Hypertension |
27 |
6116 |
20.00 (16.53 - 23.46) |
11.33 |
< 0.001 |
247.68 |
< 0.001 |
60.76 |
89.5% |
|
Cardiovascular disease |
28 |
6307 |
11.19 (6.76 - 15.62) |
4.95 |
< 0.001 |
1846.94 |
< 0.001 |
125.27 |
98.5% |
|
Chronic Kidney disease |
13 |
5120 |
1.24 (0.87 - 1.61) |
6.60 |
< 0.001 |
14.39 |
> 0.001 |
0.06 |
16.6% |
|
Chronic Liver disease |
18 |
5269 |
2.65 (1.85 - 3.46) |
6.48 |
< 0.001 |
38.87 |
> 0.001 |
1.05 |
56.3% |
|
Chronic pulmonary disease |
9 |
2611 |
1.97 (1.06 - 2.87) |
4.26 |
< 0.001 |
12.72 |
> 0.001 |
0.59 |
37.1% |
|
Malignancies |
16 |
3915 |
2.28 (1.49 - 3.08) |
5.63 |
< 0.001 |
29.61 |
> 0.001 |
0.83 |
49.3% |
|
Cerebrovascular disease |
5 |
1989 |
2.63 (1.06 - 4.19) |
3.29 |
0.001 |
14.94 |
> 0.001 |
2.01 |
73.2% |
Table 2: Summary table for meta-analysis results
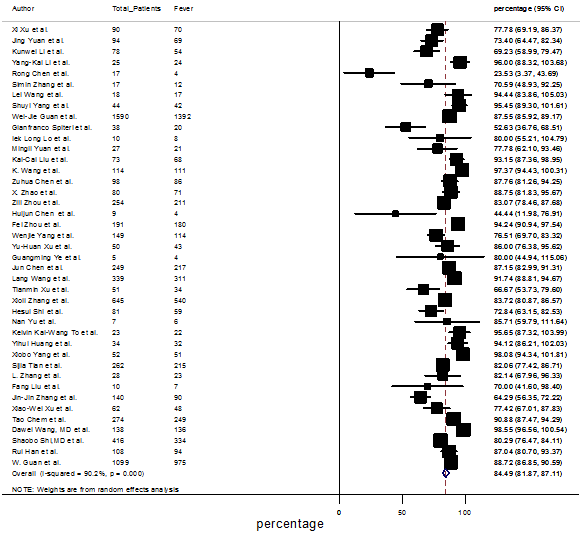
Figure.2: Forest plot for the prevalence of fever among SARS-CoV-2 infected patients
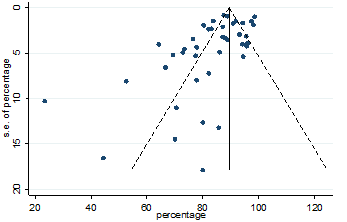
Figure.3: Funnel plot for detecting publication bias in the data for variable fever
Significant heterogeneity were found among the results for most of the clinical characteristics and some comorbidities since Q statistics were high with p < 0.001. Funnel plot was used to find the publication bias among the included studies. Publication bias was found for variable fever (Figure. 3). Publication bias were also found for all of the other variables except chills using funnel plot (Figure. S21 –Figure. S40).
4. Discussion
Novel Corona virus has become an epidemic in Western Pacific Region (especially China), European Region (Italy, Spain, The United Kingdom etc.), Eastern Mediterranean Region (especially Iran), Regions of the Americas (United States of America). Nowadays South-East Asian Region and African region have faced an outbreak of this virus. The extensive distribution of this virus has led to a serious concern, globally [2].
In this meta-analysis, we tried to summarize clinical and comorbidity data on COVID-19 confirmed cases that were published up to 2 April, 2020. Clinical data were collected from total of 7673 infected patients. Heterogeneity was found highly since PR for all studies were not same for included studies. Forest plot was drawn for all of the variables and robustness of the result were notable. For this reason random effects model (REM) of meta-analysis was conducted. The assumption of this model is that the effect sizes are not identical in every study and follows a distribution [21]. Pooled estimate and 95% CIs refer to the center of the distribution of pooled prevalence in meta-analysis. In REM, 95% CI measures the uncertainty of pooled estimate [21]. In this meta-analysis 95% CI was calculated along with prevalence rate (PR). In forest plot, pooled PR estimates were presented with a diamond and individual studies weight were presented with a square.
In this study co-morbidity symptoms were considered because the co-morbidity symptoms such as hypertension, cardiovascular disease, diabetes, chronic liver disease, cerebrovascular disease, malignancies, chronic pulmonary disease, and chronic kidney disease may be linked to the pathogenesis of COVID 19. As mentioned earlier in the result section, fever prevalent (84.49%) was higher compared to the other clinical symptoms. Other clinical symptoms prevalence were cough (56.39%), fatigue (33.65%), dyspnea (22.34%), sputum (20.72%), myalgia (16.26%), poor appetite (15.20%), chest pain (14.05%), sore throat (11.0%), chills (9.45%), headache (9.04%), diarrhea (8.51%), and vomiting (4.35%). According to the findings of the current study, hypertension prevalent (20.0%) was higher among the co-morbidity symptoms. Followed by the other co-morbidity symptoms were cardiovascular disease (11.19%), diabetes (9.78%), chronic liver disease (2.65%), cerebrovascular disease (2.63%), malignancies (2.28%), chronic pulmonary disease (1.97%), and chronic kidney disease (1.24%).
From many individual studies of China it was found that clinical features fever and cough were the most predominant among COVID-19 infected patients [7-11]. Fatigue, myalgia, dyspnea were also found among COVID-19 infected patients [47, 50, 54, 55]. Those symptoms occurred more frequently among older patients [10, 13, 42]. The rate of infections among males was significantly high compared to women for many studies [11, 28, 37]. Patients presented with different comorbidities such as hypertension, diabetes and cardiovascular can play a vital role for prognosis of this disease [54-56, 59]. Cancer patients have a high risk for this disease [54, 55, 59]. From a single center cluster study of China, it was found that 26% of patients required admission to the intensive care unit (ICU) [55]. From another study it was found that the rate of admission to ICU was 32% among total hospitalized patients [60]. From e systematic review it was notified that the rate of admission to ICU was higher among the patients presented with different comorbidities and older patients [61]. From two studies in China, the death rate was found as 4.3% and 15% respectively [55, 60]. The case fatality rate is increasing day by day and spreads all over the world. Until 6th April, total of 1210956 confirmed cases were reported globally with death rate of 5.58% [2]. Most confirmed cases were found in the European region with death rate 7.55% [2].
The ongoing outbreak of corona virus has gotten perhaps the greatest danger to the worldwide economy and monetary markets. Coronavirus impact on the worldwide economy have shaken markets around the world, plunging stock costs and security yields [62].
Although SARS-CoV-2 is an emerging virus, no specific treatment is currently available and pathophysiology of this condition is still unknown but we can control this epidemic followed by some rules and regulations such as: washing hands frequently and avoiding touching the eyes, nose, and mouth with contaminated hands, avoiding close contact, especially with those who have a fever, coughing or sneezing, avoiding contact with live animals and consuming raw animal products [63, 64]. Since SARS-CoV-2 is highly contagious, medical staff have a high risk of infection. Adult infected patients with COVID-19 in the perioperative period have a high risk of death. Therefore, there are some responsibilities for health policymakers in this critical situation in order to implement comprehensive protective measures such as quarantine, avoid traveling, and avoid gathering in public places essential to control this death trap.
4.1 Limitations
Limitations of this meta-analysis should be addressed. Firstly, all the studies included here from China, so the generalizability of findings to other countries and populations is not clear. The Chinese may differ to other populations in terms of their culture, prevalence of different clinical and comorbidities symptom, as well as their access to high quality medical services. Secondly, only English language articles were included in the analysis. Thirdly, the high heterogeneity could be found in the sample size. Fourthly, biasness and high heterogeneity among the results of the included studies were found for several variables. Fifthly, an evidence of publication bias was found for most of the variable but any remedial measure was not taken to solve it.
5. Conclusion
Like other respiratory diseases, COVID-19 disease also presented symptoms as fever, cough, fatigue, and dyspnea. The case fatality rate was high for COVID-19 infection among patients with a chronic conditions. A large number of COVID-19 infected patients needed intensive care unit, which is limited in the developing countries. COVID-19 outbreak is really a threat for most of the developing countries due to the living style of their population and also for limited resources.
Funding source
This research has no fund.
Ethical approval
Ethical approval is not required.
Conflict of Interest
Authors have no conflict of interest.
Authors Contributions
FMN and MMI formulated the research questions, designed the study, developed the search strategy, searched and collected the articles, conducted the quality assessment, analyzed the data and drafted the manuscript. Finally, both authors have read and approved the final version of the manuscript.
References
- Wu Z, McGoogan JM. Characteristics of and important lessons from the coronavirus disease 2019 (COVID-19) outbreak in China: summary of a report of 72 314 cases from the Chinese Center for Disease Control and Prevention. JAMA 323 (2020): 1239-1242.
- World Health Organization. Coronavirus disease 2019 (COVID-19): situation report, 77.
- Richman DD, Whitley RJ, Hayden FG, editors. Clinical virology. John Wiley & Sons (2016).
- Su S, Wong G, Shi W, et al. Epidemiology, genetic recombination, and pathogenesis of coronaviruses. Trends in Microbiology 24 (2016): 490-502.
- Cui J, Li F, Shi ZL. Origin and evolution of pathogenic coronaviruses. Nature Reviews Microbiology 17 (2019): 181-192.
- Zhu N, Zhang D, Wang W, et al. A novel coronavirus from patients with pneumonia in China, 2019. New England Journal of Medicine (2020).
- Xu X, Yu C, Qu J, et al. Imaging and clinical features of patients with 2019 novel coronavirus SARS-CoV-2. European Journal of Nuclear Medicine and Molecular Imaging (2020):1-6.
- Yuan J, Zou R, Zeng L, et al. The correlation between viral clearance and biochemical outcomes of 94 COVID-19 infected discharged patients. Inflammation Research (2020): 1-8.
- Li K, Fang Y, Li W, et al. CT image visual quantitative evaluation and clinical classification of coronavirus disease (COVID-19). European Radiology (2020): 1-10.
- Li YK, Peng S, Li LQ, et al. Clinical and transmission characteristics of Covid-19—a retrospective study of 25 cases from a single thoracic surgery department. Current Medical Science (2020): 1-6.
- Chen R, Zhang Y, Huang L, et al. Safety and efficacy of different anesthetic regimens for parturients with COVID-19 undergoing Cesarean delivery: a case series of 17 patients. Canadian Journal of Anesthesia/Journal Canadien D'Anesthésie (2020): 1-9.
- Shi Y, Yu X, Zhao H, et al. Host susceptibility to severe COVID-19 and establishment of a host risk score: findings of 487 cases outside Wuhan. Critical Care 24 (2020): 1-4.
- Wang K, Zhao W, Li J, et al. The experience of high-flow nasal cannula in hospitalized patients with 2019 novel coronavirus-infected pneumonia in two hospitals of Chongqing, China. Annals of Intensive Care 10 (2020): 1-5.
- Zhang S, Li H, Huang S, et al. High-resolution computed tomography features of 17 cases of coronavirus disease 2019 in Sichuan province, China. European Respiratory Journal 55 (2020).
- Wang L, Gao YH, Lou LL, et al. The clinical dynamics of 18 cases of COVID-19 outside of Wuhan, China. European Respiratory Journal 55 (2020).
- Ai T, Yang Z, Hou H, et al. Correlation of chest CT and RT-PCR testing in coronavirus disease 2019 (COVID-19) in China: a report of 1014 cases. Radiology (2020): 200642.
- Yang J, Zheng Y, Gou X, et al. Prevalence of comorbidities in the novel Wuhan coronavirus (COVID-19) infection: a systematic review and meta-analysis. International Journal of Infectious Diseases (2020).
- Rodriguez-Morales AJ, Cardona-Ospina JA, Gutiérrez-Ocampo E, et al. Clinical, laboratory and imaging features of COVID-19: A systematic review and meta-analysis. Travel Medicine and Infectious Disease (2020): 101623.
- Moher D, Liberati A, Tetzlaff J, et al. Preferred reporting items for systematic reviews and meta-analyses: the PRISMA statement. PLoS Med 6 (2009): e1000097.
- Margulis AV, Pladevall M, Riera-Guardia N, et al. Quality assessment of observational studies in a drug-safety systematic review, comparison of two tools: the Newcastle–Ottawa scale and the RTI item bank. Clinical Epidemiology 6 (2014): 359.
- DerSimonian R, Laird N. Meta-analysis in clinical trials. Controlled Clinical Trials 7 (1986): 177-188.
- Borenstein M, Hedges LV, Higgins JP, et al. Introduction to meta-analysis. John Wiley & Sons (2011).
- Higgins JP, Thompson SG. Quantifying heterogeneity in a meta-Statistics in Medicine 21 (2002): 1539-1558.
- Sutton AJ, Abrams KR, Jones DR, et al. Methods for meta-analysis in medical research. Chichester: Wiley (2000).
- To KK, Tsang OT, Leung WS, et al. Temporal profiles of viral load in posterior oropharyngeal saliva samples and serum antibody responses during infection by SARS-CoV-2: an observational cohort study. The Lancet Infectious Diseases (2020).
- Yang S, Shi Y, Lu H, et al. Clinical and CT features of early stage patients with COVID-19: a retrospective analysis of imported cases in Shanghai, China. European Respiratory Journal 55 (2020).
- Guan WJ, Liang WH, Zhao Y, et al. Comorbidity and its impact on 1590 patients with Covid-19 in China: A Nationwide Analysis. European Respiratory Journal 55 (2020).
- Spiteri G, Fielding J, Diercke M, et al. First cases of coronavirus disease 2019 (COVID-19) in the WHO European Region, 24 January to 21 February 2020. Eurosurveillance 25 (2020): 2000178.
- Lo IL, Lio CF, Cheong HH, et al. Evaluation of SARS-CoV-2 RNA shedding in clinical specimens and clinical characteristics of 10 patients with COVID-19 in Macau. International Journal of Biological Sciences 16 (2020): 1698.
- Yuan M, Yin W, Tao Z, et al. Association of radiologic findings with mortality of patients infected with 2019 novel coronavirus in Wuhan, China. Plos One 15 (2020): e0230548.
- Liu KC, Xu P, Lv WF, et al. CT manifestations of coronavirus disease-2019: a retrospective analysis of 73 cases by disease severity. European Journal of Radiology (2020): 108941.
- Wang K, Kang S, Tian R, et al. Imaging manifestations and diagnostic value of chest CT of coronavirus disease 2019 (COVID-19) in the Xiaogan area. Clinical Radiology (2020).
- Chen Z, Fan H, Cai J, et al. High-resolution computed tomography manifestations of COVID-19 infections in patients of different ages. European Journal of Radiology (2020): 108972.
- Zhao X, Liu B, Yu Y, et al. The characteristics and clinical value of chest CT images of novel coronavirus pneumonia. Clinical Radiology (2020).
- Zhou Z, Zhao N, Shu Y, et al. Effect of gastrointestinal symptoms on patients infected with COVID-19. Gastroenterology (2020).
- Chen H, Guo J, Wang C, et al. Clinical characteristics and intrauterine vertical transmission potential of COVID-19 infection in nine pregnant women: a retrospective review of medical records. The Lancet 395 (2020): 809-815.
- Zhou F, Yu T, Du R, et al. Clinical course and risk factors for mortality of adult inpatients with COVID-19 in Wuhan, China: a retrospective cohort study. The Lancet (2020).
- Yang W, Cao Q, Qin L, et al. Clinical characteristics and imaging manifestations of the 2019 novel coronavirus disease (COVID-19): A multi-center study in Wenzhou city, Zhejiang, China. Journal of Infection (2020).
- Xu YH, Dong JH, An WM, et al. Clinical and computed tomographic imaging features of novel coronavirus pneumonia caused by SARS-CoV-2. Journal of Infection (2020).
- Ye G, Pan Z, Pan Y, et al. Clinical characteristics of severe acute respiratory syndrome coronavirus 2 reactivation. Journal of Infection (2020).
- Chen J, Qi T, Liu L, et al. Clinical progression of patients with COVID-19 in Shanghai, China. Journal of Infection (2020).
- Wang L, He W, Yu X, et al. Coronavirus Disease 2019 in elderly patients: characteristics and prognostic factors based on 4-week follow-up. Journal of Infection (2020).
- Xu T, Chen C, Zhu Z, et al. Clinical features and dynamics of viral load in imported and non-imported patients with COVID-19. International Journal of Infectious Diseases (2020).
- Zhang X, Cai H, Hu J, et al. Epidemiological, clinical characteristics of cases of SARS-CoV-2 infection with abnormal imaging findings. International Journal of Infectious Diseases (2020).
- Shi H, Han X, Jiang N, et al. Radiological findings from 81 patients with COVID-19 pneumonia in Wuhan, China: a descriptive study. The Lancet Infectious Diseases (2020).
- Yu N, Li W, Kang Q, et al. Clinical features and obstetric and neonatal outcomes of pregnant patients with COVID-19 in Wuhan, China: a retrospective, single-centre, descriptive study. The Lancet Infectious Diseases (2020).
- Huang Y, Tu M, Wang S, et al. Clinical characteristics of laboratory confirmed positive cases of SARS-CoV-2 infection in Wuhan, China: A retrospective single center analysis. Travel Medicine and Infectious Disease (2020).
- Yang X, Yu Y, Xu J, et al. Clinical course and outcomes of critically ill patients with SARS-CoV-2 pneumonia in Wuhan, China: a single-centered, retrospective, observational study. The Lancet Respiratory Medicine (2020).
- Tian S, Hu N, Lou J, et al. Characteristics of COVID-19 infection in Beijing. Journal of Infection (2020).
- Zhang L, Zhu F, Xie L, et al. Clinical characteristics of COVID-19-infected cancer patients: A retrospective case study in three hospitals within Wuhan, China. Annals of Oncology (2020).
- Liu F, Xu A, Zhang Y, et al. Patients of COVID-19 may benefit from sustained lopinavir-combined regimen and the increase of eosinophil may predict the outcome of COVID-19 progression. International Journal of Infectious Diseases (2020).
- Zhang JJ, Dong X, Cao YY, et al. Clinical characteristics of 140 patients infected with SARS-CoV-2 in Wuhan, China. Allergy (2020).
- Xu XW, Wu XX, Jiang XG, et al. Clinical findings in a group of patients infected with the 2019 novel coronavirus (SARS-Cov-2) outside of Wuhan, China: retrospective case series. BMJ 368 (2020).
- Chen T, Wu D, Chen H, et al. Clinical characteristics of 113 deceased patients with coronavirus disease 2019: retrospective study. BMJ 368 (2020).
- Wang D, Hu B, Hu C, et al. Clinical characteristics of 138 hospitalized patients with 2019 novel coronavirus–infected pneumonia in Wuhan, China. Jama 323 (2020): 1061-1069.
- Shi S, Qin M, Shen B, et al. Association of cardiac injury with mortality in hospitalized patients with COVID-19 in Wuhan, China. JAMA cardiology (2020).
- Han R, Huang L, Jiang H, et al. Early clinical and CT manifestations of coronavirus disease 2019 (COVID-19) pneumonia. American Journal of Roentgenology (2020): 1-6.
- Wu J, Wu X, Zeng W, et al. Chest CT findings in patients with coronavirus disease 2019 and its relationship with clinical features. Investigative Radiology 55 (2020): 257-261.
- Guan WJ, Ni ZY, Hu Y, et al. Clinical characteristics of coronavirus disease 2019 in China. New England Journal of Medicine 382 (2020): 1708-1720.
- Huang C, Wang Y, Li X, et al. Clinical features of patients infected with 2019 novel coronavirus in Wuhan, China. The Lancet 395 (2020): 497-506.
- Jain V, Yuan JM. Systematic review and meta-analysis of predictive symptoms and comorbidities for severe COVID-19 infection. MedRxiv (2020).
- 6 charts show the coronavirus impact on the global economy and markets so far. www.cnbc.com › 2020/03/12 › coronavirus-impact-on-global-econo (2020).
- Emami A, Javanmardi F, Pirbonyeh N, et al. Prevalence of underlying diseases in hospitalized patients with COVID-19: a systematic review and meta-analysis. Archives of Academic Emergency Medicine 8 (2020).
- Lin HT, Xiang YF, Cui TX, et al. Online learning-related visual impairment and preventive measures during the 2019 novel coronvirus outbreak. [Zhonghua yan ke za zhi] Chinese Journal of Ophthalmology 56 (2020): E004.
Supplementary Information:
Forest plot:
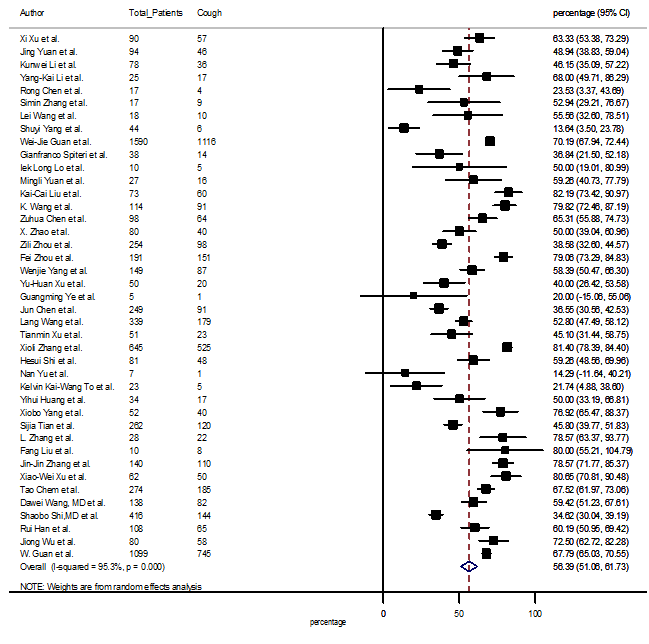
S1 Figure: Forest Plot for the prevalence of variable cough.
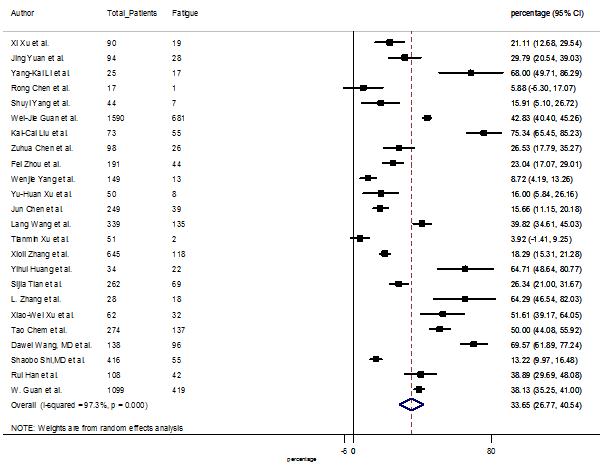
S2 Figure: Forest Plot for the prevalence of variable fatigue.
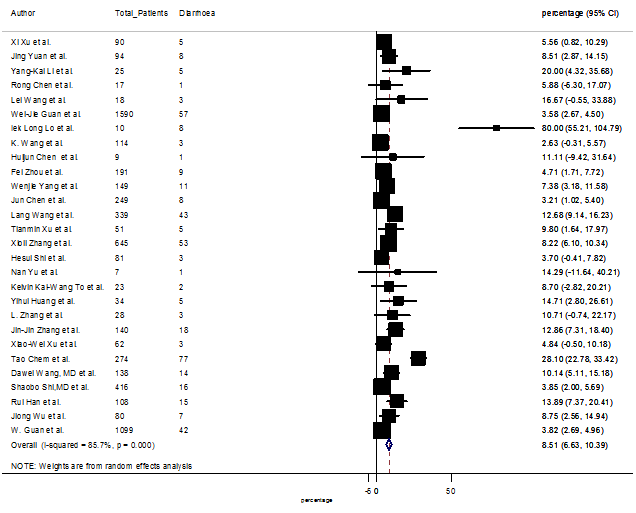
S3 Figure: Forest Plot for the prevalence of variable diarrhea.
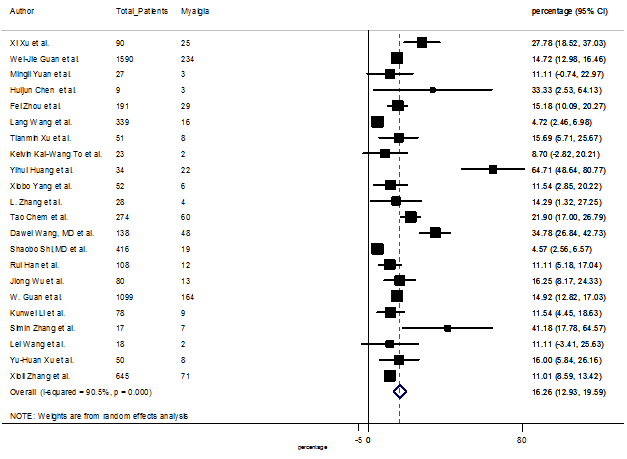
S4 Figure: Forest Plot for the prevalence of variable myalgia.
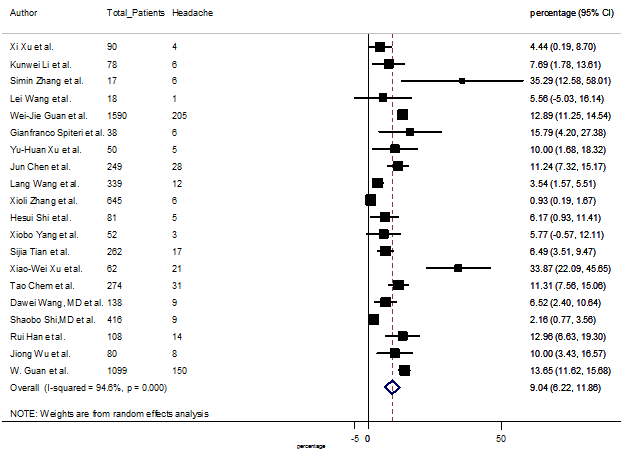
S5 Figure: Forest Plot for the prevalence of variable headache.
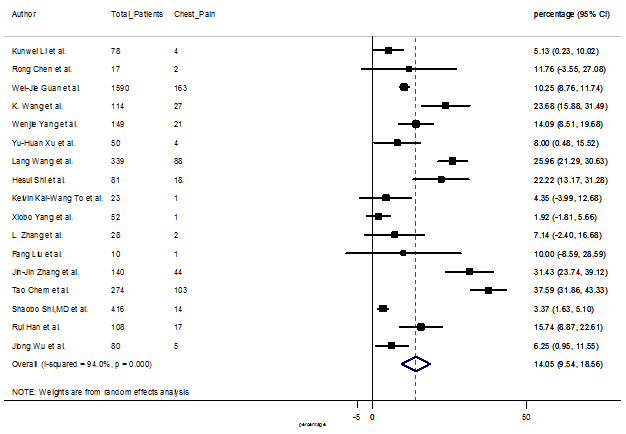
S6 Figure: Forest Plot for the prevalence of variable chest pain.
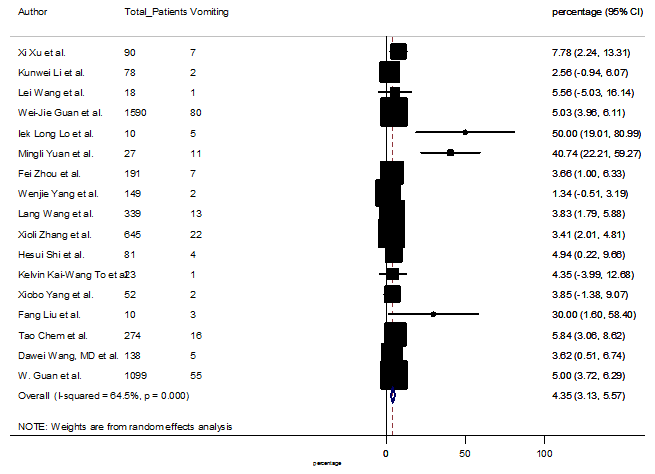
S7 Figure: Forest Plot for the prevalence of variable vomiting.
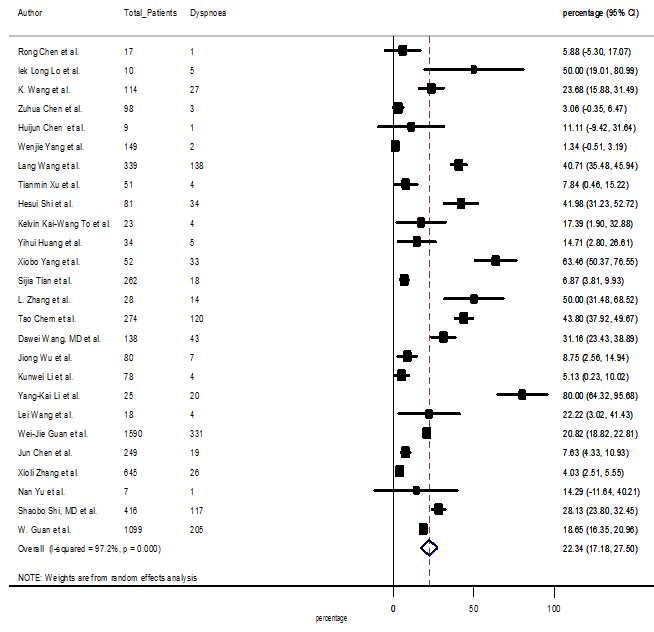
S8 Figure: Forest Plot for the prevalence of variable dyspnea.
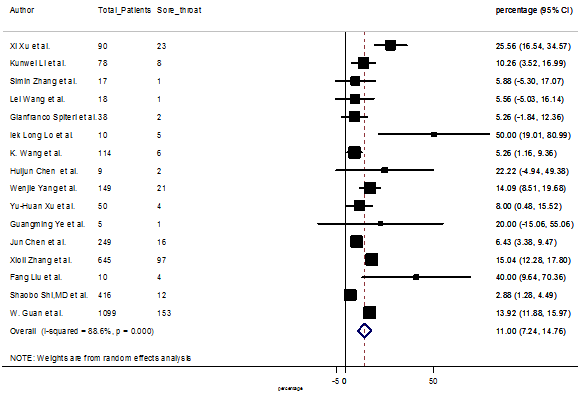
S9 Figure: Forest Plot for the prevalence of variable sore throat.
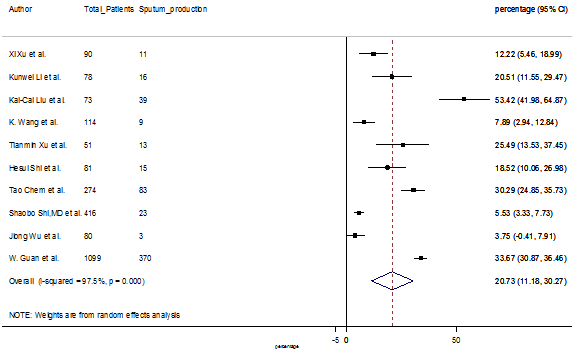
S10 Figure: Forest Plot for the prevalence of variable sputum production.
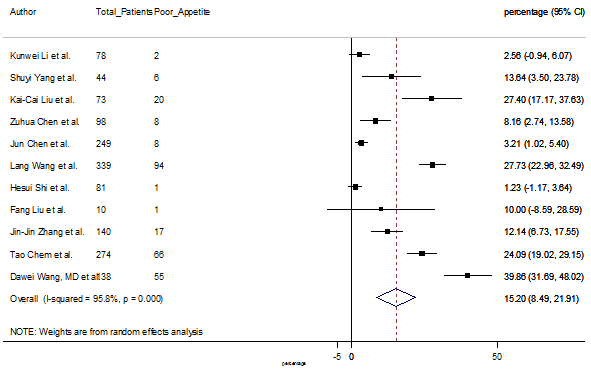
S11 Figure: Forest Plot for the prevalence of variable poor appetite.
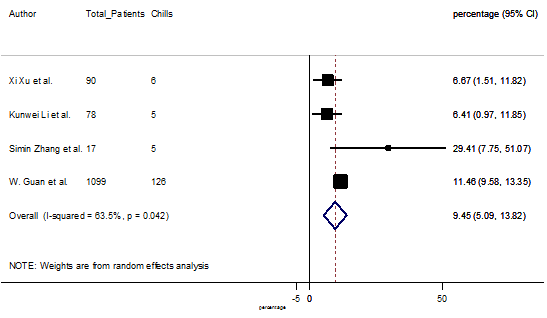
S12 Figure: Forest Plot for the prevalence of variable chills.
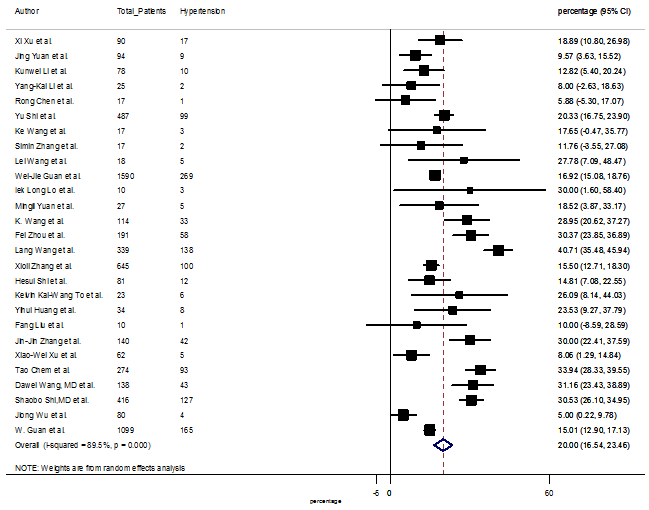
S13 Figure: Forest Plot for the prevalence of variable hypertension.
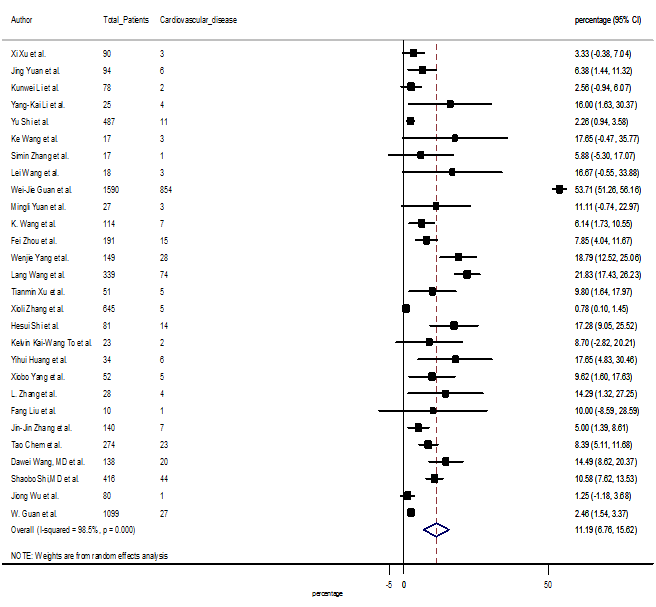
S14 Figure: Forest Plot for the prevalence of variable cardiovascular disease.
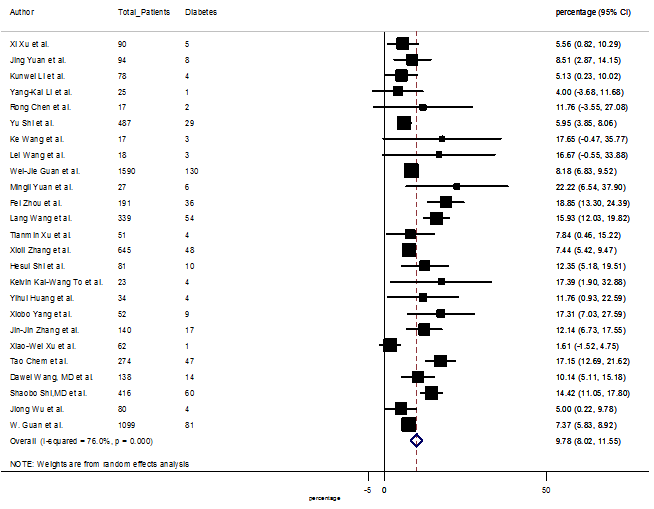
S15 Figure: Forest Plot for the prevalence of variable diabetes.
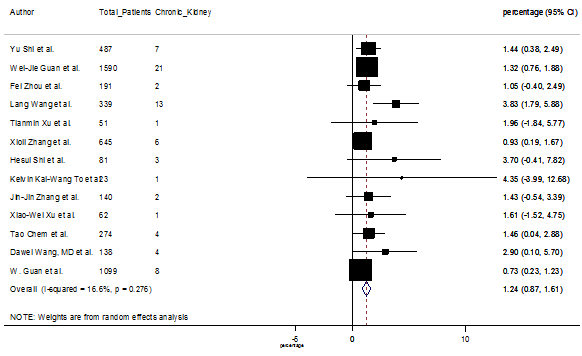
S16 Figure: Forest Plot for the prevalence of variable chronic kidney disease.
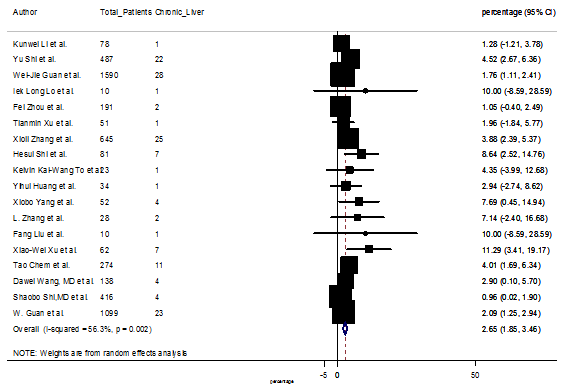
S17 Figure: Forest Plot for the prevalence of variable chronic liver disease.
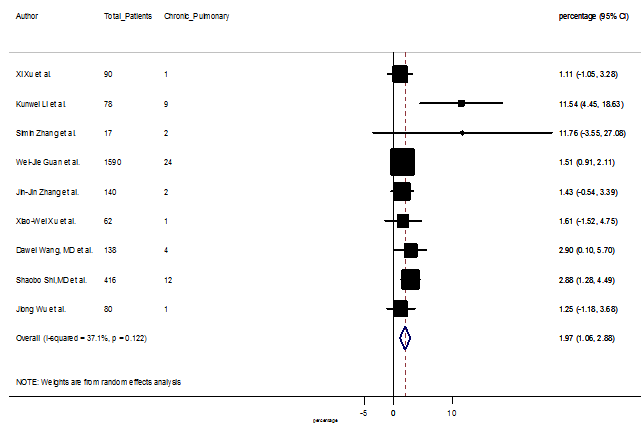
S18 Figure: Forest Plot for the prevalence of variable chronic pulmonary disease.
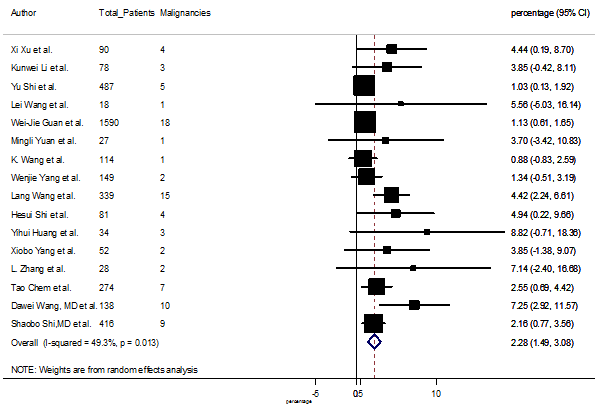
S19 Figure: Forest Plot for the prevalence of variable malignancies.
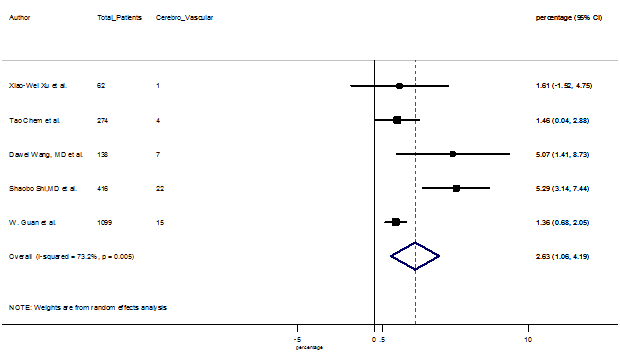
S20 Figure: Forest Plot for the prevalence of variable cerebrovascular disease.
Funnel Plot:
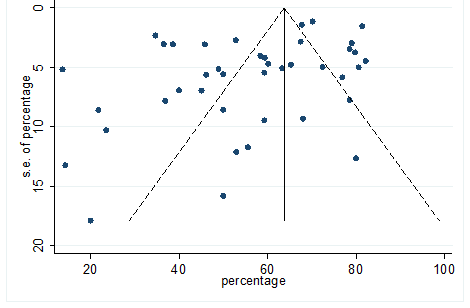
S21 Figure: Funnel Plot for detecting publication bias of variable cough.
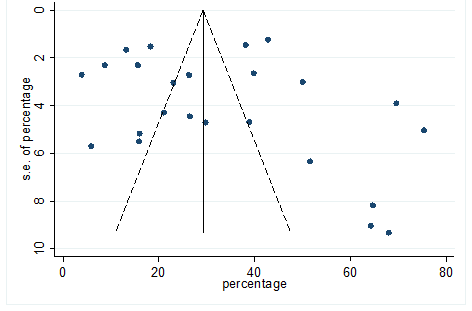
S22 Figure: Funnel Plot for detecting publication bias of variable fatigue.
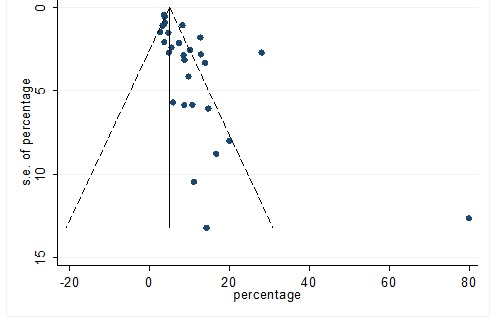
S23 Figure: Funnel Plot for detecting publication bias of variable diarrhea.
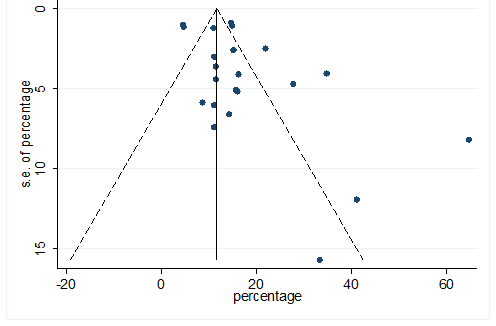
S24 Figure: Funnel Plot for detecting publication bias of variable myalgia.
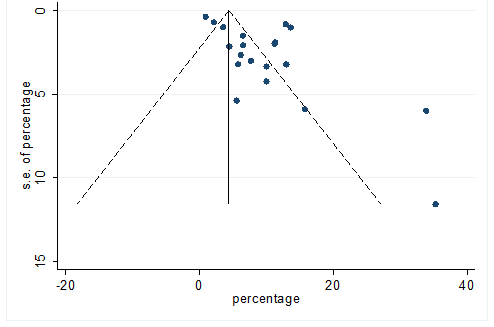
S25 Figure: Funnel Plot for detecting publication bias of variable headache.
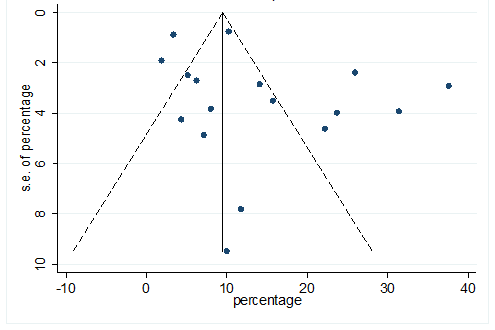
S26 Figure: Funnel Plot for detecting publication bias of variable chest pain.
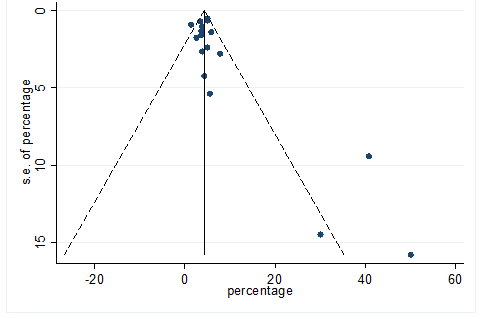
S27 Figure: Funnel Plot for detecting publication bias of variable vomiting.
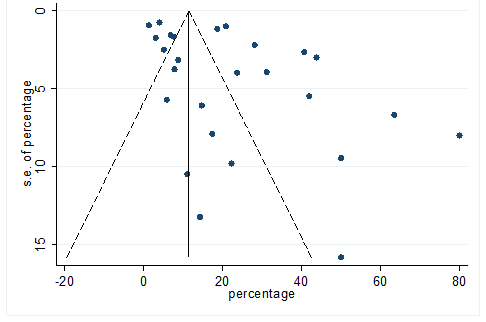
S28 Figure: Funnel Plot for detecting publication bias of variable dyspnea.
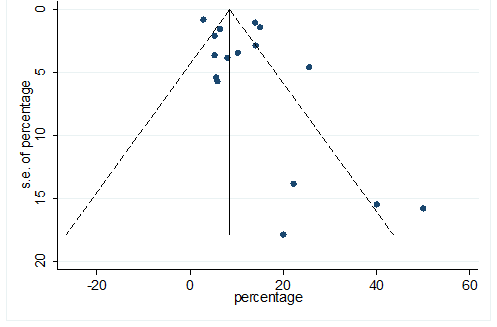
S29 Figure: Funnel Plot for detecting publication bias of variable sore throat.
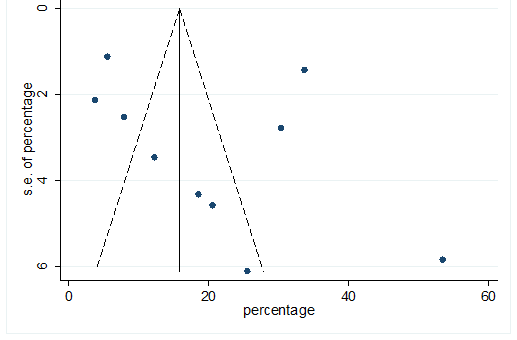
S30 Figure: Funnel Plot for detecting publication bias of variable sputum production.
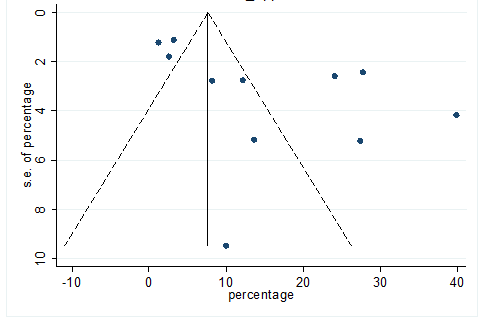
S31 Figure: Funnel Plot for detecting publication bias of variable poor appetite.
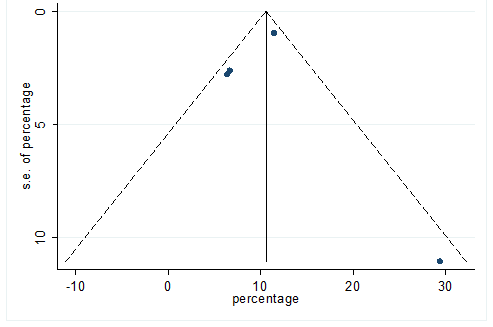
S32 Figure: Funnel Plot for detecting publication bias of variable chills.
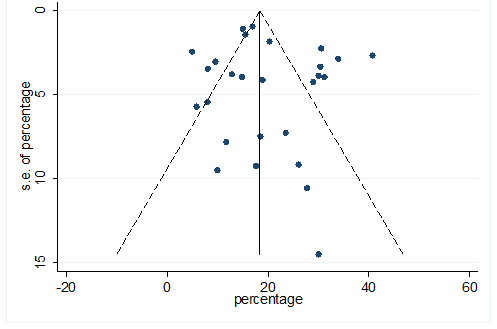
S33 Figure: Funnel Plot for detecting publication bias of variable hypertension.
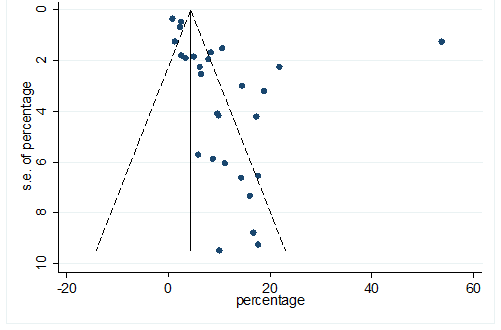
S34 Figure: Funnel Plot for detecting publication bias of variable cardiovascular disease.
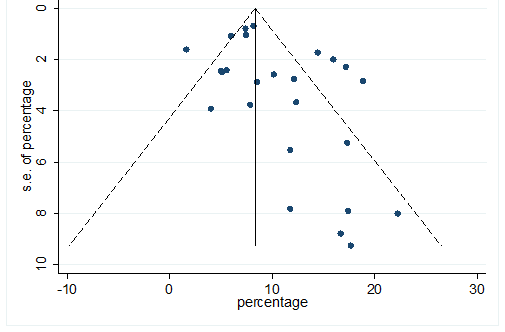
S35 Figure: Funnel Plot for detecting publication bias of variable diabetes.
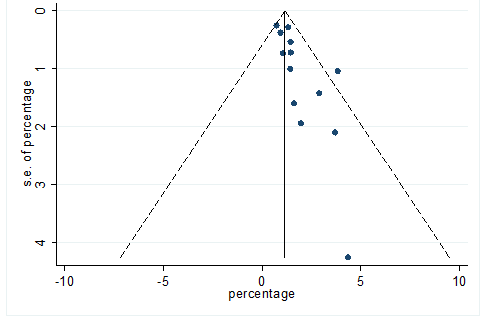
S36 Figure: Funnel Plot for detecting publication bias of variable chronic kidney disease.
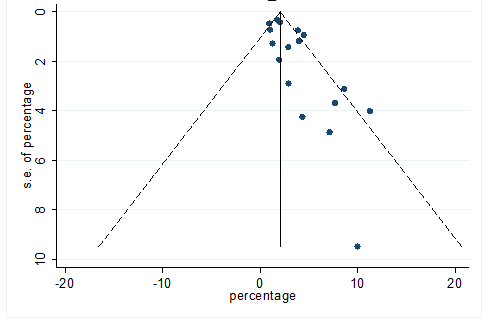
S37 Figure: Funnel Plot for detecting publication bias of variable chronic liver disease.
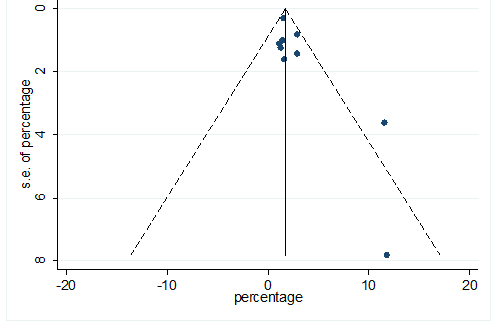
S38 Figure: Funnel Plot for detecting publication bias of variable chronic pulmonary disease.
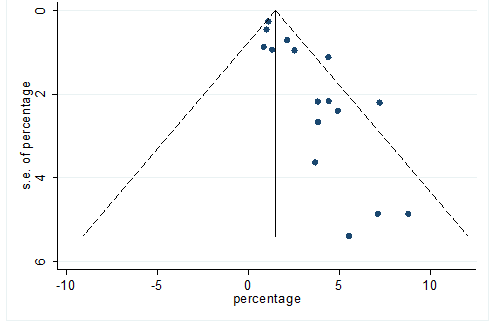
S39 Figure: Funnel Plot for detecting publication bias of variable malignancies.
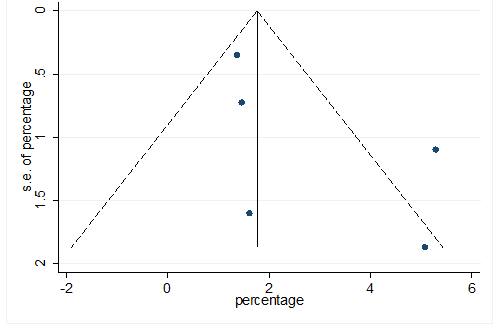
S40 Figure: Funnel Plot for detecting publication bias of variable cerebrovascular disease.


 Impact Factor: * 5.814
 CiteScore: 2.9
  Acceptance Rate: 11.01%
  Time to first decision: 10.4 days
  Time from article received to acceptance: 2-3 weeks