Determination of Mass Transfer Coefficients for Adsorption of Pb and Cd Onto Coir Pith and Statistical Analysis
Padma Amarasinghe*, Kasun Amarasinghe
Department of Chemical and Process Engineering, Faculty of Engineering, University of Moratuwa, Moratuwa, Sri Lanka
*Corresponding Author: Padma Amarasinghe, Department of Chemical and Process Engineering, Faculty of Engineering, University of Moratuwa, Moratuwa, Sri Lanka
Received: 20 November 2020; Accepted: 27 November 2020; Published: 30 November 2020
Article Information
Citation: Padma Amarasinghe, Kasun Amarasinghe. Determination of Mass Transfer Coefficients for Adsorption of Pb and Cd Onto Coir Pith and Statistical Analysis. Journal of Analytical Techniques and Research 2 (2020): 137-148.
View / Download Pdf Share at FacebookAbstract
Adsorption of Pb and Cd ions onto coir pith from single solute aqueous solutions was studied. Experimental data on variation of solute concentration in the solution with time were fitted to exponential kinetic model and model parameters were determined. New parameter, concentration decay constant, was introduced to comprehend the adsorption rate. Novel method was introduced to determine the liquid film mass transfer coefficient (kL) accurately using the exponential kinetic model equation. Liquid film mass transfer coefficient and Overall liquid phase mass transfer coefficient were calculated and the proposed method overcomes the errors due to approximation of initial rate of change of solute concentration and assumption of linear isotherm parameters. Statistical analysis of mass transfer coefficients showed that for all the parameters tested the variation of the parameters are significant with initial solution concentration for Pb.
Keywords
Coir pith; Pb; Cd; Adsorption; Concentration decay; Mass transfer coefficients (KL); Statistical analysis
Coir pith articles; Pb articles; Cd articles; Adsorption articles; Concentration decay articles; Mass transfer coefficients (KL) articles; Statistical analysis articles
Coir pith articles Coir pith Research articles Coir pith review articles Coir pith PubMed articles Coir pith PubMed Central articles Coir pith 2023 articles Coir pith 2024 articles Coir pith Scopus articles Coir pith impact factor journals Coir pith Scopus journals Coir pith PubMed journals Coir pith medical journals Coir pith free journals Coir pith best journals Coir pith top journals Coir pith free medical journals Coir pith famous journals Coir pith Google Scholar indexed journals Pb articles Pb Research articles Pb review articles Pb PubMed articles Pb PubMed Central articles Pb 2023 articles Pb 2024 articles Pb Scopus articles Pb impact factor journals Pb Scopus journals Pb PubMed journals Pb medical journals Pb free journals Pb best journals Pb top journals Pb free medical journals Pb famous journals Pb Google Scholar indexed journals Cd articles Cd Research articles Cd review articles Cd PubMed articles Cd PubMed Central articles Cd 2023 articles Cd 2024 articles Cd Scopus articles Cd impact factor journals Cd Scopus journals Cd PubMed journals Cd medical journals Cd free journals Cd best journals Cd top journals Cd free medical journals Cd famous journals Cd Google Scholar indexed journals Adsorption articles Adsorption Research articles Adsorption review articles Adsorption PubMed articles Adsorption PubMed Central articles Adsorption 2023 articles Adsorption 2024 articles Adsorption Scopus articles Adsorption impact factor journals Adsorption Scopus journals Adsorption PubMed journals Adsorption medical journals Adsorption free journals Adsorption best journals Adsorption top journals Adsorption free medical journals Adsorption famous journals Adsorption Google Scholar indexed journals Concentration decay articles Concentration decay Research articles Concentration decay review articles Concentration decay PubMed articles Concentration decay PubMed Central articles Concentration decay 2023 articles Concentration decay 2024 articles Concentration decay Scopus articles Concentration decay impact factor journals Concentration decay Scopus journals Concentration decay PubMed journals Concentration decay medical journals Concentration decay free journals Concentration decay best journals Concentration decay top journals Concentration decay free medical journals Concentration decay famous journals Concentration decay Google Scholar indexed journals Mass transfer coefficients (KL) articles Mass transfer coefficients (KL) Research articles Mass transfer coefficients (KL) review articles Mass transfer coefficients (KL) PubMed articles Mass transfer coefficients (KL) PubMed Central articles Mass transfer coefficients (KL) 2023 articles Mass transfer coefficients (KL) 2024 articles Mass transfer coefficients (KL) Scopus articles Mass transfer coefficients (KL) impact factor journals Mass transfer coefficients (KL) Scopus journals Mass transfer coefficients (KL) PubMed journals Mass transfer coefficients (KL) medical journals Mass transfer coefficients (KL) free journals Mass transfer coefficients (KL) best journals Mass transfer coefficients (KL) top journals Mass transfer coefficients (KL) free medical journals Mass transfer coefficients (KL) famous journals Mass transfer coefficients (KL) Google Scholar indexed journals Statistical analysis articles Statistical analysis Research articles Statistical analysis review articles Statistical analysis PubMed articles Statistical analysis PubMed Central articles Statistical analysis 2023 articles Statistical analysis 2024 articles Statistical analysis Scopus articles Statistical analysis impact factor journals Statistical analysis Scopus journals Statistical analysis PubMed journals Statistical analysis medical journals Statistical analysis free journals Statistical analysis best journals Statistical analysis top journals Statistical analysis free medical journals Statistical analysis famous journals Statistical analysis Google Scholar indexed journals aqueous solutions articles aqueous solutions Research articles aqueous solutions review articles aqueous solutions PubMed articles aqueous solutions PubMed Central articles aqueous solutions 2023 articles aqueous solutions 2024 articles aqueous solutions Scopus articles aqueous solutions impact factor journals aqueous solutions Scopus journals aqueous solutions PubMed journals aqueous solutions medical journals aqueous solutions free journals aqueous solutions best journals aqueous solutions top journals aqueous solutions free medical journals aqueous solutions famous journals aqueous solutions Google Scholar indexed journals exponential kinetic model equation articles exponential kinetic model equation Research articles exponential kinetic model equation review articles exponential kinetic model equation PubMed articles exponential kinetic model equation PubMed Central articles exponential kinetic model equation 2023 articles exponential kinetic model equation 2024 articles exponential kinetic model equation Scopus articles exponential kinetic model equation impact factor journals exponential kinetic model equation Scopus journals exponential kinetic model equation PubMed journals exponential kinetic model equation medical journals exponential kinetic model equation free journals exponential kinetic model equation best journals exponential kinetic model equation top journals exponential kinetic model equation free medical journals exponential kinetic model equation famous journals exponential kinetic model equation Google Scholar indexed journals solution concentration articles solution concentration Research articles solution concentration review articles solution concentration PubMed articles solution concentration PubMed Central articles solution concentration 2023 articles solution concentration 2024 articles solution concentration Scopus articles solution concentration impact factor journals solution concentration Scopus journals solution concentration PubMed journals solution concentration medical journals solution concentration free journals solution concentration best journals solution concentration top journals solution concentration free medical journals solution concentration famous journals solution concentration Google Scholar indexed journals
Article Details
Introduction
Rapid industrialization over the past few decades has caused many adverse effects on the environment. Release of heavy metals into water streams is of major concern. Among many methods available for removal of heavy metals from water researchers have paid considerable attention on adsorption. Plant materials have been used as low cost adsorbents in many researches. Tea waste, rice husk, coir pith, corn cobs, sunflower stalks and many other biomass materials have been tested for the removal of heavy metals from wastewater [1-6]. However, most of the batch adsorption work is limited to determination of equilibrium data, kinetic and thermodynamic parameters. Mass transfer coefficient is an important parameter in any unit operation and less attention has been paid for this aspect in adsorption studies. Few researchers who have studied on mass transfer coefficient calculations have limited the studies to approximate methods and linear form of equilibrium isotherms [7-9]. Therefore, the objectives of this work are to investigate on removal of Cd and Pb using coir pith as an adsorbent, to determine mass transfer coefficients for the process and to analyze the results statistically.
Theory on Mass Transfer Coefficient Calculations
Adsorption of Pb and Cd ions onto coir pith from the aqueous phase involves three stages [7-9];
- I. Transport of heavy metal ions through the fluid film around the particle.
- II. Diffusion of heavy metal ions from the surface through the pores to internal active sites.
- III. Adsorption of metal ions on the active sites, through binding of the ions to the active sites.
Last step is usually rapid and hence steps one or two becomes the rate limiting step. The rate of mass transfer is determined using mass transfer coefficients and the driving force. Hence, calculation of the mass transfer coefficients and determination of the rate controlling step are important for any adsorption process. Theory on mass transfer used for mass transfer coefficient calculation is discussed in this section.
Liquid Film Mass Transfer Coefficient
For batch adsorption processes concentration of the solute in the bulk solution can be assumed to be constant. Then, the first step in mass transfer analysis is the diffusion of the solute through the film around the adsorbent particle. Driving force for the mass transfer across the film is the Where, C is the heavy metal concentration in the solution at time t (mg/L), Cs is the heavy metal concentration in the solution at solid surface time t (mg/L), The rate of change of heavy metal concentration in the solution is given by equation 1 [7,8,10,11-13].

t is the time in s, kL liquid film mass transfer coefficient in m/s and S is the surface area of the adsorbent per unit volume of the particle free solution (m-1).
At time t=0, Cs=0, C=C0 and hence the liquid film mass transfer coefficient is given by equation 2.

Liquid film mass transfer coefficient can be determined from the gradient of the C/C0 verses time plot at time = 0.
Overall Mass Transfer Coefficient
Another method of mass transfer analysis is by combining the film diffusion and diffusion in the particle together. Some authors express this method as lumped parameter mass transfer analysis [10]. Rate of change of solution concentration can be expressed in terms of the overall mass transfer coefficient (KL) as per equation 3 [9,10,14-16].

Where, KL is liquid phase overall mass transfer coefficient in m/s, S is surface area of the adsorbent per unit volume of particle free solution in m-1, C is the solute concentration in the solution at time t, C* is the solute concentration in the solution in equilibrium with the adsorbent at time t.
Overall mass transfer coefficient can be determined from the equation (4) obtained by rearranging and integrating the equation 3 between the boundary conditions; when t=0, C=C0, q=0, C*=0 and when t=t, C=C, q=q, C*=equilibrium concentration of solution with q where q is the solid phase solute concentration (mg/g) at time t.

The relation between q and C atαgiven time can be obtained by the material balance. Applying the material balance for the solute (metal ion) at t = t equation 5 is obtained.

Where W is the weight of adsorbent in the solution (g/L)
Solute uptake (q) and C* are related by the equilibrium isotherm equations [5,7,17]. In this study Freundlich isotherm given by equation 6 was observed as the best fit and presented.

Hence, the C* value corresponding to any C value can be determined from equations (5) and (6) and the integral on the right hand side of the equation 4 can be determined graphically or analytically and KL can be calculated. Combining equations 4, 5 and 6, Equation 7 is obtained which can be used to determine KL when experimental data is available or to determine the time required forαgiven concentration drop when KL and equilibrium data are known.

Materials and Methods
Preparation of the Adsorbent
Coir pith (CP) was obtained from Sri Lankan coir mills. The coir pith was washed with hot water at 80°C several times until the water was virtually colourless. The bio mass was then washed with distilled water and were oven dried for 12 hrs at 85°C. The dried material was sieved and stored in sealed polythene bags. The fraction between 350-850 mm was used for all the experiments.
Synthetic Waste Water Preparation
Synthetic wastewater solutions were prepared by dissolving analytical grade Pb (NO3) and Cd (NO3)2. 3H2O in distilled water to obtain 1000 mg of metal/L solutions. The solution was diluted to the required concentration for experiments. The pH of the solution was measured and observed as 5.5±0.5 and no chemicals were added to change pH. Our previous works on adsorption of heavy metal ions [5] have shown that biomass materials possess highest adsorption above pH 5.
Adsorption Tests
Batch adsorption tests were conducted at room temperature 25°C by mixing known weight of adsorbent and solution of known single metal-ion concentration. The mixture was shaken inαmechanical shaker and samples of solution were withdrawn from the bottle at known time intervals and analyzed for the metal ion using atomic absorption spectrophotometer. Experiments were conducted to determine the kinetics and equilibrium data for adsorption of Cd and Pb onto coir pith.
The adsorption experiments were performed in duplicate to observe the reproducibility.
Metal Analysis and Adsorbent Characterization
Atomic absorption spectrophotometer with an air-acetylene flame and hollow cathode lamps for Pb and Cd was used for metal ion analysis. The absorbance of the samples was read in triplicate. True and bulk densities of adsorbents were also determined using the specific gravity bottle method. The particle size was measured by sieve analysis.
Results and Discussion
Physical Properties of Coir Pith
Physical properties of the adsorbent coir pith, mean particle size, bulk density and true density were observed as 513 mm, 116 kg/m3 and 799 kg/m3 respectively.
Equilibrium Isotherm
Metal ion concentrations obtained from adsorption experiments were converted to mg of metal ion adsorbed per gram of adsorbent (q) values. Equilibrium data for adsorption of each metal ion onto coir pith was fitted to Freundlich isotherm with coefficient of determination (R2) values above 0.9 and the equations 8 and 9 were obtained for Pb and Cd adsorption onto coir pith respectively. Isotherm parameters will be used to determine the mass transfer coefficients in the subsequent sections.

Model Fitting
Heavy metal ion concentration, C, asαfunction of time, t, data obtained from batch experiments for adsorption of Pb and Cd from single solute solutions were fitted to the exponential kinetic equation given by 10. The model parameters were determined by non-linear regression using Microsoft Excel Solver. Parameters thus obtained are presented in Table 1. Experimentally determined C/C0 verses time results are compared with fitted curves and presented in Figure 1 and 2. α and γ are dimensionless parameters and β is a parameter proportional to adsorption rate.

Applying boundary conditions to the equation 10; At t = 0, C/C0 = 1 and hence theoretically sum of α and γ is equal to one. When t à∞, C/C0=C∞/C0= γ.
Therefore, γ= C∞/C0 = fraction retained in the solution,
a = 1-g = (Co-C∞)/C0 = fraction adsorbed
Hence, the equation 10 can be further simplified as equation 11 or equation 12;

New parameter b is defined as the concentration decay constant. γ depends on the adsorption capacity of the given solute onto the adsorbent. Higher the adsorption capacity the lower the value of theγand vice versa. This effect can be seen from the Figure 1 and 2 and the parameter values in Table 1. Adsorption capacity of Pb onto coir pith is higher than that for Cd and hence lower values of γ were observed for Pb compared to Cd. Further, sum of a andγvalues for a given test is very close to one in all cases tested as shown in Table 1. Equations of similar form have been presented by other workers for batch adsorption [9,15].
Parameters a, b and γ values vary with the initial solution concentration C0, and the parameters were fitted to non-linear functions of C0. A program was written in Python programming language to produce 3-D plots of C/C0 as a function of C0 and time. The surface plots are shown in Figure 3 and 4, and the effect of C0 on Cd and Pb adsorption rates are clearly visualize from the plots.
Table 1: Parameters of exponential kinetic equation (equation 10) for adsorption of Pb and Cd onto coir pith at 25°C
|
C0 |
Pb |
Cd |
||||||||
|
mg/L |
a |
b (min-1) |
g |
RMSE |
R2 |
a |
b (min-1) |
g |
RMSE |
R2 |
|
50 |
0.959 |
0.441 |
0.040 |
0.0168 |
0.9979 |
0.848 |
0.365 |
0.151 |
0.0153 |
0.9978 |
|
100 |
0.923 |
0.284 |
0.075 |
0.0270 |
0.9942 |
0.550 |
0.297 |
0.449 |
0.0114 |
0.9970 |
|
150 |
0.834 |
0.271 |
0.163 |
0.0276 |
0.9926 |
0.400 |
0.335 |
0.599 |
0.0156 |
0.9898 |
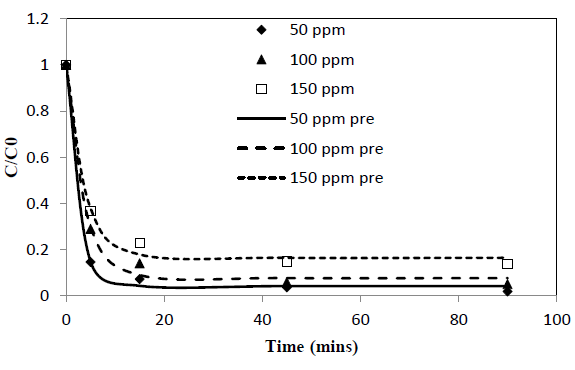
Figure 1: C/Co vs time for adsorption of Pb ions onto coir pith at 25°C, adsorbent dose =2.5 g/L
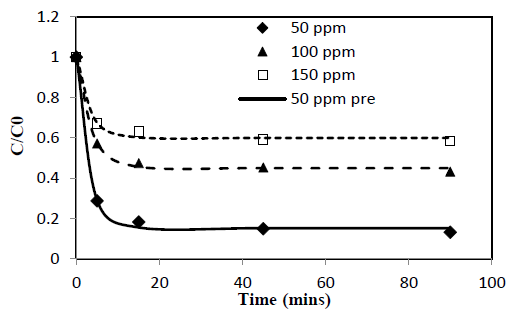
Figure 2: C/Co vs time for adsorption of Cd ions onto coir pith at 25°C, adsorbent dose =2.5 g/L
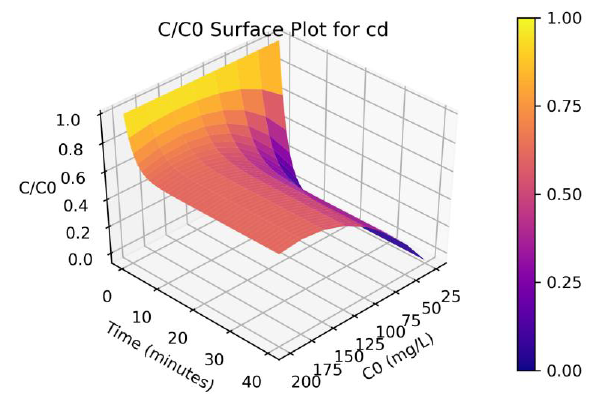
Figure 3: Surface plots of C/Co as a function of time and C0 for adsorption of Cd ions onto coir pith at 25°C, adsorbent dose =2.5 g/L
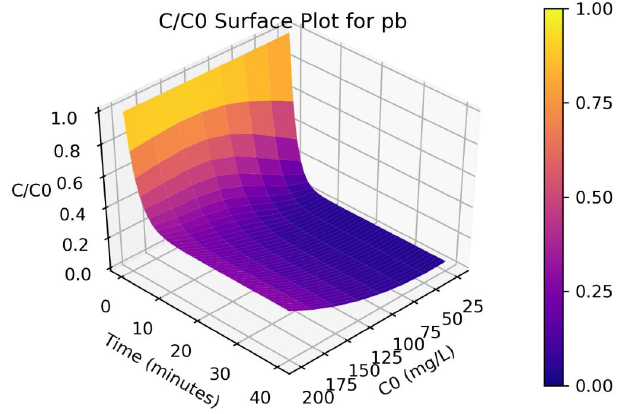
Figure 4: Surface plots of C/Co as a function of time and C0 for adsorption of Pb ions onto coir pith at 25°C, adsorbent dose =2.5 g/L
Determination of Mass Transfer Coefficient
Liquid Film Mass Transfer Coefficient
Liquid film mass transfer coefficient, kL was calculated as follows. Derivative of the equation 10 at time à0 is given by equation 13. Combining equation 2 and the equation 13, equation 14 is obtained and can be used to determine kL.
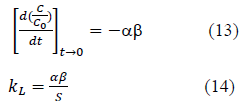
Where, S is the surface area of adsorbent particles per unit volume of particle free solution. Particles were assumed to be spherical and the surface area S was calculated. Liquid film mass transfer coefficient, kL, values thus obtained are shown in Table 2. Values are in the same order of magnitude as the values obtained by Maria and Mansur (2016) for adsorption of Mn onto Bone char, Sag et.al (2000) for adsorption of Cr onto Chitin, Yao et. al (2015) for adsorption of toluene onto activated carbon and Piccin et. al. (2017) for adsorption of Acid Red 357 and Acid Black 210 by tannery solid wastes [11,12,18,19].
Table 2: Mass transfer parameters for adsorption of Pb and Cd ions onto coir pith at 25°C
|
Metal ion |
Initial Concentration (C0) (mg/L) |
External liquid film mass transfer coefficient kL (m/s) (Proposed method in this work, eqn 14) |
External liquid film mass transfer coefficient kL (m/s) (using initial period gradient) |
Overall liquid phase mass transfer coefficient KL(m/s) eqn 4 |
|
Pb |
50 |
1.9269 x 10⁻⁴ |
7.78 x 10⁻⁵ |
2.7927 x 10⁻⁵ |
|
100 |
1.1959 x 10⁻⁴ |
6.49 x 10⁻⁵ |
2.2015 x 10⁻⁵ |
|
|
150 |
1.0331 x 10⁻⁴ |
5.76 x 10⁻⁵ |
1.3284 x 10⁻⁵ |
|
|
Cd |
50 |
1.4106 x 10⁻⁴ |
6.50 x 10⁻⁵ |
1.6208 x 10⁻⁵ |
|
100 |
7.4529 x 10⁻⁵ |
3.90 x 10⁻⁵ |
5.5866 x 10⁻⁵ |
|
|
150 |
6.1186 x 10⁻⁵ |
2.99 x 10⁻⁵ |
3.3938 x 10⁻⁵ |
Most of the previous work on mass transfer coefficient calculations have either assumed a linear isotherm or used the slope of the C/C0 vs time plot to determine the kL values (0 to 1 min) [8,13,20]. However, this is not accurate as the isotherms are not linear for most of the systems and further assumption Cs = 0 is valid only at t = 0. The kL values determined using the slope of the C/C0 vs t plot over the initial adsorption period are also presented in Table 2, and the results show that the use of gradient underestimates the kL value. This is because the slope is the average value over the initial period but not the exact value at t=0. Therefore, the proposed method (equation 13 and 14) in this work can be used to determine the kL value more accurately.
Further, the derivative of the equation 12, which is given by equation 15, can be used to determine the rate of change of concentration in the solution at any given time.

The effect of the concentration decay constant, b, on the concentration profile was analyzed by substituting b=b/4, b=b/2, b=b and b=2b onto the equation 10 for Pb and Cd at initial concentration (C0) = 100 ppm while other parameters were kept constant and the predicted values are shown in Figure 5 and 6. The predictions show that higher values of b gives rapid adsorption and vice versa. However, adsorption capacity is a factor determined by the surface properties and functional groups and the adsorption capacity remains same with change of b, the concentration decay constant.
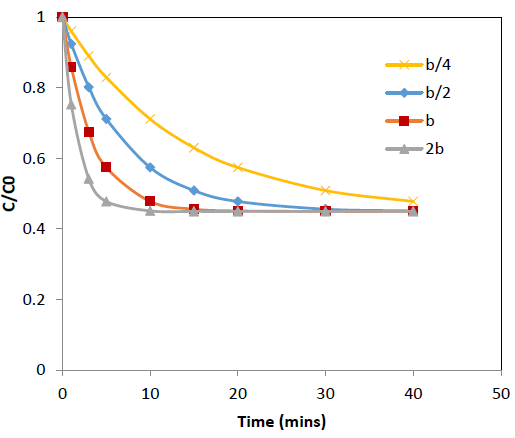
Figure 5: Effect of b, concentration decay constant on variation of C/C0 with time at 25°C for Cd adsorption onto coir pith; C0=r 100 ppm, adsorbent dose =2.5 g/L
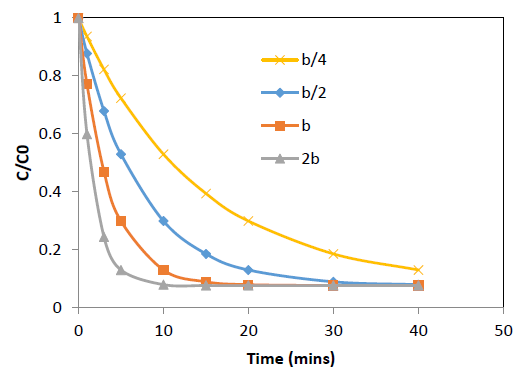
Figure 6: Effect of b, concentration decay constant on variation of C/C0 with time at 25°C for Pb adsorption
onto coir pith; C0=r 100 ppm, adsorbent dose =2.5 g/L
Overall Mass Transfer Coefficient
Overall liquid phase mass transfer coefficient (KL) values were calculated for Pb and Cd adsorption at various initial solution concentrations using equation 4 as follows. Solute concentration, C, as a function of time was obtained from the experiments. Solute uptake onto the adsorbent (q) were calculated from the material balance and the Freundlich isotherm equations were used to obtain the relation between q and C*. Integral on the right hand side of the equation 4 was evaluated using the trapezoidal rule. Overall liquid phase mass transfer coefficients thus calculated are given in Table 2. Nurbas et al. (2002) has obtained values of KL, similar range for Cu adsorption onto Ca-Alginate [14]. The overall liquid phase mass transfer coefficient (KL) values thus obtained can be used to determine the time required for a given degree of adsorption for a given adsorbent dose (w).
Statistical Analysis
Mass transfer parameters determined based on experimental data can be critically analyzed using statistical techniques. External liquid film mass transfer coefficient kL and Overall liquid phase mass transfer coefficient KL values calculated from batch adsorption experiments were analyzed statistically [21,22].
Spearman's correlation coefficient, (ρ) given by equation 16, measures the strength and direction of association between two ranked variables, in this study, initial solution heavy metal concentration, Co, and the mass transfer parameter.

Where di = difference in paired ranks and n = number of cases.
Statistical significance test namely p-test, was performed to find the significance of initial solution concentration, C0, on the mass transfer parameters, kLand KL.
Null Hypothesis; H0; Variation of the parameter value with C0 is not significant. Alternate Hypothesis; Variation of the parameter value with C0 is significant. Results of the Spearman correlation test and the p-test are shown in Table 3.
Table 3: Spearman correlation and p-value for statistical analysis
|
Metal ion |
External liquid film mass transfer coefficient kL (m/s) (Proposed method in this work) |
External liquid film mass transfer coefficient kL (m/s) (using initial period gradient) |
Overall liquid phase mass transfer coefficient KL (m/s) |
|||
|
r |
P value |
r |
P value |
r |
P value |
|
|
Pb |
-1.0 |
0.0 |
-1.0 |
0.0 |
-1.0 |
0.0 |
|
Cd |
-1.0 |
0.0 |
-1.0 |
0.0 |
0.5 |
0.666667 |
Statistical analysis results show that for Pb, Spearman correlation coefficient for both parameters tested is -1.0, which indicates perfect negative association between the C0 and the mass transfer parameter. However, for Cd Spearman correlation coefficient is equal to -1.0 only for external mass transfer coefficient, but Overall liquid phase mass transfer coefficient shows no strong relation between the parameters and the C0. Results of the p-test further confirm the above result; that p value of zero, indicating variation of the parameter value with C0, is significant except for overall liquid phase mass transfer coefficient for Cd adsorption.
Further, the liquid film mass transfer coefficient kL, calculated by the method proposed in this work using the derivative of the C/C0 vs time function at t=0 was compared with the liquid film mass transfer coefficient determined by the gradient of the plot during initial adsorption period. The percentage deviation calculations show 45 to 60% deviation of the parameters calculated by two methods. This analysis further confirms that the use of initial gradient underestimates the kL vaue.
Conclusion
Adsorption of Pb and Cd ions from single ion aqueous solutions onto coir pith was studied. Experimental results show that the adsorption capacity of Pb onto coir pith is higher than that for Cd. Study on the variation of heavy metal ion concentration in the solution with time shows a rapid drop at the initial stages of the adsorption process leading to an exponential decay. New parameter, concentration decay constant, b, was defined to estimate the adsorption rate. Liquid film mass transfer coefficient was determined by a novel accurate method to overcome the inaccuracy due to underestimation of the value obtained using the gradient of the C/C0 vs t plot. Overall liquid phase mass transfer coefficient was determined by the graphical method and the method overcomes the errors due to assumption of linear isotherm equation. Mass transfer coefficients calculated are in the same order of magnitude as the values obtained by other workers for similar materials. The Statistical analysis of the mass transfer coefficients shows that the variation of the parameters with the initial solution concentration is significant for Pb.
References
- Dai Y, Sun Q, Wang W, et al. Utilizations of agricultural waste as adsorbent for the removal of contaminants: A review. Chemosphere 211 (2018): 235-253.
- da Silva Correia IK, Santos PF, Santana CS, et al. Application of coconut shell, banana peel, spent coffee grounds, eucalyptus bark, piassava (Attalea funifera) and water hyacinth (Eichornia crassipes) in the adsorption of Pb2+ and Ni2+ ions in water. Journal of Environmental Chemical Engineering 6 (2018): 2319-2334.
- Bhatnagar A, Vilar VJ, Botelho CM, et al. Coconut-based biosorbents for water treatment—a review of the recent literature. Advances in Colloid and Interface Science 160 (2010): 1-5.
- [Demirbas A. Heavy metal adsorption onto agro-based waste materials: a review. Journal of Hazardous Materials 157 (2008): 220-229.
- Amarasinghe BM, Williams RA. Tea waste as a low cost adsorbent for the removal of Cu and Pb from wastewater. Chemical Engineering Journal 132 (2007): 299-309.
- Bhatnagar A, Sillanpää M, Witek-Krowiak A. Agricultural waste peels as versatile biomass for water purification–A review. Chemical Engineering Journal 270 (2015): 244-271.
- Uzun ?, Güzel F. External mass transfer studies during the adsorptions of some dyestuffs and p-nitrophenol onto chitosan from aqueous solution. Turkish Journal of Chemistry 28 (2004): 731-740.
- Girish CR, Murty VR. Mass transfer studies on adsorption of phenol from wastewater using Lantana camara, forest waste. International Journal of Chemical Engineering 2016 (2016).
- Seader JD, Henley EJ, Roper DK. Separation process principles. New York: Wiley (1998).
- Wankat PC. Separation process engineering. Pearson Education (2006).
- Sa? Y, Aktay Y. Mass transfer and equilibrium studies for the sorption of chromium ions onto chitin. Process Biochemistry 36 (2000): 157-173.
- Yao C, Chen T. A new simplified method for estimating film mass transfer and surface diffusion coefficients from batch adsorption kinetic data. Chemical Engineering Journal 265 (2015): 93-99.
- McKay G, Bino MJ, Altememi A. External mass transfer during the adsorption of various pollutants onto activated carbon. Water Research 20 (1986): 435-442.
- Nurbas M, Kaçar Y, Kutsal T. Determining the overall mass transfer coefficient for adsorption of Cu2+ ions onto Ca-Alginate in fixed bed column. Eur. J. Miner. Process. Environ. Prot 2 (2002): 55-60.
- Treybal RE. Mass transfer operations. New York 466 (1980).
- McCabe WL, Smith JC, Harriott P. Unit operations of chemical engineering. New York: McGraw-hill (1967).
- Kennedy LJ, Vijaya JJ, Kayalvizhi K, et al. Adsorption of phenol from aqueous solutions using mesoporous carbon prepared by two-stage process. Chemical Engineering Journal 132 (2007): 279-287.
- Maria ME, Mansur MB. Mathematical modeling of batch adsorption of manganese onto bone char. Brazilian Journal of Chemical Engineering 33 (2016): 373-382.
- Piccin JS, Guterres M, Salau NP, et al. Mass transfer models for the adsorption of Acid Red 357 and Acid Black 210 by tannery solid wastes. Adsorption Science & Technology 35 (2017): 300-316.
- Ocampo-Perez R, Leyva-Ramos R, Mendoza-Barron J, et al. Adsorption rate of phenol from aqueous solution onto organobentonite: surface diffusion and kinetic models. Journal of Colloid and Interface Science 364 (2011): 195-204.
- Kaushal A, Singh SK. Critical analysis of adsorption data statistically. Applied Water Science 7 (2017): 3191-3196.
- Selim AQ, Sellaoui L, Ahmed SA, et al. Statistical physics-based analysis of the adsorption of Cu2+ and Zn2+ onto synthetic cancrinite in single-compound and binary systems. Journal of Environmental Chemical Engineering 7 (2019): 103217.


 Impact Factor: * 2.8
 Acceptance Rate: 77.30%
  Time to first decision: 10.4 days
  Time from article received to acceptance: 2-3 weeks