Importance of Calibrating Analytical Equipment for Detecting and Quantifying Degradation Byproducts of C4F7N/CO2/O2 Gas Mixtures Insulation Fluid
Muhammad Bilal Arif1,2, Christophe Coquelet1, Maxime Lacuve2*, Frank Jacquier2, Rachel Calvet1
1IMT Mines, Albi, France;
2GE Vernova, Grid Solutions, Villeurbanne, France
*Corresponding Author Maxime Lacuve, GE Vernova, Grid Solutions, Villeurbanne, France
Received: 05 August 2025; Accepted: 12 August 2025; Published: 19 August 2025.
Article Information
Citation: Muhammad Bilal Arif, Christophe Coquelet, Maxime Lacuve, Frank Jacquier, Rachel Calvet. Importance of Calibrating Analytical Equipment for Detecting and Quantifying Degradation Byproducts of C4F7N/CO2/O2 Gas Mixtures Insulation Fluid. Journal of Analytical Techniques and Research 7 (2025): 39-45.
View / Download Pdf Share at FacebookAbstract
In the past few years, the C4F7N/CO2/O2 gaseous blend has been recognized as the best promising alternatives to SF6 gas, allowing to keep the minimum dimensional and environmental footprint of high voltage power transmission equipment’s versus other alternatives. In the event of extreme thermoelectric stress, similar to SF6 the gas mixture undergoes dissociation and produces a diverse range of byproducts in various concentrations. Analytical technologies such as gas chromatography coupled to mass spectrometry (GC-MS) and Fourier Transform Infrared (FTIR) are the key devices that can have the accurate estimation of qualitative and quantitative measurements of byproduct gas samples. Analysis of the arced gas sample reveals a range of byproducts, including CO, CF4, C2F6, C3F8, C2F4, C3F6, COF2, CF3CN, C2F6CN, CF2=CF-CN, (CN)2, CF3-N=CF2, CF(CF3)2-CO-NH2, and (CH3)2SiF2 that can be found as trace-level. However, due to the limited availability of standard gas in the market, only five gases, CF4, C2F6, C3F8, CF3CN, and COF2 were selected as standard for quantification. In our GC-MS method development, achieving complete peak separation was not possible due to the potential matrix effect of the sample. However, the peak area corresponding to the molecular ion of CF4, C2F6, C3F8, CF3CN, and COF2 was carefully determined, and the regression curve was plotted for each molecule individually. In COF2 results, the standard deviation was 69%, which led us to develop the FTIR methodology for COF2 with the classical least squares (CLS) method, in which the standard deviation drops to 4% from 69%.
Keywords
<p>C<sub>4</sub>F<sub>7</sub>N-CO<sub>2</sub>-O<sub>2</sub> gaseous mixture, Gas Chromatography - Mass Spectrometry (GC-MS), byproducts.</p>
Article Details
1. Introduction
Sulfur hexafluoride (SF6) is broadly used as the main insulating and interrupting medium in industrial circuit breakers due to its excellent arc quenching, dielectric, and insulating performance. However, SF6 gas has the global warming potential (GWP) of 24,300 and a 1,000-year atmospheric lifetime, posing significant environmental threats [1]. Identifying a suitable SF6 replacement for higher voltage devices was challenging; however, the insulating C4F7N-CO2-O2 gaseous blend proved as a suitable substitution. It preserved the compact footprint and performance of the SF6 devices while considerably reducing its overall carbon footprint [2]. In the past few years, rigorous research has been conducted on the electric breakdown and thermal aging of the various ranges of composition of the C4F7N/CO2/O2 mixture, and various kinds of byproducts have been revealed by the GC-MS and FTIR technologies. Kieffel et al. [2] detected the CO, COF2, C3F6, CF3CN, and C2F5CN by-products in their thermal stability tests at 800 °C of the C4F_N/CO2 gas mixture. Zhang and his co-workers [3] conducted the AC discharge breakdowns of C4F7N/CO2, and numerous by-products, including CO, CO2, CF4, C2F4, C2F6, C3F8, C4F10, CF3CN, C2F5CN, C2F3CN, C2N2, HCN, and HF, were detected by gas chromatography and mass spectrometry (GC-MS) technology. Substitution of buffer gases such as N2 and air instead of CO2 also causes the production of similar byproducts. Zhao et al. [4] revealed several byproducts, including CF4, C2F6, C3F8, C2F4, C3F6, CO, CO2, C2O3F6, F3CC≡CCF3, CF3CF=CFCF3, (CF3)3CF, CF3CN, C2F5CN, and (CN)2, produced during corona discharge of (CF3)2CFCN/CO2, (CF3)2CFCN/N2, and (CF3)2CFCN/air mixtures. Ye et al. [5] conducted the 200 breaking tests of a gas mixture of 57% C4F7N in air. GC-MS technology reveals the byproducts, including CF4, C2F6, C3F8, CF3CN, C4F10N2, CO2, and (CN)2. Iddrissu et al., [6] performed the tests on a 20% C4F7N:80% CO2 gas mixture using spark gaps under a pressure of 6.2 bar relative and collected a gas sample containing prominent byproducts, including CF4, C2F6, CF2=CF-CF3, CF3CN, and CF2=CF-CN, after 1000 DC breakdowns. Additionally, fluorocarbons, including CF4, C2F6, and C3F8, are common byproducts generated from the electric breakdown of potential insulation gases such as C5F10O [7] and C6F12O [8]. Gas Chromatography, coupled with Mass Spectrometry (GC-MS), is a crucial analytical method employed today to identify the diverse range of chemical species present in the given gas sample. Applications of GC-MS include environmental analysis, explosive investigation, drug evaluation, and the identification of unknown substances. GC utilizes a capillary column whose dimensions (length, internal diameter, and film thickness) and stationary phase depend on the type of molecules that need to be separated based on their chemical structure and boiling point without decomposition. Thermoelectric stress causes the decomposition of the gases into their corresponding byproducts. Thus, it is essential to establish an optimized GC-MS configuration for identifying and quantifying key byproducts produced under thermoelectric stress of gas mixture. Accurately distinguishing and quantifying these molecules is a crucial step toward determining their concentration range, ensuring both operator protection and device reliability. Additionally, FTIR technology is also employed to detect and quantify molecules, which may have chemical interactions with the stationary phase of the GC column (trifluoropropyl methylpolysiloxane).
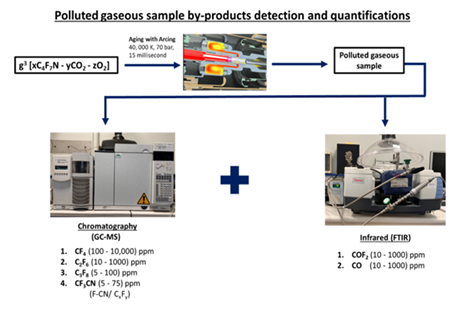
In this study, we developed GC-MS and FTIR methodologies to identify the byproducts that are present in contaminated gas samples retrieving from the thermoelectric stress of those gas mixture, enabling rapid and simultaneous quantification of a variety of the gas species ranging from the level of ppm to percentage.
2. Material and methodology
2.1 Gas Chromatography – Mass Spectrometry (GC-MS) methodology
A quadrupole GC-MS Agilent Technologies 7890 A with triple-axis detector equipped with the Restek Rtx-200 GC column (length 105 m, inner diameter 0.25 mm, film thickness 1.00 µm) is utilized for the detection and calibration of gaseous mixtures, modified to minimize external contamination during measurements. The selected GC column with a trifluoropropyl methylpolysiloxane stationary phase enables discriminatory interactions with nitro, halogen, and carbonyl groups. Ultra-high-purity helium (99.9999 vol% by gas chromatography) was run in the device as the carrier gas, with a constant flow rate of 5 mL/min during sampling. For sample injection, a consistent flow rate of 1 mL/min was maintained using a flowmeter to ensure precise measurement. A dose of N2 gas at 10 mL/min was run through the system for the duration of 10 minutes to purge the GC instrument before passing each sample. Two temperature ramps were set at a constant rate of 15 °C/min, reaching 100 °C and 180 °C, over a duration of 15.2 min and 22.1 min, respectively (Table 1). Scan mode with the range of 15 to 600 (2.51 scan s-1) is used in mass spectrometers with electron ionization (70 eV). Certified standards of CF4 (100, 1000, 10,000) ppm, C2F6 (10, 100, 1000) ppm, C3F8 (5, 50, 100) ppm, COF2 (10, 100, 1000) ppm, and CF3CN (5, 25, and 75) ppm with CO2 buffer gas were used to construct the regression curve for each gas individually. These three standards were supplied by ABCR GmbH & Co KG. Additionally, the selective ion was m/z 69 for CF4; m/z 119 for C2F6; m/z 169 for C3F8; m/z 76 for CF3CN; and m/z 47 and 66 for COF2. The total duration of 22 minutes gives sufficient period for the peak detection and separation of the compound. The peak areas on the chromatogram were used to establish the regression curve against known concentrations of CF4, C2F6, C3F8, CF3CN, and COF2 gas mixtures.
Table 1: GC-MS Methodology Parameters
|
# |
GC Parameters |
Setting |
|
1 |
Temperature ramp rate 1 |
32 °C for 7 min (isotherm) |
|
2 |
Temperature ramp rate 2 |
15 °C/min up to 100 °C hold time 3.75; Run time = 15.283 min |
|
3 |
Temperature ramp rate 3 |
15 °C/min up to 180 °C hold for 1.5 min; total run time = 22.117 min |
|
4 |
Split ratio |
50:1 |
|
5 |
Injector inlet temperature |
150 |
|
6 |
Interface temperature |
250 |
|
7 |
Septum purge flow (mL/min) |
3 |
|
8 |
Injection flow rate (mL/min) |
|
|
9 |
Make up flow He (mL/min) |
5 |
|
10 |
Carrier gas |
He |
2.2 Fourier Transform InfraRed (FTIR) methodology
Since, in the case of FTIR technology [10], only a defined volume cell filled with the gas sample is utilized to obtain the measurements. FTIR (Nicolet iS50 FTIR 2-meter gas cell) was employed to obtain an infrared spectrum of standard gas containing (10, 100, and 1000) ppm of COF2, and the methodology to calibrate the COF2 is present in Table 2. The window material is made from potassium bromide (KBr), with a light transmission band of 400-4000 cm-1, which satisfies the experimental requirements.
Table 2: FTIR methodology
|
# |
Parameters |
Setting |
|
1 |
Wavenumber range (cm-1) |
500 - 4000 |
|
2 |
Gas pressure (mbar) |
1000 |
|
3 |
Operating Temperature (°C) |
40 |
|
4 |
Number of scans |
16 |
|
5 |
Resolution |
0.5 |
|
6 |
Detector |
DTGS (KBr)* |
*Deuterated Triglycine Sulfate (DTGS) detector
3. Results and discussion
3.1 Qualitative analysis
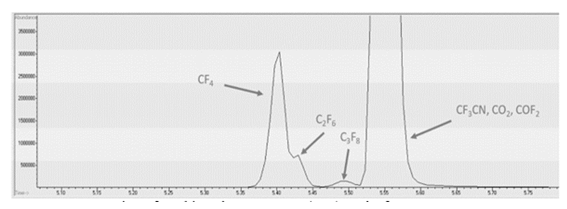
Figure 2 represents the total ion chromatogram (TIC) peak of all the chemical species CF4, C2F6, C3F8, CF3CN, COF2, and CO2 presented in a highly concentrated standard gas bottle, which can be identified with their unique m/z of fragments or molecular peaks. CF4, C2F6, and C3F8 are separated with the current methodology; however, CF3CN, CO2, and COF2 could not be distinguished. Normally, lowering the flow rate and sample dilution gives better separation of the peaks and avoids their overlapping; however, in our case, it was not possible to achieve a complete separation of all the peaks due to the matrix effect of all fluorocarbons. Since CO2 is the background gas in the standard gas mixture, it is likely that fluorocarbon molecules such as CF3CN and COF2 co-migrate with the abundant CO2 molecule in the capillary column and subsequently flow into the ionization chamber. This phenomenon causes the suppression of CF3CN and COF2 ions and makes the transfer difficult towards the detector [11]. In such an instance, we make sure the mass spectrum of each peak corresponds to the molecule (more information in supplementary data), and the optimum separation was observed at 3 mL/min flow rate (Table 1).
3.2 Quantitative analysis
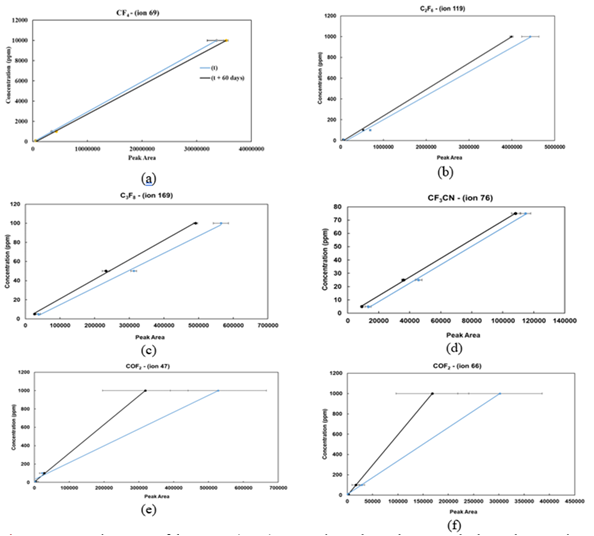
Figures (3a, 3b, 3c, 3d, 3e, and 3f) represent the standard linear curves (regression curve) obtained at 60-days’ time intervals for all the molecules in the standard gas sample. The linear equation is given by Equation 1, where Savg denote the average peak area of a specific ion, c represents the concentration, a represents the slope (response factor, Rf), and b represent the intercept value.

Apparently, CF4, C2F6, C3F8, and CF3CN curves are slightly moved toward y-axis after two months and can be attributed to the GC column aging. Since, the presence of the gases, such as CO2 and HF, induces chemical reaction with column’s stationary phase, trifluoropyl methylpolysiloxane, leading to the formation of corresponding byproducts such as (CH3)2SiF2. While, in the case of COF2, the peak area value taken from the consecutive measurements was not consistent, and a larger spread was observed for all the concentration ranges from lower to higher concentrations (Figures 3e and 3f). Indicating the instability and reactive behavior of COF2 molecules in each measurement, that makes it difficult to quantify by a GC-MS instrument.
Furthermore, Table 3 summarizes the response factor (Rf), regression value, and the standard deviations corresponding to the graphs shown in Figure 3. Typically, the linear regression curve is obtained by plotting the known concentration against the peak area under the curve, derived from multiple measurements. Furthermore, fluorocarbons (CnF2n+2, and CnF2n) have similar values; therefore, they can also be considered to determine the concentration of other fluorocarbons and cyano groups. On average, the standard deviation is calculated by using Equation 2 and for all molecules, it is approximately 4%, except for COF2, which is 69% due to the wide dispersion of the peak area in the consecutive measurements (Figure 3e, 3f).

Table 3: Response factor (slop of the linear curve) and the standard deviation of all the calibrated gases over a 60-day period
|
Molecules |
Molecular ion |
(Rf) response factor, (a, equation 1) ×104) |
Regression (R2) |
(Rf) response factor, after 60 days (a, equation 1) ×104 |
Regression (R2) |
Standard deviation (STDEV %) |
|
CF4 |
CF3+ (69) |
2.9 |
0.9999 |
3 |
0.9999 |
2 |
|
C2F6 |
C2F5+ (119) |
3 |
0.9963 |
3 |
0.9998 |
3 |
|
C3F8 |
C3F7+ (169) |
2 |
0.9968 |
3 |
0.998 |
4 |
|
CF3CN |
CF2CN+ (76) |
7 |
0.9986 |
7 |
0.9997 |
4 |
|
COF2 |
COF+ (47) |
1.8 |
0.9976 |
1.8 |
0.9976 |
69 |
|
COF2+ (66) |
3.1 |
0.9999 |
6 |
0.9999 |

Equation 3 illustrates the uncertainty formula used to calculate the uncertainty of the concentration of all byproducts [12]. Where, std(S) is the standard deviation of average area value; u(a) represents the uncertainty in the slope a; u(b) represents the uncertainty in the intercept b and aavg represent the average value of peak area. The significance of the uncertainty values of the byproducts in calibration accounting for errors from instrument variability, environmental factors, and sample inconsistencies. They ensure accuracy, regulatory compliance, and confidence in the quantitative results of polluted C4F7N/CO2/O2 gas mixture samples in the industrial settings.
Table 4: Uncertainty values for standard gas molecules at various concentration
|
Gas molecules |
Concentration (ppm) |
Uncertainty u(c) (ppm) |
|
CF4 |
1000 |
4 |
|
10000 |
41 |
|
|
100000 |
120 |
|
|
C2F6 |
10 |
2 |
|
100 |
6 |
|
|
1000 |
11 |
|
|
C3F8 |
5 |
1 |
|
50 |
2.7 |
|
|
100 |
2.7 |
|
|
CF3CN |
5 |
0.6 |
|
25 |
0.9 |
|
|
75 |
2 |
|
|
COF2 (ion 47) |
10 |
8.2 |
|
100 |
17 |
|
|
1000 |
26 |
|
|
COF2 (ion 66) |
10 |
6.5 |
|
100 |
16 |
|
|
1000 |
250 |
3.3 COF2 quantification using FTIR
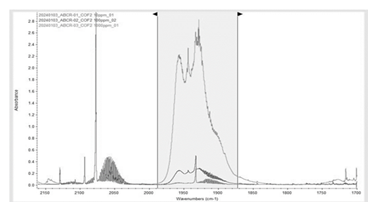
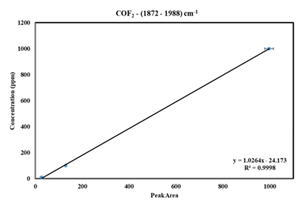
The higher standard deviation and uncertainty of COF2 prompted us to develop its methodology by FTIR. A constant pressure of 1000 mbar gas was filled in the gas cell, maintained by the Bronkhorst high-tech control valve, and simultaneously obtained four consecutive measurements (Figure 4). Existing literature [14], indicate the range of COF2 peaks lies between (~1800 - 2000 cm-1). Accordingly, selected the range between 1872.98 and 1988.52 cm-1 to calibrate the COF2 (10, 100, and 1000 ppm) with the classical least squares (CLS) methodology (Figure 4). The regression curve is generated using TQ software (Figure 5).
The COF2 concentration values obtained from FTIR measurements are less dispersed and more accurate (Table 4). Therefore, based on these measurements, the quantitative results of the standard gas bottles confirm the COF2 measurement via FTIR technology is more effective than GC-MS, where the standard deviation is 69% (Table 3).
Moreover, in a heavily polluted C4F7N/CO2/O2 gas mixture sample, the high COF2 concentration caused peak saturation in the infrared spectrum; therefore, dilution with decreasing the pressure below 1000 mbar must be adjusted before taking the right concentration value in a sample.
Table 5: Comparison of COF2 standard sample measurements results using GC-MS and FTIR instruments
|
# |
Measurement results by GC-MS (ppm) |
Measurement results via FTIR (ppm) |
|||
|
COF2 (ppm) |
GC-MS (ion - 47) |
GC-MS (ion - 66) |
Standard deviation (%) |
FTIR (after 4 months) |
|
|
Bottle 1 |
10 |
54 |
32 |
69 |
4.3 ± 0.5 |
|
Bottle 2 |
100 |
96 |
88 |
98 ± 3 |
|
|
Bottle 3 |
1000 |
514 |
513 |
937 ± 25 |
|
Furthermore, due to the limitation of the experimental study, the density functional theory (DFT) [15], must be employed to develop the model and to compare the analytical results with the established possible chemical reaction mechanism.
Conclusion
Detection and quantification of polluted decomposition byproducts with the help of GC-MS and FTIR technology is crucial to increase knowledge on the byproduct identification and quantification. In this regards, optimum GC-MS methodology is established, and calibration of gases including CF4, C2F6, C3F8, COF2, and CF3CN is performed. Complete peak separation with adjusting parameters was not possible in our case due to the matrix effect, and an injection flow rate of 3 mL/min was found to be optimal for partial peak separation. Slight movement of the regression curve of all molecules is observed, indicating the degradation of the column stationary phase. COF2 calibration via GC-MS is not achievable due to the significant variation of the peak area values in the consecutive measurements and attributed to the corrosive nature of COF2, as it can react easily with the columns stationary phase. COF2 calibration by FTIR is reliable in our case, and the standard deviation of COF2 from FTIR calibration was around 4%; that was 69% in the case of GC-MS. A total of 15 byproducts are detected by GC-MS in the polluted sample, including CO, CF4, C2F6, C3F8, C2F4, C3F6, COF2, CF3CN, C2F5CN, CF2=CF-CN, (CN)2, CF3-N=CF2, CF(CF3)2-CO-NH2, and (CH3)2SiF2. The byproducts generation during arcing coming from gas mixture decomposition of course but the ablation phenomena of PTFE nozzle induces at the same time the generation of fluorocarbon byproducts. Understanding the chemical composition of the gas mixture is essential and has been used to define and implement appropriate environmental and health safety procedures.
Acknowledgment
This work was financially supported by French organization (Conventions Industrielles de Formation par la Recherche) (CIFRE) and GE Vernova, Grid Solutions. Access to the bibliographic data, analytical tools, for research were provided by IMT Mines, Albi, France and GE Vernova, Grid Solutions, France.
Reference
- F-gas Regulation, 2024/573 edition of the European Parliament and of the Council on fuorinated greenhouse gases (2024).
- Kieffel et al. Characteristics of - An alternative to SF6, in CIRED - Open Access Proceedings Journal (2017): 54-57.
- Zhang, C. Li, J. Xiong, et al. Decomposition characteristics of C4F7N/CO2 mixture under AC discharge breakdown, AIP 9 (2019).
- Zhao, D. Han, Z. Zhou, et al. Experimental and theoretical analysis on decomposition and by-product formation process of (CF3)2CFCN mixture,” AIP Adv 9 (2019).
- Ye et al. Arc decomposition behaviour of C4F7N/Air gas mixture and biosafety evaluation of its by-products, High Volt (2022).
- Iddrissu, Y. Kieffel, Q. Han, et al. Gas decomposition and electrode degradation characteristics of a 20% C3F7CN and 80% CO2 gas mixture for high voltage accelerators, High Volt 05 (2021): 750-759.
- Zhang, Y. Li, S. Xiao, et al. Decomposition Mechanism of C5F10O: An Environmentally Friendly Insulation Medium, Environ. Sci. Technol 51 (2017): 10127-10136.
- Zhang, S. Tian, S. Xiao, et al. Insulation strength and decomposition characteristics of a C6F12O and N2 gas mixture, Energies 10 (2017).
- Bajraktarova-Valjakova et al. Hydrofluoric acid: Burns and systemic toxicity, protective measures, immediate and hospital medical treatment, Open Access Maced. J. Med. Sci 6 (2018): 2257-2269.
- Wang, D. Ding, Y. Zhang, et al. Research on infrared spectrum characteristics and detection technology of environmental-friendly insulating medium C5F10O, Vib. Spectrosc 118 (2022).
- Isobe, K. Koba, S. Ueda, et al. A simple and rapid GC/MS method for the simultaneous determination of gaseous metabolites,” J. Microbiol. Methods 84 (2011): 46-51.
- Taylor, Barry N and C. E. Kuyatt. NIST Technical Note 1297 Guidelines for Evaluating and Expressing the Uncertainty of NIST Measurement Results, Technology (1994).
- Wang et al. Theoretical Analysis of the Decomposition Pathways and Species of Environmentally Friendly Insulation Gas C6F12O Based on the DFT and TST, Plasma Chem. Plasma Process 41 (2021): 133-153.
- H. J. O. Lee and J. Y. L. W. S. Kang. Effects of Pressure and Electrode Length on the Abatement of N2 O and CF4 in a Low-Pressure Plasma Reactor, Plasma Chem. Plasma Process (2016).
- B. Arif, C Coquelet, C Adamo, et al. Abstract_The 26th Edition of Netherlands’ Catalysis and Chemistry Conference (N3C) conference (2025).


 Impact Factor: * 2.8
 Acceptance Rate: 77.30%
  Time to first decision: 10.4 days
  Time from article received to acceptance: 2-3 weeks