Cellular Uptake and Localization of Hematoporphyrin Derivatives in Lung Adenocarcinoma A549, Squamous Carcinoma H520 and Small Cell Carcinoma H446 Cell Lines
Yijiang Ma1, Xiaoqian Ding1, Aihua Sui2, Xiaohui Yang1, Shichao Cui1, Yiwei Cao1 and Cunzhi Lin*1
1Department of Respiratory and Critical Care Medicine, The Affiliated Hospital of Qingdao University, Qingdao 266000, China
2Medical Research Center, The Affiliated Hospital of Qingdao University, Qingdao 266000, China
*Corresponding Author: Cunzhi Lin, Department of Respiratory and Critical Care Medicine, The Affiliated Hospital of Qingdao University, Qingdao 266000, China
Received: 16 December 2022; Accepted: 05 January 2023; Published: 09 January 2023
Article Information
Citation:
Yijiang Ma, Xiaoqian Ding, Aihua Sui, Xiaohui Yang, Shichao Cui, Yiwei Cao and Cunzhi Lin. Cellular Uptake and Localization of Hematoporphyrin Derivatives in Lung Adenocarcinoma A549, Squamous Carcinoma H520 and Small Cell Carcinoma H446 Cell Lines. Archives of Internal Medicine Research 6 (2023): 01-09.
View / Download Pdf Share at FacebookAbstract
To select bronchial epithelial BEAS-2B cell line as control, cellular uptake and localization of Hematoporphyrin derivatives (HPD) were compared between normal bronchial epithelial cells (BEAS-2B), various lung cancer cell lines, as well as between lung cancer cell lines. Cellular uptake of HPD was quantified by fluorescence intensity with a multifunctional microplate reader and flow cytometry. Laser scanning confocal microscopy was used to observe and compare the cellular distribution of HPD. In a certain concentration range, HPD concentration was positively correlated with fluorescence intensity. Cellular uptake of HPD increased over time in four cell lines. The average fluorescence intensity in the four cells was significantly different (P<0.0001). The four cell lines showed red fluorescent signals of varying intensities, and all were distributed in the cytoplasm. In vitro experiments show that there are differences in HPD uptake between four cell lines: the ability to take HPD in A549 cells is the strongest, followed by BEAS-2B cells and H446 cells, and the uptake ability of HPD in H520 cells is the weakest. The photosensitizer HPD is located in the cytoplasm of both cell lines, showing a punctate distribution.
Keywords
Photosensitizer; Hematoporphyrin derivative; Cellular uptake; Intracellular localization; Lung cancer
Photosensitizer articles; Hematoporphyrin derivative articles; Cellular uptake articles; Intracellular localization articles; Lung cancer articles
Article Details
Introduction
Cancer is a multifactorial disease characterized by unbounded cell growth leading to the formation of malignant tumors [1]. Cancer incidence and mortality in China have been on the rise. It is estimated that new cancer cases were increased 4.3 million and cancer deaths were increased 2.9 million in China in 2018, of which lung cancer is the most common cancer event and the dominant reason for cancer death [2-4]. Currently, clinical treatments for lung cancer include surgery, radiotherapy, chemotherapy, and, more recently, immunotherapy and other small-molecule targeted therapies, as well as combinations of these strategies. However, these treatments have some important drawbacks [5]. Photodynamic therapy (PDT) is a promising and non-invasive cancer treatment modality, which has developed significantly in recent decades and is widely used in the treatment of lung cancer. PDT consists of three basic components, namely light, oxygen and photosensitizer (PS), which induce focal cell death without systemic adverse reactions [6-8].
Hematoporphyrin derivative (HPD) was obtained by purification and chemical modification of hematoporphyrin (HP) used as PS the first porphyrin. Subsequently, the porphyrin dimer and oligomer separated from HPD were mixed and marketed for the trade name "Photofrin". Despite the disadvantages of low chemical purity, poor tissue penetration, and long half-life, Photofrin® is still the most commonly used and the only PS approved by the FDA for clinical treatment of various solid malignant tumors[9, 10]. Cellular uptake and intracellular distribution of PS are crucial factors in determining the efficacy of PDT, while those are affected by physicochemical properties of PS, such as charge distribution, lipophilicity and aggregation state, and factors of the cell itself, such as the cell type and its physiological state and microenvironment [11]. Solid tumors are composed of a variety of cells with different PS uptake properties. Therefore, pharmacokinetics at the cellular level is a vital parameter for optimizing the effect of PDT [12]. In this experiment, human bronchial epithelial BEAS-2B cells were used as control, and three different lung cancer cell lines were selected, such as human lung adenocarcinoma A549, human lung squamous carcinoma H520, and human lung small cell carcinoma H446 cells. In vitro, the intracellular fluorescence intensity was detected by a multifunction microplate reader, flow cytometry, laser scanning confocal microscope and other methods, and the uptake and localization differences of the photosensitizer HPD in normal human bronchial epithelial cells and lung cancer cells were compared and analyzed, and the differences among lung cancer cell lines. There are similarities and differences in the biological characteristics of different cancer cell lines. By analyzing the differences in HPD uptake of different cancer cell lines, it is convenient to select a specific regimen (specific photosensitizer injection concentration and time) for different lung cancer types to enhance the efficacy of HPD-mediated PDT, to provide the guidance for the clinical treatment of lung cancer.
Materials and Methods
Materials
Hematoporphyrin Derivative (HPD), was manufactured by Chongqing Milelonge Pharma, specification 5ml: 25mg. The HPD was sub-packaged on an ultra-clean workbench and kept at -20°C in the dark. It was prepared with a DMEM high-glucose complete medium containing 10% Fetal Bovine Serum,100 U/mL penicillin G and 100 µg/mL streptomycin mixture for immediate use. DMEM high-glucose medium, 0.25%Trypsin-Ethylenediaminetetraacetic acid (EDTA), Penicillin/Streptomycin mixture, and 4% paraformaldehyde fixative were purchased from Dalian Meilunbio Company; Fetal Bovine Serum (FBS) was provided by Wuhan Procell Company; Anti-fade mounting medium and 4,6-diamidino-2-phenylindole (DAPI) were obtained from Beijing Solarbio Company.
Cell culture
Human lung adenocarcinoma A549 cell line was purchased from the American Culture Collection (ATCC, USA) and stored in a liquid nitrogen tank in the central laboratory of the Affiliated Hospital of Qingdao University; the other three cell lines BEAS-2B (human bronchial epithelial cell), NCI-H520 (human lung squamous carcinoma) and NCI-H446 (human lung small cell carcinoma) were purchased from Wuhan Procell Company and stored in a liquid nitrogen tank in the central laboratory of the Affiliated Hospital of Qingdao University. The four cell lines were cultured in a DMEM complete medium supplemented with 10%FBS in a 5%CO2 saturated humidity incubator at 37°C. Cells were routinely subcultured and taken into logarithmic growth phase cells for experiments.
Standard curve of HPD
The HPD concentrations of 5, 7.5, 10, 12.5, and 15μg/ml were added to a 96-well microplate, and each concentration has duplicate wells. The HPD was examined by fluorescence measurement using the multifunction microplate reader (excitation wavelength is 405nm, emission wavelength is 630nm). The standard curve was drawn by average value starting from the low concentration.
Detection of cellular uptake of HPD by multifunction microplate reader
The four cell lines (BEAS-2B, A549, H520, H446) were seeded in 5 pieces of the 96-plate microplate (5×10³ cells per well), and each group was set with 4 duplicate wells. After culturing for 12h, the experimental groups added 5μg/ml HPD for various time intervals from 4h up to 48h in the dark. The intracellular retention of HPD was analyzed by fluorescence measurement using the multifunction microplate reader (excitation wavelength is 405nm, emission wavelength is 630nm).
Detection of cellular uptake of HPD by flow cytometry
Cells (BEAS-2B, A549, H520, H446) were cultured in a 12-well plate at a density of 1x10⁵ cells per well. After 12h, cells were added 5μg/ml HPD cultured for 24h and 48h in the dark, after which unbound HPD was discarded and washed twice with PBS. Then, cells were digested with trypsin, resuspended with 400μl PBS, filtered and examined by flow cytometry.
Confocal Laser Scanning Microscopy (CLSM) Imaging
The coverslips were soaked in 75% ethanol, rinsed with the culture medium, and then placed in a 24-well plate. BEAS-2B, A549, H520 and H446 cells were seeded at a density of 104 cells per well and were randomly divided into control and experimental groups 12 hours later. After the experimental groups were added for 15μg/ml HPD 48h-incubation, redundant HPD was discarded and washed twice with PBS. Then, cells were fixed with 4% paraformaldehyde for 20 min at room temperature and washed twice. Next, cells were stained with DAPI (10μg/ml) for 8 min in the dark, then the dye was whole removed and washed off PBS. Finally, stained coverslips were placed on a glass slide dripped antifade mounting medium, and then observed and photographed by CLSM.
Statistical analysis
All experimental data in the study were analyzed using the SPSS 26.0 statistical software and GraphPad Prism 8.0.1 Software. Measurement data were presented as mean ± standard deviation (SD) from at least three independent experiments. Under the condition of testing the homogeneity of data variance, analysis between multiple groups was performed by one-way analysis of variance (ANOVA) and Tukey’s post-hoc test. A P-value<0.05 indicated that was statistically significant.
Results
Standard curve of HPD
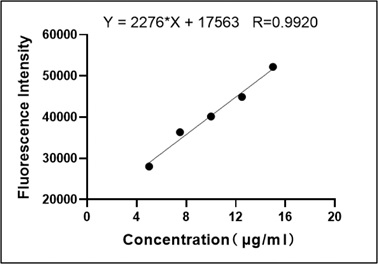
Fluorescence values of HPD measured by multifunction microplate reader at different concentrations of 5, 7.5, 10, 12.5, 15μg/ml were drawn the standard curve as shown in Figure 1, and performed correlation regression analysis, regression equation Y=2276*X+17563, correlation coefficient r=0.9920, P=0.0009. The results showed that within a certain concentration range, the concentration of HPD was positively correlated with the fluorescence intensity, and the fluorescence intensity of HPD could be used to represent the HPD content.
Time-dependent cellular uptake of HPD
The time-dependent cellular uptake of 5μg/mL HPD in BEAS-2B, A549, H520, and H446 cells is shown in Figure 2. The HPD time-dependent accumulation of the four cell lines showed an overall upward trend, indicating that the cellular uptake of HPD increased with time. In BEAS-2B (Figure 2a), A549 (Figure 2b), and H446 (Figure 2d) cells, the uptake of HPD had no significant increase at 4, 8, and 12 h (P>0.05), and accumulated rapidly after 12 h, while the absorption was a certain delay in H520 (Figure 2c) cells, and the acceleration of the uptake rate is only shown after 24 hours.
Comparison of cellular uptake of HPD in BEAS-2B, A549, H520 and H446 cells
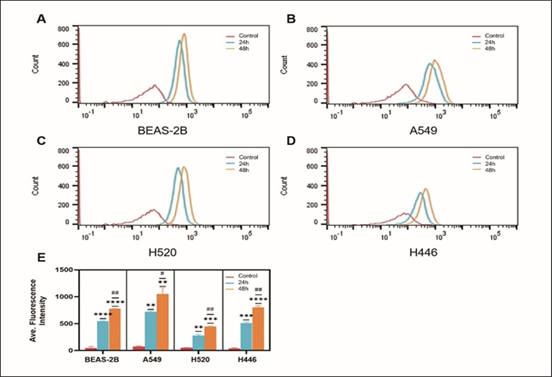
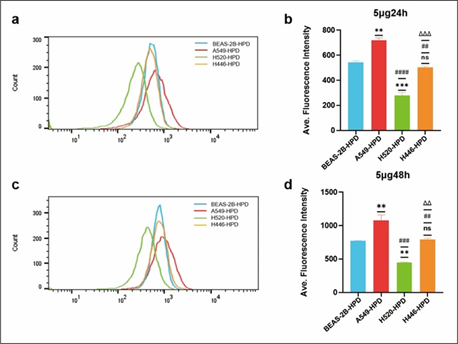
After cells were incubated with 5μg/mL HPD for 24h and 48h, cellular HPD was detected by fluorescence measurement using flow cytometry, to exclude the effect of differences in cell proliferation and further quantify cellular uptake of HPD. As shown in Figure 3, BEAS-2B (a), A549 (b), H520 (c), and H446 (d) cells showed strong fluorescence signals at 24h and 48h, indicating that HPD was efficiently accumulated in cells and the accumulation at 48h was higher than 24h (e), P<0.05, there was a significant statistical difference. Therefore, with the prolongation of incubation time, the uptake of HPD by cells increased, and the four cell lines did not reach uptake saturation at 48h. Further analysis compared the uptake differences between the four cell lines, as shown in Figure 4. After 24 h incubation, the average fluorescence intensities of BEAS-2B, A549, H520, and H446 cells were 542.0 ± 14.14, 718.5 ± 19.09, 277 ± 24.75, and 502 ± 12.02, respectively, which were statistically different (F=199.0, P<0.0001), and the mean intracellular fluorescence intensities were higher in A549 cells than in H446 (P=0.0010), BEAS-2B (P=0.0022), and H520 cells (P<0.0001), which were statistically different. In contrast, the mean intracellular fluorescence intensity was not statistically different between H446 and BEAS-2B cells (P=0.2724>0.05), and both were higher than H520 (H446 vs. H520, P=0.0009; BEAS-2B vs. H520, P=0.0005). 48 h, the mean intracellular fluorescence intensity of BEAS-2B, A549, H520, and H446 cells fluorescence intensity were 772.0±5.66, 1077±83.44, 446.5±9.19 and 791.0±19.80, respectively, which were statistically different (F=71.15, P=0.0006<0.0001), and the results of two-comparison analysis were the same as 24h. Based on the above data, the strongest uptake of HPD was observed for A549 cells, followed by H446 cells, and the weakest for H520 cells.
Figure 3: Cellular uptake of HPD. BEAS-2B (a), A549 (b), H520 (c), and H446 (d) cells were incubated with HPD for 24h and 48h, respectively, and cellular uptake efficiency were detected by fluorescence intensity using flow cytometry; statistical analysis of the differences in the uptake of four types of cells at 24h and 48h (e). *, #: P<0.05; **, ##: P<0.01; ***, ###: P<0.001; ****, ####: P<0.0001. *: control group vs. 24h group; #: 24h group vs. 48h group.
Figure 4: Comparison of cellular uptake of HPD in four cell lines. Differences in cellular uptake were analyzed by flow cytometry in BEAS-2B, A549, H520 and H446 cells co-incubated with HPD for 24h (a, b) and 48h (c, d). *, #, Δ: P<0.05; **, ##, Δ Δ: P<0.01; ***, ###, Δ Δ Δ: P<0.001; ****, ####, Δ Δ Δ Δ: P<0.0001. *, ns: vs. BEAS-2B-HPD; #: vs. A549-HPD; Δ: vs. H520-HPD.
CLSM imaging and intracellular localization
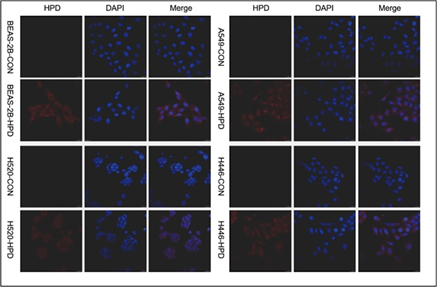
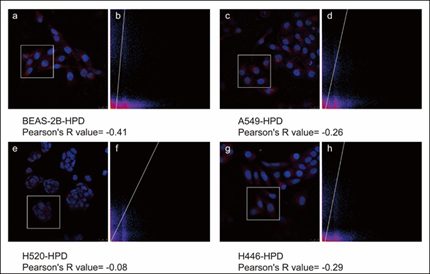
After co-incubating four cell lines with 15μg/mL HPD for 48h, we utilized confocal laser scanning microscopy (CLSM) to observe the intracellular localization of HPD applying intrinsic fluorescence of HPD and nuclei-specific probes. Images are shown in Figure 5, in which the fluorescence signals of the HPD are shown in red and blue fluorescence signals from DAPI are used to visualize nuclei. Obviously, the red fluorescent signals of varying intensities were discovered in the four cell lines treated with HPD, and all of them were distributed in the cytoplasm in a punctate manner, but red fluorescence signals were hardly observed in the control group. Besides, we also perceived that the intracellular fluorescence from HPD emerges several distinct red emission pixels and hardly overlaps with blue fluorescence registered for nuclei in four cell lines. We further performed the colocalization analysis for DAPI (blue) and HPD (red) in experimental group with Pearson's correlation coefficient (R) expressing the intensity correlation of colocalizing objects in each component of a dual-color image. The result (Figure 6) for BEAS-2B-HPD, A549-HPD, H520-HPD and H446-HPD, respectively, are -0.41, -0.26, -0.08 and -0.29, which suggest no correlation. Consequently, we confirmed that the uptake of HPD in the four cell lines was localized in the cytoplasm, and no significant difference was observed in the distribution.
Figure 6: Pearson's correlation coefficient (R) of BEAS-2B, A549, H520, and H446 cells. a, c, e, and g are the images of BEAS-2B, A549, H520, and H446 cells after co-stained with HPD and DAPI, respectively. The white boxes in the figures represent the Region of Interest (ROI), and figures b, d, and f, represent the co-localized scatter plots of the corresponding ROI after ImageJ analysis.
Discussion
Photodynamic therapy (PDT) is a photosensitizer (PS) that transfers the energy of absorbed photons to oxygen molecules under the irradiation of light wavelengths consistent with the PS absorption spectrum to generate cytotoxic reactive oxygen species (ROS) such as superoxide anion and singlet oxygen, resulting in oxidative stress further destroys tumor cells. The lifetime of singlet oxygen is extremely short (10-320ns), and the diffusion range in cells is only 10-55nm, so the effect of photodynamic therapy depends to some extent on the intracellular distribution and localization of the PS used [10, 13, 14]. Cellular uptake, intracellular distribution and retention of photosensitizers depend on PS chemistry, PS concentration, incubation time and cellular properties, including cell volume, proliferation status, the affinity of intracellular target sites for photosensitizer binding, cell type, etc. [11, 15].
A particular cell type has its ratio of photosensitizer uptake and clearance. As early as 1990, Perry et al. demonstrated that the cellular uptake of PhotofrinII differs among different cell lines [16]. Subsequently, in the experiments of Fickweiler et al., the cellular uptake of another photosensitizer-ATMPn was shown to be different between skin cell lines [17]. In 2003, Chwilkowska et al. revealed that Photofrin II differs in cellular uptake between [18]. In this study, the clinically used photosensitizer HPD (Hipofen®) was selected to investigate the differences in the uptake of HPD by lung cancer cells of different histological types. The results of the multifunctional microplate reader showed that HPD accumulated rapidly in BEAS-2B, A549 and H446 cells incubated with HPD at 5µg/ml concentration for 12h, while the rate of HPD uptake by H520 cells was slow and uptake accelerated after 24h (Figure 2). Since the multifunction microplate reader detects the total fluorescence intensity of cells, flow cytometry was applied to further quantify the intracellular average fluorescence intensity at 24 and 48 h (Figure 3). The results showed that the cellular uptake efficiency of HPD by the four cell lines was different with the increase of time, and it was further confirmed that different cell types had different uptake of photosensitizers.
In this experiment, after cells were incubated with HPD for 48 hours, the average fluorescence intensity in lung adenocarcinoma A549 cells even reached 2 times that of lung squamous carcinoma H520 cells, and the intracellular fluorescence intensity in lung small cell carcinoma H446 cells were also much higher than that in lung squamous carcinoma H520 cells, demonstrating differences in HPD uptake between different types of lung cancer cells (Figure 4). But in 1990, Perry et al. showed that the photosensitizer concentration in lung squamous carcinoma H520 cells was higher than that in lung adenocarcinoma A549 cells after 2h incubation with photosensitizer [16]. Then for the same cell line type, the proliferation state of the cells may affect the uptake of the photosensitizer with the prolongation of the incubation time. In addition, it may also be since HPD is more localized to mitochondria in the early stage of HPD incubation, and then shows time-dependent uptake in lysosomes [19]. This also explains the phenomenon that the fluorescence intensity of HPD in the four kinds of cells co-incubated with HPD for 4h, 8h, 12h, 24h, and 48h increases with time (Figure 2).
In addition, one of the properties of photosensitizers is to selectively target tumor tissues [20], and studies have found that the uptake of HPD in tumor cells is even 5 times higher than that in normal cells in the corresponding tissues [21]. However, this study showed that the HPD in normal bronchial epithelial BEAS-2B cells was higher than that in lung squamous carcinoma H520, and there was no statistical difference compared with lung small cell carcinoma H446. Although the intracellular HPD of lung adenocarcinoma A549 cells was higher than that of normal bronchial epithelial BEAS-2B cells, it was much more than 5-fold (Figure 4). In 1990, Perry et al. also showed that the concentration of photosensitizer in normal lung fibroblasts CCL-210 cells were higher than that in lung cancer cells [16]. This may be due to differences in experimental conditions in vivo and in vitro, and in vivo, various factors may contribute to the high selectivity of HPD for tumor tissue. Possible factors include: tumor-associated macrophages (TAM) in tumor tissue higher than normal tissue [22]; relative permeability and diffusion of tumor capillaries compared with normal tissue [23]; the presence of enhanced permeability and retention effect (EPR) in tumor tissue [24]. Studies have also shown the accumulation of photosensitizers in individual tumor cells [25].
The intracellular localization of PS is important to determine the target of PS, which may determine the site and extent of photodynamic damage produced by PDT, and determine the pathway and type of cell death [26, 27]. Porphyrins are accumulated in cells mainly through passive diffusion, binding to lipoproteins, and peripheral benzodiazepine receptors and localized in mitochondria, lysosomes, endoplasmic reticulum, Golgi apparatus, nuclear membrane and other cell membrane structures [28-30]. The intracellular localization of HPD in the four cell lines was perceived under a laser scanning confocal microscope, and the results presented that the photosensitizer HPD was diffusely distributed in the cytoplasm (Figure 5) Whether there are differences in subcellular localization requires further study.
In this experiment, the multifunction microplate reader and flow cytometer were used to quantitatively analyze the intracellular photosensitizer HPD, and the photosensitizer HPD uptake of normal bronchial epithelial cell lines and different lung cancer cell lines was investigated in vitro. Based animal xenograft models, organoid models, etc. were used to simulate the in vivo environment, and the mechanism of the high selectivity of photosensitizer HPD to tumor tissue was explored. In summary, under certain conditions in vitro, there are differences in the uptake of HPD by different human lung cancer cell lines. It can be concluded that the cellular uptake capacity of HPD: lung adenocarcinoma A549 cells>bronchial epithelial BEAS-2B cells and lung small cell carcinoma H446 cells>lung squamous carcinoma H520 cells, however, whether all lung adenocarcinomas have high HPD uptake capacity, and whether the cellular uptake of HPD is related to histological type, needs further research to verify.
Conflicts of Interest
The author(s) declared no potential conflicts of interest with respect to the research, authorship, and/or publication of this article.
Declarations
The manuscript not modified has been posted preprint on Research Square (https://doi.org/10.21203/rs.3.rs-1604371/v1).
References
- Senapathy GJ, George BP, Abrahamse H: Enhancement of Phthalocyanine Mediated Photodynamic Therapy by Catechin on Lung Cancer Cells. Molecules 2020, 25.
- Feng RM, Zong YN, Cao SM, Xu RH: Current cancer situation in China: good or bad news from the 2018 Global Cancer Statistics? Cancer Commun (Lond) 2019, 39:22.
- Chen W, Zheng R, Baade PD, Zhang S, Zeng H, Bray F, Jemal A, Yu XQ, He J: Cancer statistics in China, 2015. CA Cancer J Clin 2016, 66:115-132.
- Bray F, Ferlay J, Soerjomataram I, Siegel RL, Torre LA, Jemal A: Global cancer statistics 2018: GLOBOCAN estimates of incidence and mortality worldwide for 36 cancers in 185 countries. CA Cancer J Clin 2018, 68:394-424.
- Mokwena MG, Kruger CA, Ivan MT, Heidi A: A review of nanoparticle photosensitizer drug delivery uptake systems for photodynamic treatment of lung cancer. Photodiagnosis Photodyn Ther 2018, 22:147-154.
- Zhang T, Bao J, Zhang M, Ge Y, Wei J, Li Y, Wang W, Li M, Jin Y: Chemo-photodynamic therapy by pulmonary delivery of gefitinib nanoparticles and 5-aminolevulinic acid for treatment of primary lung cancer of rats. Photodiagnosis Photodyn Ther 2020, 31:101807.
- Zhang Y, Wang B, Zhao R, Zhang Q, Kong X: Multifunctional nanoparticles as photosensitizer delivery carriers for enhanced photodynamic cancer therapy. Mater Sci Eng C Mater Biol Appl 2020, 115:111099.
- Wang K, Yu B, Pathak JL: An update in clinical utilization of photodynamic therapy for lung cancer. J Cancer 2021, 12:1154-1160.
- Zhang J, Jiang C, Figueiro Longo JP, Azevedo RB, Zhang H, Muehlmann LA: An updated overview on the development of new photosensitizers for anticancer photodynamic therapy. Acta Pharm Sin B 2018, 8:137-146.
- Kwiatkowski S, Knap B, Przystupski D, Saczko J, Kedzierska E, Knap-Czop K, Kotlinska J, Michel O, Kotowski K, Kulbacka J: Photodynamic therapy - mechanisms, photosensitizers and combinations. Biomed Pharmacother 2018, 106:1098-1107.
- Gupta S, Dwarakanath BS, Muralidhar K, Jain V: Cellular uptake, localization and photodynamic effects of haematoporphyrin derivative in human glioma and squamous carcinoma cell lines. Journal of Photochemistry and Photobiology B: Biology 2003, 69:107-120.
- Rousset N, Vonarx V, Eléouet S, Carré J, Bourré L, Lajat Y, Patrice T: Cellular distribution and phototoxicity of benzoporphyrin derivative and Photofrin. Res Exp Med (Berl) 2000, 199:341-357.
- Kwon S, Lee Y, Jung Y, Kim JH, Baek B, Lim B, Lee J, Kim I, Lee J: Mitochondria-targeting indolizino[3,2-c]quinolines as novel class of photosensitizers for photodynamic anticancer activity. Eur J Med Chem 2018, 148:116-127.
- Lim CK, Heo J, Shin S, Jeong K, Seo YH, Jang WD, Park CR, Park SY, Kim S, Kwon IC: Nanophotosensitizers toward advanced photodynamic therapy of Cancer. Cancer Lett 2013, 334:176-187.
- Castano AP, Demidova TN, Hamblin MR: Mechanisms in photodynamic therapy: part one-photosensitizers, photochemistry and cellular localization. Photodiagnosis Photodyn Ther 2004, 1:279-293.
- Perry RR, Matthews W, Mitchell JB, Russo A, Evans S, Pass HI: Sensitivity of different human lung cancer histologies to photodynamic therapy. Cancer Res 1990, 50:4272-4276.
- Fickweiler S, Abels C, Karrer S, Bäumler W, Landthaler M, Hofstädter F, Szeimies RM: Photosensitization of human skin cell lines by ATMPn (9-acetoxy-2,7,12,17-tetrakis-(beta-methoxyethyl)-porphycene) in vitro: mechanism of action. J Photochem Photobiol B 1999, 48:27-35.
- Chwilkowska A, Saczko J, Modrzycka T, Marcinkowska A, Malarska A, Bielewicz J, Patalas D, Bana? T: Uptake of photofrin II, a photosensitizer used in photodynamic therapy, by tumour cells in vitro. Acta Biochimica Polonica 2003, 50:509-513.
- Woodburn KW, Vardaxis NJ, Hill JS, Kaye AH, Phillips DR: Subcellular localization of porphyrins using confocal laser scanning microscopy. Photochem Photobiol 1991, 54:725-732.
- Kou J, Dou D, Yang L: Porphyrin photosensitizers in photodynamic therapy and its applications. Oncotarget 2017, 8:81591-81603.
- Docchio F, Ramponi R, Sacchi CA, Bottiroli G, Freitas I: Time-resolved fluorescence microscopy of hematoporphyrin-derivative in cells. Lasers Surg Med 1982, 2:21-28.
- Korbelik M: Low density lipoprotein receptor pathway in the delivery of Photofrin: how much is it relevant for selective accumulation of the photosensitizer in tumors? J Photochem Photobiol B 1992, 12:107-109.
- Oenbrink G, Jürgenlimke P, Gabel D: Accumulation of porphyrins in cells: influence of hydrophobicity aggregation and protein binding. Photochem Photobiol 1988, 48:451-456.
- Iyer AK, Greish K, Seki T, Okazaki S, Fang J, Takeshita K, Maeda H: Polymeric micelles of zinc protoporphyrin for tumor targeted delivery based on EPR effect and singlet oxygen generation. J Drug Target 2007, 15:496-506.
- Hamblin MR, Newman EL: On the mechanism of the tumour-localising effect in photodynamic therapy. J Photochem Photobiol B 1994, 23:3-8.
- Pucelik B, Sulek A, Drozd A, Stochel G, Pereira MM, Pinto SMA, Arnaut LG, Dabrowski JM: Enhanced Cellular Uptake and Photodynamic Effect with Amphiphilic Fluorinated Porphyrins: The Role of Sulfoester Groups and the Nature of Reactive Oxygen Species. Int J Mol Sci 2020, 21.
- Mroz P, Yaroslavsky A, Kharkwal GB, Hamblin MR: Cell death pathways in photodynamic therapy of cancer. Cancers (Basel) 2011, 3:2516-2539.
- Verma A, Snyder SH: Peripheral type benzodiazepine receptors. Annu Rev Pharmacol Toxicol 1989, 29:307-322.
- Shulok JR, Wade MH, Lin CW: Subcellular localization of hematoporphyrin derivative in bladder tumor cells in culture. Photochem Photobiol 1990, 51:451-457.
- van Straten D, Mashayekhi V, de Bruijn HS, Oliveira S, Robinson DJ: Oncologic Photodynamic Therapy: Basic Principles, Current Clinical Status and Future Directions. Cancers (Basel) 2017, 9.



 Impact Factor: * 3.6
 Acceptance Rate: 78.21%
  Time to first decision: 10.4 days
  Time from article received to acceptance: 2-3 weeks