Artificial Neural Network Analysis of Prefrontal fnirs Blood Oxygenation Recordings
Wilhelm Ehleben1, Jörn M. Horschig2, Helmut Acker1*
1Forschungsinstitut für Notfallmedizin und Gesundheit (FONOG, UG), Kuntzestr. 59, D-44225 Dortmund, Germany
2Artinis Medical Systems B.B.; Einsteinweg 17, 6662 PW Elst, Netherlands
*Corresponding Author: Helmut Acker, Forschungsinstitut für Notfallmedizin und Gesundheit (FONOG, UG), Kuntzestr. 59, D-44225 Dortmund, Germany.
Received: 23 October 2023; Accepted: 30 October 2023; Published: 02 December 2023
Article Information
Citation: Wilhelm Ehleben, Jörn M. Horschig, Helmut Acker. Artificial Neural Network Analysis of Prefrontal fnirs Blood Oxygenation Recordings. Archives of Internal Medicine Research. 6 (2023): 116-128.
View / Download Pdf Share at FacebookAbstract
Purpose:
Noninvasive functional near infra-red spectroscopy (fNIRS) measuring brain oxygenated (O2Hb) and deoxygenated hemoglobin (HHb) is a promising technique for studying dementia diseases. fNIRS signals are determined by cerebral and extracerebral factors. The simultaneous measurement of as many as possible anatomical and physiological factors during fNIRS of the brain is a prerequisite to interpret fNIRS signals with respect to the degree of brain tissue oxygenation and blood flow microcirculation.
Methods:
We measured brain O2Hb-HHb relation by fNIRS and four bipolar EEG recordings simultaneously with HR, blood volume changes, SaO2 and galvanic skin resistance as autonomic nervous system marker. We analyzed the EEG recordings by a Fourier power analysis. The importance of each parameter for the fNIRS signal was assessed by nonlinear regression using an artificial neural network (ANN) analysis as a new tool of fNIRS signal interpretation.
Results:
We applied fNIRS to 5 healthy control patients and to 5 patients with brain disorders (BD). The fNIRS recordings of brain O2Hb and HHb of control patients responding to different task challenges like breath holding, odor presentation, skin touching or listening to music is mainly influenced by SaO2 and HR changes. The fNIRS recordings of brain O2Hb and HHb changes of BD patients responding to the different task challenges, however, is mainly influenced by high gamma and low theta EEG power frequencies as expression of high neurovascular coupling activity.
Conclusion:
Brain O2Hb-HHb relation in response to brain task challenges is significantly reduced in BD patients hinting to a disturbed brain blood microcirculation.
Keywords
<p>Functional near infra-red spectroscopy; O2Hb; HHb; Brain oxygen supply; Neuro vascular coupling; EEG Fourier power analysis; Brain disorder; Alzheimer disease; Artificial neural network</p>
Article Details
Abbreviation
ANA: Autonomic Nerve Activity; ANN: Artificial Neural Network; BD: Brain Disorder; C: control; EEG: Electroencephalogram; EFTA: EEG Time Frequency Analysis; fNIRS: Functional Near Infrared Spectroscopy; GSR: Galvanic Skin Resistance; Hb: Hemoglobin; HHb: Deoxygenated Hemoglobin; HR: Heart Rate; NVC: Neurovascular Coupling; Pleth: Photo Plethysmography; O2Hb: oxygenated hemoglobin; SaO2: blood oxygen saturation
Introduction
Functional near infrared spectroscopy (fNIRS) of brain oxygen supply has recently shown great promise as a tool in dementia research [20]. A regular and adequate supply of oxygen is essential for optimal brain neuronal functions. The oxygen supply is influenced by both cerebral and extracerebral factors. Cerebral factors include neuronal activity and neurovascular coupling degree (NVC), which is regulated by a complex unit consisting of neurons, astrocytes, pericytes, and blood vessels, controlling microcirculation and blood flow [9] [13]. Extracerebral factors involve the dependence of blood flow on heart rate (HR), arterial saturation (SaO2) controlled by ventilation, and galvanic skin response (GSR) associated with autonomic nerve activity (ANA), which regulates various body functions, including vascular resistance [18]. NVC primarily relies on neuronal activity and the neurotransmitter glutamate, which triggers the release of substances that actively relax pericytes, leading to the dilation of capillaries [9]. Our work focuses on improving the local resolution of brain fNIRS by compensating for the influence of general physiological factors using an artificial neural network (ANN). The ultimate goal of our study is to develop a user-friendly portable tool capable of detecting early signs of brain disorders in general medical settings, thereby facilitating early intervention and diagnosis in patients.
Material and Equipment
fNIRS method
fNIRS uses several optodes attached mostly to the frontal head with light wavelength range between 750 and 850 nm [7] to measure kinetics of oxygenated (O2Hb) and deoxygenated hemoglobin (HHb) in order to asses NVC and cerebral autoregulation [16]. The deepest 5% of the fNIRS emitted light was calculated to reach gray cerebral tissue 23mm inside the head, 17.4% reaches 20.3mm meaning that most of the emitted light contains information about extracerebral skin, bone and muscle oxygenation [10]. To compensate for these extracerebral factors the short distance optode method or the identification of optodes measuring preferentially extracerebral factors was proposed [9]. The interpretation of fNIRS signals with respect to NVC under different neuronal stimulation conditions is limited therefore by anatomical and physiological interferences [2] [18]. The simultaneous measurement of as many as possible anatomical and physiological parameters during the fNIRS registration and their identification in the fNIRS signal is a prerequisite for a complete NVC understanding (see for review [18].
fNIRS analysis
Like in other organs, cerebral blood flow and herewith oxygen supply depends on physiological parameters like HR, blood volume changes (Pleth), SaO2, ANA and neural cell activity. We measured these physiological parameters together with four bipolar EEG recordings (see Figure 1) simultaneously with fNIRS. EEG was analyzed by a Fourier power analysis resulting finally in 24 parameters for analyzing fNIRS signal with respect to cerebral and extracerebral oxygenation factors. The importance of each parameter for the fNIRS signal was assessed by an artificial neural network (ANN), as accepted for nonlinear regression analysis of big data in medicine [5]. Furthermore O2Hb-HHb relation plots were established to analyze brain oxygen supply regulation. We applied fNIRS to 5 healthy control patients and to 5 patients with brain disorders (BD) like Alzheimer disease known to have a disturbed NVC [13] due to imbalanced neuron astrocyte lactate shuttle [22]. In future, we aim to introduce fNIRS with ANN analysis and O2Hb-HHb relation plots as ambulant tools to diagnose and document first signs of BD or to follow up therapeutic success in treating patient’s cognition deficiencies in general medicine practices.
Device set up
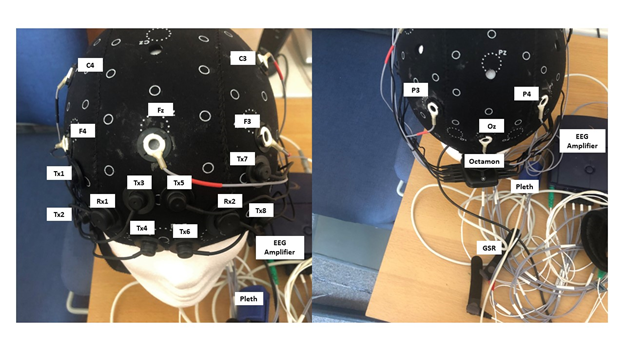
Figure 1: depicts the experimental setup of the brain Octamon NIRS. The setup includes Tx1-Tx8 diodes emitting light at wavelengths of 751nm and 843nm. The emitted light passes through the brain tissue and is subsequently captured by Rx1 and Rx2. This configuration allows for the simultaneous measurement of oxygenated (O2Hb) and deoxygenated (HHb) blood levels. Additionally, bipolar EEG recordings (F3-F4, C3-C4, Fz-Oz, P3-P4), galvanic skin response (GSR), heart rate, and peripheral blood oxygen saturation are recorded. Furthermore, blood volume changes are assessed using photo-plethysmography (Pleth) techniques.
Figure 1 shows a head cap combining the 8-channel fNIRS OctaMon device (Artinis Medical Systems B.V, Elst, Netherlands) and the Bluetooth EEG TMSiMobi 6 channel amplifier (TMSi, Oldenzaal, Netherlands). Tx1-Tx8 transmitter diodes of the OctaMon emit light of ~751nm and ~843nm, which is mainly absorbed by hemoglobin and less by water or lipids [7]. fNIRS light is recorded by two receivers, Rx1 and Rx2, after passing brain tissue for determining O2Hb and HHb blood level using the Modified Lambert-Beer Law. Simultaneously 4 bipolar EEG recordings (F3-F4, C3-C4, Fz-Oz, P3-P4), galvanic skin response (GSR) for measuring ANA, HR and SaO2 by means of photo plethysmography (Pleth) as well blood volume changes on the fingertip were recorded at a rate of 256 Hz. The fNIRS sampling rate was 50 Hz. fNIRS data were upsampled to 256 Hz to match the sampling rate of the other devices. The program OxySoft (Artinis Medical Systems B.V, Elst, Netherlands) was used to record the data, visualize and compute the recorded data. For further analysis data were stored as Excel files (Microsoft).
Patients
10 patients consulting regularly a practice for general medicine linked to FONOG (see for more information: www.fonog.de) were offered a control of brain oxygen supply by fNIRS. 5 patients (mean age 45±10y) without BD served as control whereas 5 patients (mean age 62±22y) including 3 with Alzheimer disease (ICD10 G30.9, mean age 74±8y), 1 suffering from a stroke episode (ICD10 I69.4, age 69y), 1 with autism (ICD10 F84.1, age 24y) served as BD example. Both groups are statistically not different (p>0,05) regarding age. The patients gave written informed consent using the Patient Consent Form Template (https://www.medizininformatik-initiative.de/) for making use of their data in this publication. The institutional ethics committee of the Ärztekammer Westfalen Lippe (Münster/Germany) was informed about the use of the patient data for this study (2023-199-f-S).
EEG Time frequency analysis (ETFA)
EEG time series were detrended by subtracting the least-squares fit of a straight line to the data. The time frequency representation was then obtained by applying short time Fourier transform with a Hamming window of 128 points and 50% overlap. The amplitude of the resulting spectrum was converted to dB and the time frequency representation was finally interpolated to 256 Hz. Lastly, the mean amplitude for the EEG bandwidths delta (1-4 Hz), theta (4-8 Hz), alpha (8-13 Hz), beta (14-30 Hz) and gamma (30-100 Hz) was computed for bipolar EEG recordings.
NVC Stimulation
Patients were asked to rest for 10 minutes on a comfortable chair to get adapted to the fNIRS-EEG head cap. Three different tasks were used to test NVC.
- Changes of blood gas levels for 20 seconds by 100% O2 ventilation improving hemoglobin oxygenation, breath hold inducing hypoxia and hypercapnia or hyperventilation followed by hypocapnia known to change brain blood flow [16] [19].
- Stimulation of the sensory network by smelling on a standardized sniffing stick and tasting a standardized taste test strip (Burghart Messtechnik GmbH, Wedel/BRD) or touching the neck with a soft brush each for 20 seconds.
- Cognition challenges for 20 seconds by solving a simple arithmetic task without verbalizing the result, by presenting an aesthetic erotic picture of a Pfizer Viagra calendar or by playing popular music like songs by The Beatles.
Statistics
Analysis of the data started 10s before the 20s task onset with normalization of the fNIRS data and was finished about 30-40s after offset of the task. Differences of recordings between control patients (n=5) and brain disorder patients (n=5) regarding the impact of 24 parameters on brain O2Hb level or the time course per second of brain O2Hb level were compared with two-factor ANOVA (Excel, Microsoft, Munich, Germany). The level of statistical significance was set to the alpha error level of p<0.05. Graphs were generated by Excel and Power Point (Microsoft, Munich, Germany).
Relative importance - comparable to the standardized beta-coefficient of linear regression - of the 24 parameters for recalculating O2Hb and HHb reactions to the different NVC stimulation was assessed with nonlinear regression by ANN. ANN (see Figure 4) is composed of 1- neural layer containing up to 50 units called hidden layer, 1 input layer containing the 24 explanatory parameters and 1 output layer containing the fNIRS measured oxygenation variables (Multilayer Perceptron Network, IBM SPSS Statistics, Armonk, NY software version 27). About 70% of the measured parameter values were used for training of ANN. The subsequent testing by ANN used 30% of the measured parameter values. The time for training and testing was about 3 seconds respectively and the mean relative error of recalculation amounted to 0,065±0,017.
Results
Data recording
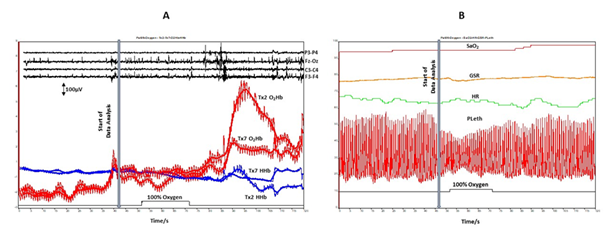
Figure 2: Figure 2A displays the response of O2Hb and HHb to a 20-second inhalation of 100% oxygen (indicated by the event marker) in a male control patient (39 years old). The measurements were taken using NIRS on the right (Tx2) and left (Tx7) frontal head regions, alongside simultaneous recording of bipolar EEG (F3-F4, C3-C4, Fz-Oz). In Figure 2B, peripheral blood oxygen concentration (SaO2), Galvanic skin response (GSR), Heart Rate (HR), and blood volume changes assessed through photo-plethysmography (Pleth) are depicted. Data analysis commences 10 seconds prior to the initiation of 100% oxygen inhalation
Figure 2A shows oxygenated blood (red, O2Hb) and deoxygenated blood (blue, HHb) reaction to 100% oxygen inhalation for 20s of one male control patient (39y) as measured by fNIRS on the right (Tx2) and left (Tx7) frontal head. The O2Hb and HHb fNIRS signal is oscillating due to blood volume changes in dependence on heart beat and respiration. These oscillations are smoothed for further analysis by a moving Gaussian filter shown as red and blue continuous line. Simultaneous registrations of bipolar EEGs (F3-F4, C3-C4, Fz-Oz, P3-P4) are shown in black in the upper part. Figure 2B shows changes of SaO2, GSR (ANA), HR and Pleth during the same time period. Data analysis starts generally 10s before onset of all NVC stimulations as in this example by 100% oxygen inhalation. O2Hb starts to increase and HHb to decrease about 20s after finishing 100% oxygen inhalation. Concomitantly EEG activity increases in all EEG channels. SaO2 as shown in Figure 2B starts to increase after the same time, but GSR (ANA) decreases during inhalation already, HR is at about 65 bpm and Pleth shows partly diminished blood volume changes probably superimposed with various lower frequency components attributed to respiration, sympathetic nervous system activity and thermoregulation [3].
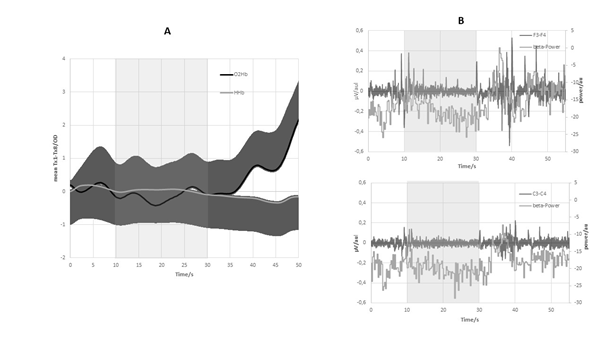
Figure 3A: Presents the mean reaction of O2Hb and HHb, along with the corresponding standard deviation (SD), in a control patient to a 20-second inhalation of 100% oxygen (shaded area). Notably, the O2Hb levels exhibit a significant increase (depicted by the black line), while the HHb levels show a non-significant decrease (depicted by the gray line).
Figure 3B: Examples of simultaneous bipolar EEG recordings (F3-F4 and C3-C4) are shown, represented by the dark registration. Additionally, the corresponding beta power is displayed in gray registration."
Figure 3A Shows the mean O2Hb and HHb reaction of channel T1-Tx8 and corresponding standard deviation (SD) of the 39y old male control patient to 100% oxygen inhalation for 20s (shaded area) with significant increase (p<0.05) of O2Hb (black line) and a non-significant decrease of HHb (gray line). Figure 3B shows examples of simultaneous bipolar EEG F3-F4 and C3-C4 recordings (black registration) during the NVC stimulation as well as the corresponding EEG beta power calculation (gray registration). ANN analysis is getting involved now for assessment of the importance of the 24 parameters measured and calculated during the experiment.
Data Analysis
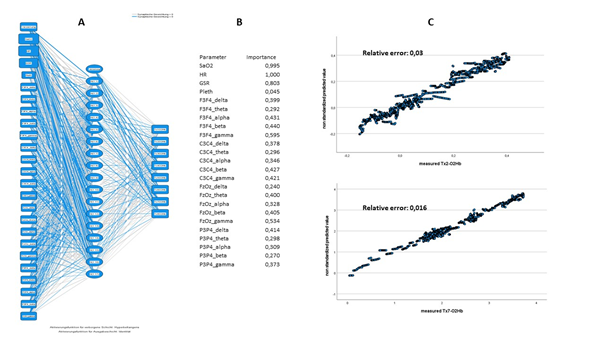
Figure 4A: Shows the application of artificial neural network (ANN) in nonlinear regression analysis to assess the importance of 24 explanatory variables (input layer, left row). The analysis aims to recalculate the dependent variables, namely Tx1-Tx8 O2Hb changes (output layer, right row), under 100% oxygen ventilation. A neural layer with 18 units (hidden layer, middle row) is employed for this purpose. The thickness of the lines in the figure represents the degree of nonlinear regression, with thicker lines indicating a higher degree.
Figure 4B (left): A list of the 24 parameters is provided, along with their corresponding relative importance values. These importance values can be compared to the standardized beta-coefficient of linear regression for recalculation.
Figure 4C: exhibits the linear relationship between the measured values (x-axis) and the recalculated values using ANN (y-axis) for Tx2 O2Hb (top) and Tx7 O2Hb (bottom). The relative error between these values is also depicted.
Figure 4A shows the ANN set up for analyzing the relative importance of 24 measured explanatory parameters (left row) for estimating Tx1-Tx8 O2Hb dependent variables (right row) under 100% oxygen ventilation using one neural layer with 18 units (middle row). Figure 4B shows the list of 24 explanatory parameter measured and calculated during the experiment and their relative importance used for recalculation. Figure 4C shows linear relationship between measured (x-axis) and ANN (y-axis) recalculated Tx2 O2Hb (upper graph) and Tx7 O2Hb (lower graph) values and the corresponding relative error of the39y old male control patient exposed to 100% oxygen inhalation.
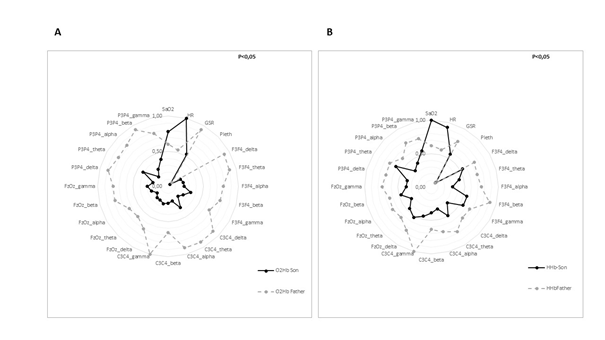
Figure 5A: Depicts a net diagram illustrating the importance of 24 parameters in the artificial neural network (ANN) recalculation of NIRS O2Hb changes following a 20-second inhalation of 100% oxygen. The analysis focuses on a control person aged 39 (black line) and his 69-year-old father (gray line), who suffers from post-stroke brain disorders.
Figure 5B: The same analysis can be applied to NIRS HHb changes. Peripheral factors such as SaO2 and HR play a dominant role in recalculating NIRS O2Hb and HHb changes in the control person. On the other hand, GSR and various brain activities, as measured by EEG, are dominant in recalculating NIRS O2Hb and HHb changes in the person with brain disorders. It is worth noting that the ANN recalculation of NIRS O2Hb and HHb changes between the father and son significantly differs (p<0.05, Anova).
Figure 5A shows a net diagram of the relative importance of 24 parameters for recalculating fNIRS O2Hb changes upon 100% O2 inhalation for 20 s of a 39y old control patient (black solid line) and his 69y old father suffering from post-stroke BD (gray solid line). Figure 5B shows the same analysis for fNIRS HHb changes. Peripheral factors like SaO2 and HR have a dominant visible importance for recalculating fNIRS O2Hb changes of the control patient whereas GSR and various brain activities as measured by EEG are of visible dominance for recalculating fNIRS O2Hb changes of the patient with BD. Figure 5B shows the same analysis for fNIRS HHb changes. Peripheral factors like SaO2 and HR have a visible dominance for recalculating fNIRS HHb changes of the control patient whereas various brain activities as measured by EEG and calculated by ETfA are of importance for recalculating HHb changes of the patient with BD. The ANN analysis of fNIRS O2Hb changes and fNIRS HHb changes regarding the relative importance of the 24 parameters and their influence on the fNIRS signals is significantly different (p<0.05, Anova) between father and son hinting to a particular NVC stimulation of BD patients under 100% oxygen inhalation.
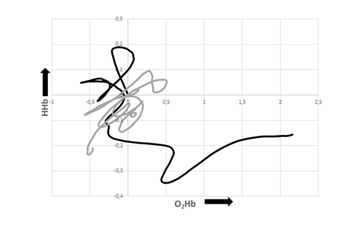
Figure 6: Relation between O2Hb (x-axis, arbitrary units) and HHb (y-axis, arbitrary units) kinetics under 100 % O2 NVC stimulation conditions as indication of reactivity of brain blood microcirculation. Son as control patient (black line) and father as BD patient (gray line) show a marked difference in microcirculation regulation as indication of reduced brain oxygen supply in the BD patient.
Figure 6 shows the relation between O2Hb (x-axis, arbitrary units) and HHb (y-axis, arbitrary units) kinetics under 100 % O2 NVC stimulation conditions as indicating reactivity of brain blood microcirculation. Son as control patient (black line) shows with increasing O2Hb (x-axis) and decreasing HHb (y-axis) an expected course of the brain oxygen supply under 100% O2 inhalation. The father as BD patient (gray line), however, shows a reduced O2Hb-HHb relation as sign of reduced brain oxygen supply in the BD patient.
To substantiate these findings four more control and four more brain BD patients have been studied as shown in Figure 7 and Figure 8
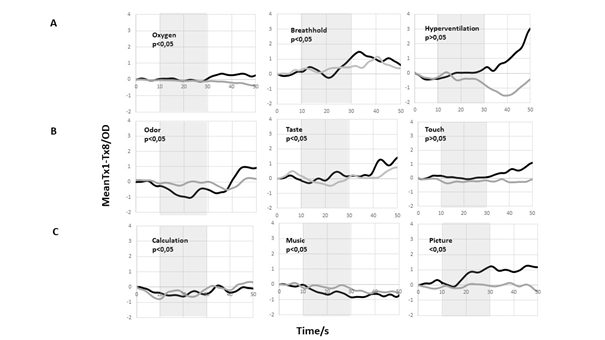
Figure 7A: horizontal row: mean Tx1-Tx8 O2Hb response of five control persons (black continuous line) and five persons with brain disorders (gray continuous line) to 20s duration (shaded area) of 100% oxygen inhalation, breath hold and hyperventilation. p<0,05 (Anova) indicates significant difference in NIRS O2Hb response between control and brain disorder persons.
Figure 7B: horizontal row: mean Tx1-Tx8 O2Hb response of five control persons (black continuous line) and five persons with brain disorders (gray broken line) to 20s duration (shaded area) of odor, taste and touch experience. p<0,05 (Anova) indicates significant difference in NIRS O2Hb response between control and brain disorder persons.
Figure 7C: horizontal row: mean Tx1-Tx8 O2Hb response of five control persons (black continuous line) and five persons with brain disorders (gray broken line) to 20s duration (shaded area) of calculation, music and picture presentation. p<0,05 (Anova) indicates significant difference in NIRS O2Hb response between control and brain disorder persons.
- All graphs are scaled using the same amplification factor.
Figure 7 starts with the ANN analysis the brain O2Hb kinetics.
Figure 7A horizontal row shows mean Tx1-Tx8 O2Hb response of five control patients (black continuous line) and five patients with BD (gray continuous line) to 20s duration of 100% oxygen inhalation, breath hold and hyperventilation. p<0.05 (Anova) indicates significant difference in fNIRS O2Hb response between control and BD patients. Hyperventilation has no statistical difference between the patient groups.
Figure 7B horizontal row shows the mean Tx1-Tx8 O2Hb response of five control patients (black continuous line) and five patients with brain disorders (gray solid line) to 20s duration of odor, taste and touch challenges. p<0.05 (Anova) indicates significant difference in fNIRS O2Hb response between control and brain disorder patients. Touch stimulation has no statistical difference between the patient groups.
Figure 7C horizontal row shows the mean Tx1-Tx8 O2Hb response of five control patients (black continuous line) and five BD patients (gray solid line) to 20s NVC stimulation with calculation, music and picture presentation. p<0.05 (Anova) indicates significant difference in fNIRS O2Hb response between control and BD patients.
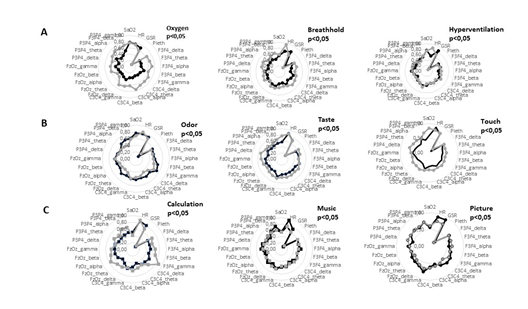
Figure 8A horizontal row: Net diagram of 24 parameter importance for recalculating NIRS O2Hb changes of five control persons (black continuous line) and of five persons with brain disorders (gray continuous line) upon 100%O2 inhalation, breath hold and hyperventilation for 20s. p<0,05 (Anova) indicates significant difference of parameter importance like electrical brain activity between control and brain disorder persons.
Figure 8B horizontal row: Net diagram of 24 parameter importance for recalculating NIRS O2Hb changes of five control persons (black continuous line) and of five persons with brain disorders (gray broken line) upon stimulation by odor, taste and touch for 20s. p<0,05 (Anova) indicates significant difference of parameter importance like electrical brain activity between control and brain disorder persons.
Figure 8C horizontal row: Net diagram of 24 parameter importance for recalculating NIRS O2Hb changes of five control persons (black continuous line) and of five persons with brain disorders (gray broken line) upon calculation, music and picture presentation for 20s. p<0,05 (Anova) indicates significant difference of parameter importance like electrical brain activity between control and brain disorder persons.
- All graphs are scaled using the same amplification factor.
Figure 8 continuous with the ANN calculated impact of the recorded and calculated 24 parameters on brain O2Hb kinetics depicted by net diagrams. Here the different impact meaning on control and BD patients is visualized very convincing.
Figure 8A horizontal row shows net diagrams of the relative importance of 24 parameters for recalculating fNIRS O2Hb changes of five control patients (black continuous line) and of five patients with BD (gray continuous line) upon 100% O2 inhalation, breath hold and hyperventilation for 20s. p<0.05 (Anova) indicates significant difference of relative importance like electrical brain activities between control and BD patients.
Figure 8B horizontal row shows net diagrams of relative importance of 24 parameters for recalculating fNIRS O2Hb changes of five control patients (black continuous line) and of five patients with BD (gray continuous line) upon stimulation by odor, taste and touch for 20s. p<0.05 (Anova) indicates significant difference of relative importance like electrical brain activities between control and brain disorder patients. Odor stimulation leads to a significant lower impact of the 24 parameters in BD patients.
Figure 8C Net diagram of relative importance of 24 parameters for recalculating fNIRS O2Hb changes of five control patients (black continuous line) and of five patients with BD (gray continuous line) upon calculation, music and picture presentation for 20s is shown in the lower horizontal row. p<0.05 (Anova) indicates significant difference of relative importance like electrical brain activities between control and BD patients.
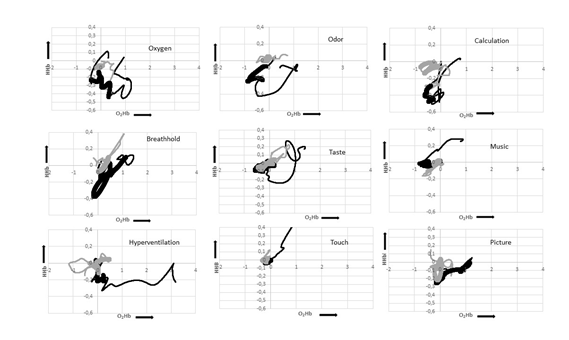
Figure 9 uses the O2Hb - HHb relation plot as introduced by Figure 6 to estimate the reactivity of the brain blood microcirculation. Figure 8 continuous with the ANN calculated impact of the recorded and calculated 24 parameters on brain O2Hb kinetics depicted by net diagrams. Here the different impact meaning on control and BD patients is visualized very convincing.
Figure 8A horizontal row shows net diagrams of the relative importance of 24 parameters for recalculating fNIRS O2Hb changes of five control patients (black continuous line) and of five patients with BD (gray continuous line) upon 100% O2 inhalation, breath hold and hyperventilation for 20s. p<0.05 (Anova) indicates significant difference of relative importance like electrical brain activities between control and BD patients.
Figure 8B horizontal row shows net diagrams of relative importance of 24 parameters for recalculating fNIRS O2Hb changes of five control patients (black continuous line) and of five patients with BD (gray continuous line) upon stimulation by odor, taste and touch for 20s. p<0.05 (Anova) indicates significant difference of relative importance like electrical brain activities between control and brain disorder patients. Odor stimulation leads to a significant lower impact of the 24 parameters in BD patients.
Figure 8C Net diagram of relative importance of 24 parameters for recalculating fNIRS O2Hb changes of five control patients (black continuous line) and of five patients with BD (gray continuous line) upon calculation, music and picture presentation for 20s is shown in the lower horizontal row. p<0.05 (Anova) indicates significant difference of relative importance like electrical brain activities between control and BD patients.
Figure 9 uses the O2Hb - HHb relation plot as introduced by Figure 6 to estimate the reactivity of the brain blood microcirculation.
Figure 9: Relation between O2Hb (x-axis, arbitrary units) and HHb (y-axis, arbitrary units) kinetics under different NVC stimulation conditions as indication of reactivity of brain blood microcirculation. First vertical row shows O2Hb-HHb relation plot during changes of blood gases by 100% oxygen inhalation, breath hold and hyperventilation, the second vertical row under odor, taste and touch exposure and the third vertical row during calculation, music and picture brain challenges. Data of 5 control patients are shown as black continuous lines and of 5 BD patients as gray continuous lines. The stimulation period is shown as bold line. BD patients show under all NVC stimulation conditions a markedly reduction in microcirculation regulation as indication of reduced brain oxygen supply.
Figure 9 shows the relation between O2Hb (x-axis) and HHb (y-axis) kinetics under different NVC stimulation conditions. First vertical row shows O2Hb versus HHb kinetics during changes of blood gases by 100% oxygen inhalation, breath hold and hyperventilation, the second vertical row under odor, taste and touch exposure and the third vertical row during calculation, music and picture brain challenges. Data of 5 control patients are shown as continuous black lines and of 5 BD patients as continuous gray lines. The stimulation period is shown as bold line. Control patients and BD patients have significant different O2Hb versus HHb kinetics (p<0,05, Anova) with a clear limited response of BD patients which is very obvious with oxygen, hyperventilation, odor, touch, music and picture stimulation. Oxygen inhalation leads to an increase of O2Hb and a decrease of HHb whereas breath hold dominates with a decrease of O2Hb and an increase of HHb which persists even in the recovery period with increasing O2Hb. Increase of HHb with increasing O2Hb is dominating in control patients hinting to an increased neuronal oxygen consumption requiring an increased oxygen supply. Hyperventilation of control patients seems to induce an overload with oxygenated Hb and a diminished oxygen consumption as it can be deduced from the constantly decreased HHb. BD patients however show a very reduced O2Hb - HHb relation reaction under odor, touch, and music exposure.
Discussion
fNIRS technique
The interpretation of fNIRS signals with respect to NVC is generally accepted as difficult due to the additional influence of different physiological parameters. For instance, the systemic physiology augmented functional near-infrared spectroscopy (SPA-fNIRS) was described to measure systemic physiological activity like heart rate, mean arterial pressure, and end-tidal CO2 simultaneously in order to regress out physiological confounding components in the fNIRS signals [1] [18]. A multivariate model including age, heart rate, arterial oxygen saturation, mean arterial pressure, pH, PO2, PCO2 and hemoglobin concentration [HB] showed that the regional brain oxygen saturation as measured by NIRS was significantly associated with PCO2 and Hb concentration [Hb] [21]. Due to its relatively low spatial and temporal resolution and its low depth penetration of cortical tissue NIRS has important limits in the determination of whole brain activity during complex cognitive or motor activities. To overcome these limits, NIRS can be combined with MRI or EEG to gain insight in the metabolic and/or electrical activity of the brain as described by [2] and allows investigations of slow hemodynamic changes related to the NVC dynamics [2].
Data analysis
We show here for the first time ANN as a helpful technique to analyze NIRS recorded O2Hb and HHb changes by using 24 parameters including systemic physiological and local EEG brain activities. This analysis gives hints to possible importance of the 24 parameters for the course of brain O2Hb and HHb kinetics due to blood gas changes, sensory stimulations and cognitive tasks. Applying the different tasks to control patients as well as to BD patients revealed a remarkable difference as summarized in Figure 8. A significant higher importance of local brain activities as recorded by EEG was seen under 100% oxygen ventilation, breath hold and hyperventilation which might hint to enhanced NVC due to CO2 increased cerebral blood flow. Elevated CBF was observed in an MRT study in most cerebral regions under hypercapnia 10s after a 20s breath hold period [19]. Hyperventilation with decreased CO2, however, showed difference net diagram in spite of missing differences in fNIRS recorded O2Hb changes. Odor presentation resulted in attenuated brain activity impact of BD patients in contrast to taste and touch with increased impact of brain activity (net diagram Figure 8B) as shown by ANN analysis. Many age-related dementias, such as Alzheimer’s disease, Vascular dementia, Parkinson’s disease, and Frontotemporal Dementia often display olfactory dysfunction [4]. The impact of brain activity was significantly reduced under odor exposure whereas taste and touch stimulation showed a significant influence on different NIRS kinetics for BD patients. Calculation, music or picture revealed significant higher activity impact for BD patients. Simultaneous registration of brain O2Hb and HHb was shown as prerequisite for analyzing brain oxygen supply [12]. Figure 9 shows the significant dysregulation of BD brain oxygen supply by means of O2Hb-HHb relation plots. The typical response to task challenges of control patients with increasing O2Hb and increasing HHb hinting to an enhanced oxygen demand and increased oxygen consumption is reduced or missing in the case of BD patients. Disturbances of brain blood flow and herewith oxygen supply seem to be under the early events of Alzheimer disease [14].
Brain neural activity
The higher brain activity impact of BD patients is resembling neural noise, comparable to an increase of the overall level of random variability in the aging brain activity [2] which might affect the pattern of EEG power bands as calculated by ANN analysis.
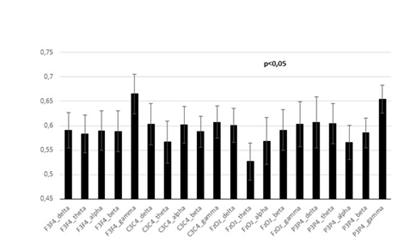
Figure 10: Two factor Anova analysis of power band composition of 4 EEG channels (F2-F3; C3-C4; Fz-Oz; P3-P4). Shown are mean values and the corresponding variance. Data are from BD patients challenged by 100% oxygen ventilation, breath hold, taste, touch and calculation tasks are showing a significant high neural impact on cerebral O2Hb NIRS as calculated by ANN. The significant high impact (p<0,05) of high frequency F3-F4 gamma and P3-P4 gamma power band as well as of low frequency Fz-Oz theta power band might cause EEG noise of BD patients.
Figure 10 shows a two factor ANOVA analysis of power band composition of 4 EEG channels (F2-F3; C3-C4; Fz-Oz; P3-P4) recorded with O2Hb changes from BD patients which were challenged by 100% oxygen ventilation, breath hold, taste, touch and calculation tasks followed by dominant neuronal brain impact (see Figure 8 A, B, C). The significant high impact of high frequency F3-F4 gamma and P3-P4 gamma power band as well as of low frequency Fz-Oz theta power band as shown in Figure 10 might be partly involved in the generation of BD EEG noise [17]. This assumption is supported by describing the most prominent effects of neurodegeneration on EEG being localized in frontocentral regions with an increase in high frequency oscillations (higher beta and gamma power) and a decrease in low frequency oscillations (lower delta power) [8]. Information transfer of somatosensory gamma oscillation in the cortico-thalamo-cortical system is mediated by NMDA receptors [17]. NVC disorders that result from a mismatch between cerebral blood flow, O2 delivery and neural activity are found in the early stages of many neurologi¬cal disorders including Alzheimer disease (AD), amyo¬trophic lateral sclerosis (ALS) and stroke [13]. Beside the amyloid cascade hypothesis [11] the neuroenergetic AD hypothesis focuses on the early event of glucose hypometabolism in AD, where astrocytes play a key role, caused by an imbalanced neuron-astrocyte lactate shuttle probably influencing NVC. This might result in a state of oxidative stress and neuroinflammation, thereby compromising the integrity of astrocyte-neuron interaction [22]. AD patients show parietal activation deficits compared to healthy older subjects during visuospatial process in, but not during a color discrimination control task [2]. The impact of the ANA signal as recorded by GSR in our experiments is evidenced by the higher resting vagal tone being associated with improved cognitive function [6]. The prevailing pattern of autonomic disturbances in dementia is one of elevated sympathetic and depressed vagal activity. This may suggest that loss of the natural vagal tone in dementia could be implicated in the observed decline in cognitive function [6]. Baroreceptor influence was seen on younger male patients standing up from supine compared to sitting position being positively associated with cerebral oxygenation drop as measured by NIRS. Older male patients standing up from sitting compared to supine position were associated with higher cerebral oxygenation recovery [15].
There might be in future more modalities necessary to assess functional body function registration such as continuous registration of blood pressure, microcirculation, arterial pH and PCO2 changes or vasomotor activity in order to adapt fNIRS data AI analysis to the complex interconnectivity of brain functions. A sophisticated nonlinear regression calculating tool like any form of artificial intelligence technique is a fundamental prerequisite to improve this analysis.
Conclusion
- fNIRS technique non-invasively measuring brain oxygen supply is a promising tool for ambulant diagnosis and documentation of brain disorder patients in general medicine practice.
- ANN analysis reveals NVC influences on the HB oxygenation status and might serve therefore as a new future tool for fNIRS data analysis excluding confounding parameters.
- The fNIRS recordings of brain O2Hb and HHb changes of control patients responding to task challenges is mainly influenced by SaO2 or HR changes masking NVC influence due to low neural activities.
- The NIRS recordings of brain O2Hb and HHb changes of BD patients responding to task challenges is mainly influenced by high gamma power and low theta EEG waves as an expression of NVC masking influence of physiological entities.
- ANN analysis of particular EEG wave power importance is confirmed by literature data about brain disorders.
- O2Hb-HHb plots reveal the complex reactivity of brain oxygen supply of control patients and a missing or reduced regulation of blood microcirculation of BD patients.
Declarations
Ethical Approval and Consent to participate
The study was conducted in accordance with the Declaration of Helsinki. The patients gave written informed consent using the Patient Consent Form Template (https://www.medizininformatik-initiative.de/) for making scientific use of their fNIRS data in this publication. The institutional ethics committee of the Ärztekammer Westfalen Lippe (Münster/Germany) approved the use of the patient data for this study (2023-199-f-S).
Consent for publication
Not applicable
Availability of data and materials
The data reported in this manuscript are available within the article. Additional data will be shared by request to Prof. Dr, Helmut Acker from any qualified investigator.
Competing interests
The authors declare no competing interests
Funding
Private donation for supporting the project
Authors' contributions
Dr. med. Wilhelm Ehleben: head of the practice for general medicine, consultant for general medicine, physiology, emergency medicine, palliative medicine, flight medicine
Choosing patients and application of fNIRS to patients, analysis of data, manuscript preparation
Dr. rer. nat Jörn M. Horschig: PhD, software manager, project leader
EEG power analysis, Octamon software management, manuscript preparation
Prof.(em) Dr. med. Helmut Acker: consultant for physiology and acupuncture
fNIRS data registration and analysis, manuscript preparation
Acknowledgements
We thank Gisela Acker for her generous private donation of the project and Sofia Sappia for her excellent contribution by establishing the EEG Fourier analysis. The patients gave written informed consent using the Patient Consent Form Template https://www.medizininformatik-initiative.de/) for making use of their data in this publication. Thanks to all the patients who have given written consent to the scientific use of their fNIRS data in this study.
References
- Abdalmalak, A, Novi, S.L., Kazazian, K, et al. Effects of Systemic Physiology on Mapping Resting-State Networks Using Functional Near-Infrared Spectroscopy. Front Neurosci 16 (2022): 1-15.
- Agbangla, N.F., Audiffren, M., Albinet, C.T. Use of near-infrared spectroscopy in the investigation of brain activation during cognitive aging: A systematic review of an emerging area of research. Ageing Res Rev 38 (2017): 52-66.
- Allen, J. Photoplethysmography and its application in clinical physiological measurement. Physiol Meas (2007).
- Alves, J. Olfactory dysfunction in dementia. World J Clin Cases 2 (2014): 661-667.
- Richards, D. Tsao, A.Z. The application of artificial intelligence to biology and neuroscience. Cell 5 (2022): 2640-2643.
- Beishon, L.C., Hosford, P., Gurung, D., et al. The role of the autonomic nervous system in cerebral blood flow regulation in dementia: A review. Auton Neurosci 240 (2022): 102985.
- Davies, D.J., Su, Z., Clancy, M.T. Near-Infrared Spectroscopy in the Monitoring of Adult Traumatic Brain Injury: A Review. J Neurotrauma 32 (2015): 933-941.
- Gaubert, S., Raimondo, F., Houot, M., et al. EEG evidence of compensatory mechanisms in preclinical Alzheimer’s disease. Brain 142 (2019): 2096-2112.
- Haeussinger, F.B., Dresler, T., Heinzel, S., et al. Reconstructing functional near-infrared spectroscopy (fNIRS) signals impaired by extra-cranial confounds: An easy-to-use filter method. Neuroimage 95 (2014): 69-79.
- Haeussinger, F.B., Heinzel, S., Hahn, T., et al. Simulation of near-infrared light absorption considering individual head and prefrontal cortex anatomy: Implications for optical neuroimaging. PLoS One 6 (2011).
- Kepp, K.P., Robakis, N.K., Høilund-Carlsen, P.F., et al. The amyloid cascade hypothesis: an updated critical review. Brain 146 (2023): 3969–3990.
- Kinder, K.T., Heim, H.L.R., Parker, J., et al. Systematic review of fNIRS studies reveals inconsistent chromophore data reporting practices. Neurophotonics 9 (2022).
- Kisler, K., Nelson, A.R., Montagne, A., et al. Cerebral blood flow regulation and neurovascular dysfunction in Alzheimer disease. Nat Rev Neurosci 18 (2017): 419–434.
- Korte, N., Nortley, R., Attwell, D. Cerebral blood flow decreases as an early pathological mechanism in Alzheimer’s disease. Acta Neuropathol (2020).
- Mol, A., Claassen, J.A.H.R., Maier, A.B., et al. Determinants of orthostatic cerebral oxygenation assessed using near-infrared spectroscopy. Auton Neurosci (2022).
- Oldag, A., Neumann, J., Goertler, M., et al. Near-infrared spectroscopy and transcranial sonography to evaluate cerebral autoregulation in middle cerebral artery steno-occlusive disease. J Neurol 263 (2016): 2296–2301.
- Quin Yi, M.A.B.M.A.P.M., K.S.P.D. The psychotomimetic ketamine disrupts the transfer of late sensory information in the corticothalamic network. European Journal of Neuroscience (2022): 1-16.
- Scholkmann, F., Tachtsidis, I., Wolf, M., et al. Systemic physiology augmented functional near-infrared spectroscopy: a powerful approach to study the embodied human brain. Neurophotonics 9 (2022): 1-24.
- Solis-Barquero, S.M., Echeverria-Chasco, R., Calvo-Imirizaldu, M., et al. Breath-Hold Induced Cerebrovascular Reactivity Measurements Using Optimized Pseudocontinuous Arterial Spin Labeling. Front Physiol 12 (2021): 1-11.
- Srinivasan, S., Butters, E., Collins-Jones, L., et al. Illuminating neurodegeneration: a future perspective on near-infrared spectroscopy in dementia research. Neurophotonics 10 (2023).
- Wood, M.D., Jacobson, J.A., Maslove, D.M., et al. The physiological determinants of near-infrared spectroscopy-derived regional cerebral oxygenation in critically ill adults. Intensive Care Med Exp 7 (2019): 2-15.
- Zulfiqar, S., Garg, P., Nieweg, K. Contribution of astrocytes to metabolic dysfunction in the Alzheimer’s brain. Biol Chem 400 (2019): 1113–1127.


 Impact Factor: * 3.6
 Acceptance Rate: 78.21%
  Time to first decision: 10.4 days
  Time from article received to acceptance: 2-3 weeks