Assessment of Nutritional Status and Functional Capacity among Geriatric Population of Rural and Urban Area of Chattogram District of Bangladesh
Muhammed Raihan Chowdhury1*, SM Kamrul Hoque2, Mohammad Abu Hanif Chowdhury3, Istiak Ahmed4, Sujat Paul5, Asok Kumar Dutta6
1Assistant Professor (Medicine) (In Situ), Cumilla Sadar South Health Complex, Cumilla, Bangladesh
2Assistant Professor (Medicine), Chattogram Medical College, Chattogram, Bangladesh
3Junior Consultant (Medicine), Bibirhat 20 Bed Hospital, Fatikchhari, Chattogram, Bangladesh
4Junior Consultant (Medicine), Chattagram Medical College Hospital, Chattogram, Bangladesh
5Professor, Department of Medicine, Chittagong Medical College, Chattogram, Bangladesh
6Professor (Ex) and Head, Department of Medicine, Chittagong Medical College, Chattogram, Bangladesh
*Corresponding author: Muhammed Raihan Chowdhury, Assistant Professor (Medicine) (In Situ), Cumilla Sadar South Health Complex, Cumilla, Bangladesh.
Received: 08 Augusts 2025; Accepted: 12 August 2025; Published: 16 September 2025
Article Information
Citation: Muhammed Raihan Chowdhury, SM Kamrul Hoque, Mohammad Abu Hanif Chowdhury, Istiak Ahmed, Sujat Paul, Asok Kumar Dutta. Assessment of Nutritional Status and Functional Capacity among Geriatric Population of Rural and Urban Area of Chattogram District of Bangladesh. Archives of Internal Medicine Research. 8 (2025): 285-295.
View / Download Pdf Share at FacebookAbstract
Background:
Bangladesh like many developing countries around the world is experiencing population ageing. There is inadequate information regarding the prevalence of malnutrition and functional dependency in rural compared to urban areas and its associated factors of community-living older (Geriatric) residents in this country.
Objectives:
The aim of this study was to determine the nutritional status and functional capacity of the geriatric population of rural and urban area of Chattogram District of Bangladesh and to search its associated factors.
Methods:
This community based cross-sectional comparative study was carried out under the supervision of Department of Medicine, Chittagong Medical College Hospital from October 2018 to September 2019. Through a multistage random sampling subjects aged 60 years and over from two upazila of Chattogram district (213 subjects living in a rural area) and from two wards of Chattogram city (203 subjects living in urban area) were included. Socio-demographic and clinical data were collected using a pretested structured questionnaire, nutritional status was assessed with Mini Nutritional Assessment- Short Form (MNA-SF) tool and functional assessment was done using the Modified Barthel self-care index (BSI). Statistical analysis was performed using SPSS (Version 23.0 for Windows).
Results:
In the rural sample, 51.6 % was female and the mean age was 66.12±6.52 years. In the urban sample, 36 % were female and the mean age was 66.29±4.79 years. Rural participants compared with urban had a lower level of education and income. Among elderly, living in the rural sample, 29.1% was malnourished while the proportion was 6.4% in the urban sample. Proportion of subjects was fully independent in performing their daily activities was 56.3% and 80.0% respectively in rural and urban sample (p<0.001). About 44% of the rural people need help to perform their daily activities while the proportion was 20% in urban sample. Age >70 years, low socio-economic status and presence of multimorbidity appeared to be independently associated with poor nutritional status and low functional capacity.
Conclusion:
Rural older individuals living in Chattogram district were more likely to be malnourished than urban older and had associated reductions in functional capacity and independence.
Keywords
<p>Nutritional Status; Functional Capacity; Geriatric Population; Bangladesh</p>
Article Details
Introduction
Ageing is an ongoing physiological process. In recent year due to remarkable advances in the medical science and improvement in socioeconomic condition and primary health care service, the life expectancy is dramatically increasing whole over the world. It is commonly believed that the world’s largest proportion of older people live in high-income countries today. However, sixty percent (279 million) of the world’s older population currently live in low-income countries, and this figure will increase to 71% (690 million) by 2030 [1]. In terms of regions, over half of the world’s older population is living in Asia and it is projected that the figure will increase over the next two decades [2]. Data from the UN’s “2019 Revesion of World Population Prospects” shows that Bangladesh’s population of people aged over 60 years is projected to double, from 12.62 million in2019 to 25.24 million in 2035 and expected to more than triple in number in 2050 reaching around 42.1million. So, we can easily assume that if the problems of the elderly will not solved it will be a great burden for the country. Considering all these measuring indicators, the ageing of population is becoming a grave concern. Malnutrition increases the risk of premature death, increased number of hospitalizations, loss of physical functional capacity, depression, worsening quality of life, more complex clinical management, increased health care costs translating into a substantial economic burden for health systems. The older persons in Bangladesh are passing their days within the soft care and support mostly provided by their extended families without any remarkable backing from the national level. But the situation is in transition as the family pattern gradually shifting towards the nuclear type due to the change in standard, migratory tendency of their offspring and poverty. The only support to the older persons in a large scale and nationwide from the Government is the provision of Old age allowance [3]. There is no comprehensive health policy for the elderly in Bangladesh and geriatric problems are ignored in medical education and profession. There is a lack of information and research on elderly in health sector. But there is scope for improving health and nutritional problems of the elderly people. Older people, especially in rural areas, are vulnerable in health status and access to health services. People in rural area of Bangladesh having different living conditions may have different views of their health in daily life from urban people. Research shows that the healthcare needs of individuals living in rural areas are different from those in urban areas. Rural areas often suffer from a lack of access to healthcare. The Mini Nutritional Assessment Short form (MNA-Sf) is the most validated and accepted screening tool for geriatric patients, no matter the setting, with clearly defined thresholds. It is the most efficient, simple and appropriate nutritional assessment tool for older people [4]. The Modified Barthel self-care index (BSI) is proposed as the standard index for clinical and research purposes [5] and it has proved to be a good predictor of morbidity [6]. It is found useful for evaluating the functional ability of elderly people being treated in outpatient care or at the community level [7]. Information of the nutritional status of older persons in low to middle income countries such as Bangladesh is not adequate and well documented [2]. Research and public health activities in Bangladesh have so far focused largely on nutritional aspects related to children and women of reproductive age [7,8,9]. The present study aimed to inform about the magnitude of malnutrition and functional capacity of the elderly population living in rural and urban area in Chattogram District of Bangladesh.
Materials and Methods
Type of study: Community based Cross Sectional comparative study.
Period of study: October 2018 to September 2019.
Place of study: This study was carried out under the supervision of Department of Medicine, Chittagong Medical College Hospital, in some selected rural and urban areas of Chattogram District of Bangladesh.
Study population: All Geriatric population (60 years or above, those who fulfill the inclusion criteria) living in the selected areas of Chattogram District of Bangladesh during study period were the study population.
Sample size:
To estimate the prevalence following formula was used to determine the sample size:

A total of 217 geriatric people from rural areas and 203 geriatric people from urban areas were interviewed for the study.
Eligibility criteria:
Inclusion criteria: Patients were included if
- Age 60 years, or above of both sexes.
- Have been residing in the area for a minimum period of six months.
Exclusion criteria:
- Refused to give the consent.
- Seriously ill, Having malignancy and bedridden person.
Procedure of collecting data: After getting approval from Ethical and Review Committee of CMC, study site were selected through multi stage sampling (described earlier). Informed written consent was obtained from each eligible subject after full explanation of the ultimate outcome, complications and purpose of the study. Data were collected by face to face interview of the respondents with the help of a pretested semi-structured interview schedule. There were two parts; questions related to socio demographic characteristics and questions related to economic status. Two tools were used, one is MNA tool to obtain nutritional status and another one is modified BSI tool for functional assessment. Responses were accepted from close family members of the same household if subjects could not respond accurately as a result of cognitive impairment. Information about underlying diseases were obtained from the patients’ medical records. We used simple language and local language that could be understood by individuals without any prior medical knowledge (Have you ever been diagnosed by a physician with...?). Newly diagnosed cases of malnutrition and disability were referred to a Upazila Health complex in rural areas and to Medical College in urban areas for further investigations and management.
Data analysis: After collection, data were entered into Microsoft Xcel data sheet to produce a master sheet. Then they were fed into SPSS (Statistical Package for Social Science) for Windows version 23 software for the processing and analyses. Continuous variables were reported as means and standard deviation and categorical variables were reported as count and percentages. We used chi-square tests to assess bivariate associations between categorical variables and independent sample t test to test the difference between two means. Binary logistic regression analysis was performed to identify independent variables associated with malnutrition; odds-ratios with 95% confidence intervals were calculated. for binary logistic regression analysis the MNA variable was dichotomized: ‘malnutrition’ was collapsed with ‘at risk of malnutrition’ to identify people in ‘poor nutritional status’ versus those with a ‘satisfactory nutritional status. Pearson’s correlation coefficients were performed for linear relations between total MNA scores and BSI. Statistical significance was defined as P < 0.05 and confidence interval set at 95% level.
Results and observations
Table 1: Age and sex distribution of the elderly subjects by their residence.
|
Variables |
Total |
Rural |
Urban |
P value |
|
|
(n=416) |
(n=213) |
(n=203) |
|||
|
Age |
|||||
|
60-64 years |
160 (38.5%) |
93 (43.7%) |
67 (33.0%) |
||
|
65-70 years |
138 (33.2%) |
55 (25.8%) |
83 (40.9%) |
||
|
71-74 years |
83 (20.0%) |
45 (21.1%) |
38 (18.7%) |
0.004* |
|
|
75-80 years |
21 (5.0%) |
9 (4.2%) |
12 (5.9%) |
||
|
>80 years |
14 (3.4%) |
11 (4.2%) |
3 (1.5%) |
||
|
Mean ± SD |
66.20±5.72 |
66.12±6.52 |
66.29±4.79 |
0.767† |
|
|
Range |
60-95 |
60-95 |
60-80 |
||
|
Sex |
|||||
|
Male |
233 (56.0%) |
103 (48.4%) |
130 (64.0%) |
0.001* |
|
|
female |
183 (44.0%) |
110 (51.6%) |
73 (36.0%) |
||
Data are expressed as frequency (percentage) if not otherwise mentioned. *p value reached from Chi-square test; †p value reached from independent sample t test.
Table 1 shows that, the overall mean age of the studied subjects were 66.20 (±5.72) years without any significant rural urban differences (p = 0.767). However, majority (43.7%) of the rural patients was from age group 60-64 years and in urban population it was 65-70 years age group (40.9%). In rural sample there was female predominance and in urban sample there was male predominance.
Table 2: Social characteristics of the elderly subjects by their residential status.
|
Variables |
Total |
Rural |
Urban |
P value |
||
|
Religion |
||||||
|
Muslim |
312 (75.0%) |
160 (75.1%) |
152 (74.9%) |
|||
|
Sonaton |
92 (22.1%) |
49 (23.0%) |
43 (21.2%) |
0.487* |
||
|
Bhuddist |
12 (2.9%) |
4 (1.9%) |
8 (3.9%) |
|||
|
Education |
||||||
|
Illiterate |
172 (41.3%) |
118 (55.4%) |
54 (26.6%) |
<0.001* |
||
|
Literate |
244 (58.7%) |
95 (44.6%) |
149 (73.4%) |
|||
|
Marital status |
||||||
|
Partnered |
361 (86.8%) |
180 (84.5%) |
181 (89.2%) |
0.110* |
||
|
Single |
55 (13.2%) |
33 (15.5%) |
22 (10.8%) |
|||
|
family type |
||||||
|
Nuclear |
215 (51.7%) |
54 (25.4%) |
161 (79.3%) |
<0.001* |
||
|
Joint |
201 (48.3%) |
159 (74.6%) |
42 (20.7%) |
Data are expressed as frequency (percentage); *p values are reached from Chi-square test
In terms of marital status and religion both rural and urban elderly population were similar. Overall, there was Muslim predominance and 55 (13.2%) of them were single (divorced, widowed or unmarried). Regarding educational qualification literacy rate was significantly higher in urban group in comparison to rural group (p<0.001). In urban areas majorities lived in nuclear (or Extended) family in contrast to rural area where majority lived in joint family (table-2).
Table 3: Economic characteristics of the elderly subjects by their residential status.
|
Variables |
Total |
Rural |
Urban |
P value |
||
|
Vocational status |
||||||
|
Working |
105 (25.2%) |
38 (17.8%) |
67 (33.0%) |
<0.001* |
||
|
Not working |
311 (74.8%) |
175 (82.2%) |
136 (67.0%) |
|||
|
Socio-economic status |
||||||
|
Upper |
8 (1.9%) |
2 (0.9%) |
6 (3.0%) |
|||
|
Upper middle |
54 (13.0%) |
10 (4.7%) |
44 (21.7%) |
<0.001* |
||
|
Lower middle |
88 (21.2%) |
29 (13.6%) |
59 (29.1%) |
|||
|
Upper lower |
184 (44.2%) |
109 (51.2%) |
75 (36.9%) |
|||
|
Lower |
82 (19.7%) |
63 (29.6%) |
19 (9.4%) |
|||
|
Economic dependency |
||||||
|
Independent |
90 (21.6%) |
30 (14.1%) |
60 (29.6%) |
|||
|
Partly dependent |
45 (10.8%) |
24 (11.3%) |
21 (10.3%) |
0.001* |
||
|
fully dependent |
281 (67.5%) |
159 (74.6%) |
122 (60.1%) |
Data are expressed as frequency (percentage); *p values are reached from Chi-square test
There were significant rural urban differences in socio-economic status, present vocational status and economic dependency in the studied population (table 3). Higher number of rural population was from upper lower or lower class compared to urban counterpart. Similarly economic dependency was found more among rural population and comparatively higher number of urban elderly working at the time of data collection.
Table 4: Co morbidity of the elderly subjects by their residential status.
|
Co morbidity |
Total |
Rural |
Urban |
P value* |
||
|
No co morbidity |
24 (5.8%) |
10 (4.7%) |
14 (6.9%) |
0.336 |
||
|
HTN |
164 (39.4%) |
98 (46.0%) |
66 (32.5%) |
0.005 |
||
|
DM |
127 (30.5%) |
65 (30.5%) |
62 (30.5%) |
0.996 |
||
|
Visual disturbance |
113 (27.2%) |
84 (39.4%) |
29 (14.3%) |
<0.001 |
||
|
Arthritis |
91 (21.9%) |
62 (29.1%) |
29 (14.3%) |
<0.001 |
||
|
CLBP |
56 (13.5%) |
30 (14.1%) |
26 (12.8%) |
0.703 |
||
|
IHD |
41 (9.9%) |
19 (8.9%) |
22 (10.8%) |
0.512 |
||
|
HI |
40 (9.6%) |
30 (14.1%) |
10 (4.9%) |
0.002 |
||
|
COPD |
38 (9.1%) |
26 (12.2%) |
12 (5.9%) |
0.026 |
||
|
CVA |
27 (6.5%) |
16 (7.5%) |
11 (5.4%) |
0.388 |
||
|
Anaemia |
20 (4.8%) |
14 (6.6%) |
6 (3.0%) |
0.103 |
||
|
Dyslipidemia |
17 (4.1%) |
2 (0.9%) |
15 (7.4%) |
0.001 |
||
|
Dementia |
16 (3.8%) |
11 (5.2%) |
5 (2.5%) |
0.152 |
||
|
Asthma |
16 (3.8%) |
8 (3.8%) |
8 (3.9%) |
0.922 |
||
|
Osteoporesis |
15 (3.6%) |
12 (5.6%) |
3 (1.5%) |
0.023 |
||
|
CKD |
12 (2.9%) |
5 (2.3%) |
7 (3.4%) |
0.503 |
||
|
BEP |
3 (0.7%) |
1 (0.5%) |
2 (1.0%) |
0.615 |
Data are expressed as frequency (percentage); *p values are reached from either Chi-square test or fisher’s Exact test; HI: Hearing impairment; CLBP: Chronic low back pain.
Most prevalent self-reported co-morbid illness among the elderly population were HTN (39.4%) followed by DM (30.5%), visual disturbance (27.2%), arthritis (21.9%), CLBP (13.5%) and IHD (9.1%). HTN, arthritis, visual disturbance, hearing impairment, COPD and osteoarthritis were significantly more prevalent among rural elderly compared to urban. In contrast dyslipidemia was more prevalent among urban elderly compared to rural (table-4).
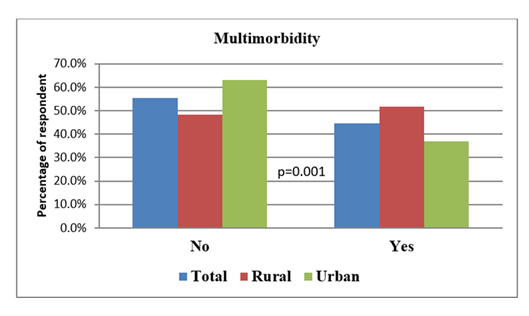
Multimorbidity (presence of 2 or more chronic health conditions) was more prevalent among rural elderly than urban elderly. Out of 416 population 185 (44.5%) had multimorbidity. Among 213 rural elderly 110 (51.6%) had multimorbidity compared to 75 (36.9%) of the urban elderly (figure 1).
Table 5: Comparison of MNA and BSI between rural and urban elderly population.
|
Tool |
Group |
n |
Mean ±SD |
Range |
P value* |
|
MNA |
Rural |
213 |
8.65±2.21 |
Apr-14 |
<0.001 |
|
Urban |
203 |
11.07±2.45 |
Apr-14 |
||
|
BSI |
Rural |
213 |
16.13±3.69 |
Jul-20 |
<0.001 |
|
Urban |
203 |
17.83±3.11 |
Sep-20 |
*P values were reached from independent sample t test.
In the study nutritional status was assessed by MNA tool. Lower score indicates poor nutritional status. Mean MNA score was significantly lower among rural elderly compared to urban elderly. Similarly mean BSI score, which indicate the functional dependency for activities of daily living was significantly lower among rural elderly compared to their urban counterpart (table-5).
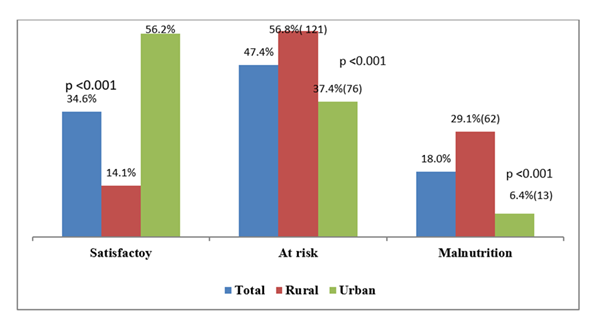
Overall, out of 416 elderly subjects included in the study 144 (34.6%) had satisfactory nutritional status, 197 (47.4%) were at risk of malnutrition and 75 (18.0%) were malnourished by MNA tool. At risk of malnutrition were significantly more among rural compared to urban subjects [121(56.8%) versus 76(37.4%) in rural and urban respectively]. Similarly, prevalence of malnutrition was also significantly more among rural subjects than urban subjects [62(29.1%) versus 13(6.4%) in rural and urban respectively] (fig-2).
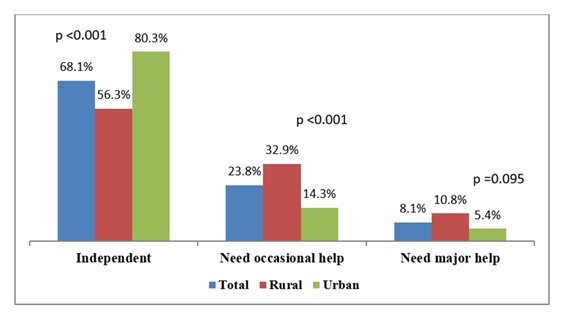
Overall, out of 416 elderly subjects included in the study 283 (68.1%) were independent in performing their daily activities as assessed by BSI tool. 99 (23.8%) need occasional help and 34 (8.1%) need major help for the same purpose. Significantly rural elderly need more occasional help than their counterpart [70(32.9%) versus 29(14.8%) in rural and urban respectively]. Likewise, functional independency was more prevalent among urban than rural elderly [163(80.3%) versus 120(56%) in urban and rural subjects respectively] (fig-3).
Table 6: factors associated with poor nutritional status in total, rural and urban elderly subjects: binary logistic regression analysis
|
Variables |
Total (n=416) |
Rural (n=213) |
Urban (n=203) |
|||
|
OR |
P value |
OR |
P value |
OR |
P value |
|
|
Age >70 years |
3.05 |
0.001 |
1.9 |
0.365 |
5.44 |
0 |
|
female sex |
0.93 |
0.801 |
0.75 |
0.611 |
1.17 |
0.683 |
|
Joint family |
1.35 |
0.198 |
0.2 |
0.041 |
0.28 |
0.004 |
|
Single |
1.38 |
0.461 |
1.11 |
0.998 |
0.84 |
0.772 |
|
Illiterate |
1.47 |
0.175 |
1.36 |
0.552 |
1.18 |
0.685 |
|
Not working |
0.73 |
0.457 |
1.19 |
0.841 |
0.54 |
0.244 |
|
Lower SES |
3.15 |
0 |
1.11 |
0.853 |
3.02 |
0.003 |
|
Partially dependent |
1.1 |
0.839 |
1.3 |
0.767 |
0.83 |
0.771 |
|
fully dependent |
1.11 |
0.802 |
1.51 |
0.662 |
0.73 |
0.596 |
|
Had multimorbidity |
1.89 |
0.009 |
1.58 |
0.322 |
1.72 |
0.128 |
OR: Odds ratio,SES- Socioeconomic status.
In whole sample (416), age >70 years, lower socio-economic status and presence of multimorbidity remained significantly associated with poor nutritional status in binary logistic regression after controlling other factors. In rural sample only joint family remained significantly associated with poor nutritional status after controlling for other factors. In urban sample in addition to joint family age >70 years and lower socio-economic status remained significantly associated with poor nutritional status after controlling for other factors (table 6).
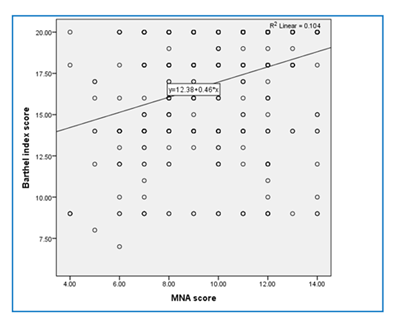
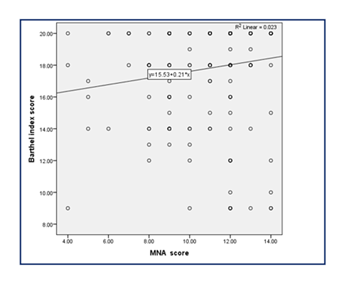
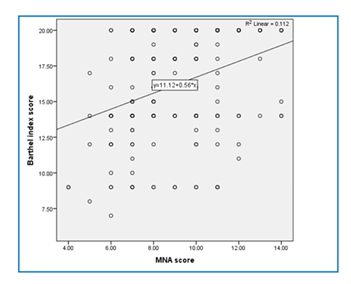
In the study among the 416 elderly subjects MNA score are positively correlated with the BSI score indicating that as the nutritional status increased the risk of functional dependency also declined [r=0.322; p= <0.001] (figure 4). The correlation between MNA and BSI were examined separately among rural and urban sample (figure 5 & figure 6). In both sample there was significant positive correlation, but the strength of correlation was more in rural compared to urban sample (r=0.324 versus r=0.150).
Discussion
This is the first study to best of our knowledge that has comprehensively evaluated and compared the socio-demographic characteristics, nutritional and functional status of community-dwelling older men and women in rural and urban areas of Chattogram District of Bangladesh. The frequency of poor nutritional status in elderly subjects living at home was estimated in two distinct samples and showed marked differences. The rural compared to urban participants in this study had poor nutritional status and more functional dependency for the activities of daily living. The prevalence of poor nutrition (both malnutrition and at risk of malnutrition) as assessed by MNA among community-dwelling older people in this study was comparable to findings from other developing countries such as India, Iran and Indonesia [10,11,12,13], but significantly higher than those from more developed countries such as Japan, Taiwan, Poland and france [14,15,16,17]. Although the definition of malnutrition varies across studies, our results were similar to other studies in the community with a prevalence ranging from 7% to 17% [18,19]. Notably the nutritional status of our rural sample was comparable to another study conducted in rural area of Sylhet of Bangladesh [20]. The proportion of well-nourished, at risk of malnutrition and malnourished among their community-dweller elderly people was 12.5%, 61.7% and 25.8% respectively which is nearly similar to our results. The mean MNA score is significantly lower in rural than that of the urban subjects. Similarly, Arjuna et al., [13] also observed such rural urban differences in their study population (24.5±3.5 and 23.3±3.9 respectively for urban and rural). In that study by Arjuna et al [13] rural compared with urban participants had poorer nutritional status according to MNA tool (3% versus 6% malnourished, and 73% vs. 44% at risk of malnutrition, p<0.001). Similar pattern were also observed in study conducted in Indian and Taiwan Mathew yet al [10]; Vedantam et al.,[11]; Chen et al.,[14]. Our results are in agreement with these studies. In contrast to the findings of the present study and the just mentioned study conducted in Asia, a french study of 692 rural and 8691 urban-based older people reported that undernutrition was more prevalent in the urban than rural areas (7.4% vs. 18.5%) [17]. The lower prevalence observed in that study might be explained by the fact that their subjects were younger and had a higher BMI. The other objective of our study was to estimate and compare functional status in rural and urban areas. In this study 8.1% of the total elderly need major help in performing their daily activities which is almost similar to a study conducted in our country in rural area where only 7% reported limitations in ADL [21]. The frequency of functionally independent people appeared to be significantly more in the urban sample than the rural sample. This might be explained by the fact that, there was a positive correlation between MNA and BSI tool as a whole and in rural and urban sample separately. These indicate that as the nutritional status decreased functional capacity also declined proportionately. Malnutrition has previously been associated with poor functional status. MNA-Sf is also a tool capable of predicting functional disability in the elderly. A low MNA-Sf score has also been related to incident disability in older adults [22]. Moreover, malnutrition identified by the MNA and MNA-Sf has been associated with functional status in hospitalized elderly persons [23]. High prevalence of malnutrition among elders of poor socioeconomic status was reported in some earlier studies [10,17,21,14]. This could be attributed to the fact that socioeconomic conditions influence dietary choices and eating patterns thereby affecting the nutritional status. We also observed that elderly who had multimorbidity were higher likelihood of being malnourished than who had not. This may also attribute to the practical difficulties that influence their dietary choices and eating patterns. Regarding independent factors associated with nutritional status some rural urban differences were observed in the present study. Both in urban and rural sample family type were found to an independent predictor of poor nutrition. Elderly who lived in nuclear family were more likely to be malnourished compared to the elderly lived in joint family. Moreover, age and socioeconomic status were found to significantly associated with nutritional status in urban sample but not in rural sample. This paper has contributed to the advancement of knowledge on the nutritional issues for elderly population from the perspective of developing countries. The key factors influencing the prevalence of malnutrition and functional dependency among elderly people living in urban and rural areas have been identified. Our study findings could be used to make policy/research/education in geriatric age group considering difference between rural and urban groups. Health professionals should take time and pay attention to helping older people to adopt healthy eating practices, especially those living in rural areas. Easy, practical and accessible programmes are needed to help older adults to become aware of their nutritional health.
Conclusion
In conclusion, poor nutritional status was not uncommon in elderly people living at home in rural or urban areas in Chattogram District of Bangladesh. Rural, when compared to urban were more likely to be malnourished and functionally dependent. Higher age, low socio-economic status and multimorbidity were found to be independent factors for poor nutritional status. Moreover, few rural–urban variations exist in factors associated with nutritional status and chronic conditions. Understanding these rural–urban health disparities may help in developing better strategies to improve health of geriatric peoples in rural and urban areas.
Limitations
- Caution should be exercised in generalizing our study’s findings due to inclusion of the subjects from a single district of the southeastern part of Bangladesh.
- The sample size used in our study was relatively small.
- We couldn’t take data from elderly people who didn’t come to medical camp.
- Our data collection was dependent on the response of individual person and their relatives. This could have led to both under and over reporting of some factors and comorbidity.
Recommendations
Health professional (Doctor, registered nurses, medical assistant etc.) should monitor the nutritional status of the elderly patients in order to participate in the reduction of the prevalence of malnutrition and its consequences. Strategies to increase both health-professional and public awareness of the nutritional and functional issues facing community dwelling older individuals and the development of targeted interventions to improve nutritional status and functional capacity are therefore important for the health and wellbeing of older. There is also have scope to do more research on geriatric nutritional status and functional capacity among wide range of areas.
References
- Kinsella, K., and Phillips, D.R. (2005) Global aging: The challenge of success. Population Bulletin, 60. (Online) Available from: https://www.prb.org/globalagi ngthechallengeo fsuccesspdf 575kb/.
- World Health Organization, Active ageing: A policy framework. 2002, Noncommunicable disease prevention and health promotion department, World Health Organization Geneva. [Online] Available from: https://www.who.int/ageing/publications/active_ageing/en/.
- Blazer, D. G., Landerman, L. R., fillenbaum, G., et al. Health services access and use among older adults in North Carolina: urban vs rural residents. American Journal of Public Health, 85 (1995): 1384-1390.
- Secher, M., Soto, M. E., Villars, H., et al. The Mini Nutritional Assessment (MNA) after 20 years of research and clinical practice. Reviews in Clinical Gerontology, 17 (2007): 293.
- Wade, D.T., and Collin, C. ‘The Barthel ADL Index: a standard measure of physical disability?’ International Disability Studies 10 (1998): 64–67.
- Supervia, A., Aranda, D., Marquez, M. A., et al. Predicting length of hospitalisation of elderly patients, using the Barthel Index. Age and Ageing, 37 (2008), 339–342.
- Pryer, J. A., Rogers, S., & Rahman, A. The epidemiology of good nutritional status among children from a population with a high prevalence of malnutrition. Public Health Nutrition, 7 (2004).
- Islam, M. Z., Lamberg-Allardt, C., Kärkkäinen, M., et al. Dietary calcium intake in premenopausal Bangladeshi women: do socio-economic or physiological factors play a role? European Journal of Clinical Nutrition 57 (2003): 674-680.
- Zahangir, M.S., Hasan, M.M., Richardson, A., et al. Malnutrition and non-communicable diseases among Bangladeshi women: an urban–rural comparison 1 Nutrition & Diabetes, 7 (2017): e250.
- Mathew, A.C., Das, D., Sampath, S., et al. Prevalence and correlates of malnutrition among elderly in an urban area in Coimbatore. Indian J Public Health, 60 (2016): 112-117.
- Vedantam, A., Subramanian, V., Vijay Rao, et al. Malnutrition in free-living elderly in rural south India: Prevalence and risk factors. Public Health Nutr 13 (2010): 1328-1332.
- Aliabadi, M., Kimiagar, M., Ghayour-Mobarhan, M., et al. Prevalence of malnutrition in free living elderly people in iran: A cross-sectional study. Asia Pac. J. Clin. Nutr, 17 (2008): 285-289.
- Arjuna, T., Soenen, S., Hasnawati, R., et al. A Cross-Sectional Study of Nutrient Intake and Health Status among Older Adults in Yogyakarta Indonesia. Nutrients 9 (2017): 1240.
- Chen, C. C.-H., Schilling, L. S., & Lyder, C. H. A concept analysis of malnutrition in the elderly. Journal of Advanced Nursing, 36 (2001): 131-142.
- Iizaka, S., Tadaka, E., & Sanada, H. Comprehensive assessment of nutritional status and associated factors in the healthy, community-dwelling elderly. Geriatrics & Gerontology International, 8 (2008): 24–31.
- Kostka, J., Borowiak, E., & Kostka. Nutritional status and quality of life in different populations of older people in Poland. European Journal of Clinical Nutrition, 68 (2014): 1210–1215.
- Torres, M.J., Dorigny, B., Kuhn, M., et al. Nutritional Status in Community-Dwelling Elderly in france in Urban and Rural Areas. PLoS ONE 9 (2014): e105137.
- Johansson, L., Sidenvall, B., Malmberg, B., et al. Who will become malnourished? A prospective study of factors associated with malnutrition in older persons living at home. J Nutr Health Aging 13 (2009): 855-861.
- Johansson, Y., Bachrach-Lindstrom, M., Carstensen, J. Malnutrition in a home-living older population: prevalence, incidence and risk factors. A prospective study. J Clin Nurs 18 (2009): 1354-1364.
- Kabir, Z.N., ferdous, T., Cederholm, T., et al. Mini Nutritional Assessment of rural elderly people in Bangladesh: the impact of demographic, socio-economic and health factors. Public Health Nutrition: 9 (2006): 968-974
- ferdous, T. (2009). Determinants and functional Impact of Nutritional Status Among Older Persons in Rural Bangladesh (PhD dissertation). Acta Universitatis Upsaliensis, Uppsala. Retrieved from http://urn.kb.se/resolve?urn=urn:nbn: -107369
- Martinez-Reig, M., Gomez-Arnedo, L., Alfonso-Silguero, S. A., et al. Nutritional risk, nutritional status and incident disability in older adults. The fRADEA Study. The Journal of Nutrition, Health & Aging, 18 (2013): 270-276.
- Villafañe, J. H., Pirali, C., Dughi, S., et al. Association between malnutrition and Barthel Index in a cohort of hospitalized older adults article information. Journal of physical therapy science, 28 (2016), 607–612.


 Impact Factor: * 3.6
 Acceptance Rate: 78.21%
  Time to first decision: 10.4 days
  Time from article received to acceptance: 2-3 weeks