Cell Type Classification and Discovery across Diseases, Technologies and Tissues Reveals Conserved Gene Signatures of Immune Phenotypes
Mathew Chamberlain1, Nima Nouri1, Andre Kurlovs1, Richa Hanamsagar1, Frank O. Nestle2, Emanuele de Rinaldis1, Virginia Savova1*
1Precision Medicine and Computational Biology, Sanofi, 270 Albany Street, Cambridge, MA, 02139, USA
2Sanofi Research and Development, Cambridge, MA 02139, USA
*Corresponding author: Virginia Savova, Precision Medicine and Computational Biology, Sanofi, 270 Albany Street, Cambridge, MA, 02139, USA
Received: 24 June 2023; Accepted: 1 July 2023; Published: 13 July 2023
Article Information
Citation: Mathew Chamberlain, Nima Nouri, Andre Kurlovs, Richa Hanamsagar, Frank O. Nestle, Emanuele de Rinaldis, Virginia Savova. Cell Type Classification and Discovery across Diseases, Technologies and Tissues Reveals Conserved Gene Signatures of Immune Phenotypes. Journal of Bioinformatics and Systems Biology. 6 (2023): 152-177.
View / Download Pdf Share at FacebookAbstract
The classification of immune cell phenotypes in single cell data is a major challenge in biology research today. Here, we present a novel machine learning approach, SignacX, which uses neural networks trained with flowsorted gene expression data to classify immune cellular phenotypes in single cell RNA-sequencing data. We demonstrate that SignacX accurately classified single cell RNA-sequencing data across diseases, technologies, species, and tissues, and outperformed other leading methods in immune phenotype classification, particularly for classification of CD8 and CD4 T cell subsets. We used the annotations generated by SignacX to identify conserved and tissue-specific gene expression-based signatures of immune cell types. Next, we defined immune-relevant precision medicine candidate drug targets in rheumatoid arthritis using single cell data from human synovium. A full release of this workflow together with detailed vignettes, an interactive data portal and freely accessible software that is integrated with Seurat and is easy to use can be found at our GitHub repository (https://github.com/Sanofi-Public/PMCB-SignacX).
Keywords
<p>Machine learning, Disease, Autoimmune, Single cell RNAsequencing, Drug discovery</p>
Article Details
1. Introduction
Single-cell technologies are now main stream in disease research due to their ability to identify cellular phenotypes in diseased tissue with single cell resolution [1]. However, cellular phenotypes are not identified from single cell data alone [2]. Instead, single-cell data analysis is typically a labor-intensive, project-specific and subjective process, such that two groups observing the same data will often arrive at a different set of conclusions [3]. The key analytical challenges of single-cell data analysis are how to map single-cell observations to known immune phenotypes in a consistent fashion independent of the scientist interpreting the experiment and how to efficiently identify conserved gene markers of known immune phenotypes. There are existing tools that can label immune phenotypes in single cell data in some circumstances, like Azimuth, symphony and scVI, which seem to perform well when there are single cell reference data derived from the same tissue as the query data [4–6]. However, in many cases we do not have reference data for annotating new single-cell data. For example, the peripheral blood mononuclear cell (PBMCs) classifier published with Azimuth cannot classify cells in other organ systems, like nonimmune cells or macrophages, without additional organ-specific training [6]. Furthermore, since the cell type composition of single-cell experiments varies with different technologies, each reference mapping approach exhibits technology-specific bias in classification (they perform best on single cell data derived from the technology on which they were trained) [3]. Another challenging aspect of these tools is that they are limited to the degree of annotation of the reference data, which is typically determined manually by studying gene expression patterns. Since cells can have similar transcriptional patterns and diverse functions (e.g., T cell subsets), these populations have historically been defined using flow cytometry with functional validation. Ideally, we need a solution that annotates cells from any tissue or technology, without technology-specific bias, and using as reference data populations of cells that were sorted with flow cytometry together with functional validation to create a consistent labeling of single cell identities across diseases, tissues and technologies. In this study, we filled this gap by developing a robust, efficient, and scalable machine learning algorithm, SignacX, which (a) accurately and consistently maps single-cell identities to a detailed hierarchy of known immune phenotypes that were established with flow cytometry;
(b) identifies novel cell populations and (c) surfaces conserved gene expression-based signatures of immune phenotypes from single cell data. Overall, our approach produces a consistent labeling of cellular phenotypes in scRNA-seq data that allows for the study of immune cells across diseases, technologies, species and tissues with a consistent labeling hierarchy [7]. Our approach differs from other methods as it can reliably classify single cell data from any technology or tissue without any tissue- or technology-specific training [3], it was validated with CITE-seq and with flow cytometry data, and successfully differentiated cell types that were highly similar to each other, like T cell subsets (a known limitation of other methods) [3,8]. To demonstrate this idea, we used our tool to classify non-human data to help study under-represented model organisms that lack sufficient reference data [3,8], and integrated our software with popular software packages SPRING and Seurat for ease of use [7,9]. Our method is the first hierarchical ensemble of neural network-based classifiers that was trained with bulk sorted reference data to classify single cell data. To summarize, its detailed immunological classification and its robustness to diverse tissues and technologies make our algorithm unique among existing solutions.
2. Results
2.1 Overview of the SignacX approach for immune cell identification
To annotate cellular phenotypes in single-cell transcriptomic data, we developed a novel approach, SignacX, which used machine learning to classify each cell in unlabeled scRNA-seq data according to a detailed hierarchy of immune phenotypes (Figure. 1A-B). Our approach is based on an ensemble of neural network classifiers that were trained on a reference dataset of gene expression profiles for purified, sorted cell types generated by the Human Primary Cell Atlas (HPCA; see Methods: Overview of the SignacX approach) [10]. First, we identified gene markers that distinguished each level of the cell type hierarchy (Figure. 1A) by performing differential gene expression analysis with the HPCA data and by performing meta- analysis of previously established gene markers (Supplemental Figure 1; see Methods: Establishing the HPCA reference data for training SignacX; Supplemental Dataset 2) [10–12]. This established a set of gene markers, but it left open the question of how to use them to classify cells in scRNA-seq data. We reasoned that this task could be accomplished with machine learning [13]. However, the HPCA data contains as few as two samples for each sorted cell type population (Supplemental Figure 1), which is too few to use as training data for a classifier. To help solve this problem, we bootstrapped and added noise to each pure cell type category in the HPCA reference data, and thus created a large and diverse training data set of many (n = 1,000) bootstrapped samples of each pure cell type, and then we used the bootstrapped data to train an ensemble of n = 100 neural network classifiers to make cell type classifications by amending a label to the largest average probability of the ensemble of classifiers (Figure. 1C; see Methods: Establishing a predictive model for cellular phenotypes using the HPCA reference data; for additional details see Methods: Overview of the SignacX approach; Supplemental Figure 1).
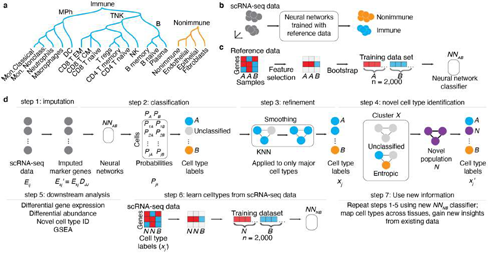
Figure 1: Conceptual overview of the SignacX approach. A, Classification hierarchy. Dendrogram displays the hierarchy of cellular phenotypes that are classified by SignacX: immune (teal) and nonimmune (carrot orange), major immune cell phenotypes (mononuclear phagocytes “MPh”; B cells and T/NK cells) and functional/terminally differentiated cellular phenotypes (rows). B, SignacX conceptual overview (theoretical data). SignacX takes as input scRNA-seq data for which the cellular phenotype is unlabeled (left; n = 10 cell barcodes, grey circles). Next, SignacX applies neural networks trained with pure, sorted reference data which results in labeled scRNA-seq data (teal; immune, carrot orange; nonimmune). The scRNA-seq data represented here are in a dimensionality-reduced plot (axes) where distances correspond to transcriptional similarities between cells (e.g., UMAP, t-SNE or PCA). C, Concept for training neural network classifiers by bootstrapping a reference dataset (theoretical data). Heatmap (left) shows the expression (red indicates high gene expression, blue indicates low gene expression) of genes (n = 3, rows) across samples (n = 3, columns) in theoretical flow-sorted gene expression reference data of two pure cell type populations, A and B. Feature selection (black arrow) identifies a single gene that is correlated with A and B. This marker gene is bootstrapped (black arrow) by resampling from A and B separately, yielding a training data set for that gene, with a balanced number of bootstrapped samples from cell population A (n = 1,000 samples) and B (n = 1,000 samples). Next, neural network classifiers (n = 100) are trained (black arrow) on the training data set, yielding an ensemble of neural network classifiers (NNAB) that can be used to identify cell types A and B. D, Example workflow (theoretical data). SignacX takes as input scRNA-seq expression data (left; expression matrix Eij with i = 1, … , m gene rows and j = 1, … , n cell columns) for which the cell type identity of each cell is unknown (gray circles). In step 1, a subset of the genes is imputed (arrow) using the imputation operator Djj (see Methods: KNN imputation) yielding Ekj′. Next, an ensemble (n = 100) of neural network classifiers (NNAB; black box) are applied to the imputed expression matrix Ekj′, yielding for every cell a set of probabilities (one for each classifier) that the cellular phenotype is either phenotype A (PA) or B (PB). In step 2, these probabilities are then averaged and reported as a single probability, corresponding to the probability matrix Pjk, and then each cell (circle) is amended a label (teal, carrot orange) corresponding to the maximal probability of Pjk. Alternatively, a cell (circle) remains unclassified (light gray circle) if the maximal probability is below a user-set threshold. In step 3, after initial classification of cell types, KNN networks (black lines indicate network edges) are used to correct broad cell type assignments corresponding to immune and nonimmune cells and the first level of the cell type hierarchy (Fig 1A); each cell is assigned to the majority of itself and its first-degree neighbors in KNN networks. Classification continues until the deepest cell types in the hierarchy (Figure 1A), resulting in a vector of cell type labels xj. In step 4, novel cell types are identified using Louvain clustering to identify theoretical Cluster X (3 cells, black box); if cluster X is statistically enriched (two sample t-test, p-val < 0.01) for unclassified cells (top) or exhibits statistically significant normalized Shannon entropy in SignacX labels (bottom), then Cluster X is flagged as a potential novel cellular population “N” (purple), yielding novel cell type labels (right). In step 5, the cell type labels are used for downstream analysis (listed). In step 6, scRNA-seq data is now used as a training data set to learn novel cell types (e.g., Novel population “N”) from scRNA-seq data, by developing neural network models that can distinguish novel cell populations (N) from other cell populations (B). Finally, this new model can be applied to other single cell data sets, yielding new classifications (step 7).
To validate our approach, we generated predictions for flow-sorted gene expression data that were not used in the analysis described above and instead originated from the Encode and Blueprint Epigenomics consortia, which used a different sequencing technology (RNA-seq) than the HPCA data (microarray) [10,14,15]. We observed 100% accuracy in the classification of B-cells, mononuclear phagocytes, neutrophils, CD8 T-cells, CD4 T-cells, NK-cells, plasma cells, T regulatory cells and nonimmune cells, even classifying nonimmune sub-types that were not present in the training data (Supplemental Figure 2; see Methods: SignacX classification). Altogether, this supports the idea that our approach can classify diverse cell types in different data sets, and demonstrates that the neural network models were built with hyperparameters and structure that were cross validated in an unseen data set [10]. However, single-cell data are distinct in many ways from the HPCA, Blueprint and Encode data described above [10,14,15]. For example, single-cell data are sometimes composed of cell types for which flow-sorted data are unavailable, and may exhibit single cell technology-specific artifacts, like dropouts and doublets [2,4,12,16,17]. To address these concerns, we developed methods for learning gene expression-based representations of cell types from single-cell data, for imputing missing gene expression values, and for leaving cells unclassified if they did not conform to a known cellular phenotype (Figure.1D).
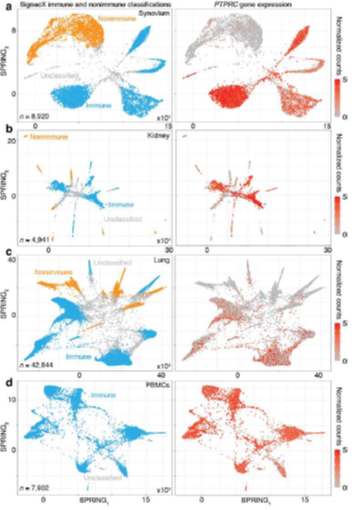
Figure 2: SignacX reliably distinguishes immune and nonimmune cells in peripheral tissues. A, SignacX classifications were consistent with PTPRC expression in CEL-Seq2 data from synovium. Two-dimensional visualization (left; SPRING plots) of single-cell transcriptomes (n = 8,920) in synovium biopsies (n = 26). Each cellular transcriptome (dot) was colored by SignacX classifications; immune (teal), nonimmune (carrot orange) or unclassified (grey) cellular phenotypes. Single-cell gene expression plot (right) for a representative immune cell- type-enriched gene. B, SignacX classifications were consistent with PTPRC expression in CEL-Seq2 data from kidney. See the caption for Figure 2A, except these visualizations correspond to single-cell transcriptomes (n = 4,941) from kidney biopsies (n = 36). C, SignacX classifications were consistent with PTPRC expression in 10X data from lung. See the caption for Figure 2A, except these visualizations correspond to single-cell transcriptomes (n = 42,844) from lung biopsies (n = 18). D, SignacX correctly rejected the nonimmune labels in blood. See the caption for Figure 2A, except these visualizations correspond to single-cell transcriptomes (n = 7,902) from PMBCs (n = 1).
2.2 SignacX reliably distinguishes immune cells from non-immune cells in a variety of peripheral tissues
A fundamental requirement of automated immune cell type classification is the ability to distinguish immune cells from the cells of the host tissue at the infiltration site. Our approach succeeded in separating immune from nonimmune cells in data from three mixed tissue experiments deriving cells from human kidney, synovium, and lung (Table 1), generated with either plate-based (Figure. 2A-B) or droplet-based technologies (Figure. 2C). These data were visualized with SPRING, a two-dimensional force-layout embedding that we used for interactive exploration of single-cell gene expression data (see Methods: Single cell data pre-processing) [9,18]. SignacX also correctly rejected the non- immune label in data derived from human peripheral blood mononuclear cells (PBMCs; Figure. 2D) [19], indicating accurate immune and nonimmune cell-classifications in peripheral tissues as well as in blood.
Table 1: Summary of scRNA-seq data used in this study
|
Tissue |
Disease |
Number of cells |
Number of samples |
Source |
Technology |
SignacX version |
|
Kidney |
Cancer |
48,037 |
47 |
20 |
10X v3 |
2.0.7 |
|
Kidney and urine |
LN and healthy |
5,886 |
39 |
21 |
CEL-Seq2 |
2.0.7 |
|
Lung |
Cancer |
42,844 |
18 |
18 |
InDrop |
2.0.7 |
|
Lung |
Fibrosis |
96,461 |
31 |
22 |
10X v3 |
2.0.7 |
|
Lung |
Fibrosis |
1,09,421 |
16 |
23 |
10X v3 |
2.0.7 |
|
Monkey PBMCs |
Healthy |
5,491 |
1 |
24 |
10X v3 |
2.0.7 |
|
Monkey PBMCs |
Healthy |
5,220 |
1 |
24 |
10X v3 |
2.0.7 |
|
Monkey T cells |
Healthy |
5,496 |
1 |
24 |
10X v3 |
2.0.7 |
|
PBMCs |
Cancer |
14,048 |
8 |
18 |
InDrop |
2.0.7 |
|
PBMCs |
Healthy |
7,902 |
1 |
10X Genomics |
CITE-seq |
2.0.7 |
|
PBMCs |
Healthy |
4,784 |
1 |
10 X Genomics |
10X v3 |
2.0. 7 |
|
PBMCs |
Healthy and vaccinated |
10,000 |
8 |
6 |
CITE-seq |
2.0.7 |
|
Skin |
AD |
36,690 |
17 |
25 |
10X v3 |
2.00.07 |
|
Synovium |
RA and OA |
8,920 |
26 |
4 |
CEL-Seq2 |
2.00.07 |
Table 1: Data used in this study. LN: lupus nephritis, RA: rheumatoid arthritis, OA: osteoarthritis, AD: atopic dermatitis, PBMCs: peripheral blood mononuclear cells.
2.3 Benchmarking SignacX with flow cytometry and CITE-seq data
Next, we applied SignacX to annotate deeper cellular phenotypes for the synovium and the PBMCs data introduced above. Unlike typical scRNA-seq data, these data also contained simultaneous protein expression data for each individual cell measured with cellular indexing of transcriptomes and epitopes by sequencing (CITE-seq) for the PBMCs and with flow cytometry for the synovium [4,19]. To validate the cell type classifications generated by SignacX, we determined to what extent SignacX, which uses only transcriptional information, labeled cellular phenotypes that were consistent with the expected lineage-specific protein expression data.
2.4 SignacX accurately classified CITE-seq PBMCs
Using only transcriptional data, SignacX identified several distinct cellular phenotypes in PBMCs that were consistent with the expected protein expression data: CD19+ B-cells, CD19+CD25+ memory B-cells, CD19+CD25-CCR7+ naïve B-cells, CD14++CD16- classical monocytes, CD14+CD16++ nonclassical monocytes, CD3+ T cells, CD45RA+CD4+ naïve T-cells, CD45RO+CD4+ T memory cells, CD4+TIGIT+FOXP3+ T regulatory cells, CD45RO+CD8+ T effector memory cells, CD56+CD3- NK cells, CLEC10A+ dendritic cells (DCs), MZB1+ plasma cells and CD56+CD3- NK cells (Figure. 3A-C; additional examples Supplemental Figure 3). Furthermore, well-known gene markers for these cell types were identified here with an unsupervised and unbiased analysis that identified immune marker genes (IMAGES) from single cell data (see Methods: Identifying IMAGES in scRNA-seq data; Figure. 3B; Supplemental Figure 4). Finally, we performed cluster-based annotation from the antibody-derived tag (ADT) data whenever we could do so unambiguously (6,990/7,865 cells across five categories: B, myeloid, NK, T CD4, and T CD8). We measured both sensitivity (recall) and precision of the SignacX classification in relation to the unambiguous ADT-based annotation. SignacX achieved the average recall of 0.94, the average precision of 0.97, and the overall accuracy of over 0.95 (Supplemental Figure 13). Altogether, this demonstrated that our approach accurately classified cellular phenotypes in PBMCs.
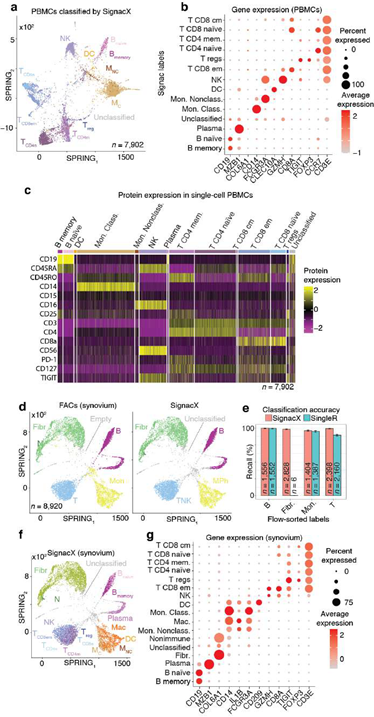
Figure 3: Validating SignacX with single-cell protein expression data from PBMCs and synovium. A, Two dimensional visualization of SignacX-classified CITE-seq PBMCs transcriptomes. SPRING plot visualization as-depicted previously (Figure 2D) except with deeper SignacX annotations for cell types. B, Dot plot of top IMAGES expressed in CITE-seq PBMCs in cellular phenotypes labeled by SignacX. Dot plot shows the percentage (size) of single-cell transcriptomes within a cell type (y-axis) for which non-zero expression of marker genes was observed (x-axis). Color displays the average gene expression (red indicates more expression) in each cell type category. C, Heatmap of protein expression in CITE-seq PBMCs in cellular phenotypes labeled by SignacX. Color shows the scaled protein expression data (rows’ yellow is higher expression; purple is lower expression) across single-cell transcriptomes (columns). Annotation bar indicates the cell type assigned by SignacX (i.e., Figure 3A-B). D, Two-dimensional visualization of synovium single-cell transcriptomes with cell types identified by FACs (left) and SignacX(right). SPRING plot visualization as-depicted previously (Figure 2A) except with cell type labels determined by FACs (left), where each single-cell transcriptome is colored by the label assigned to it with flow cytometry (T cells, teal;fibroblasts, green; empty, grey; B cells, purple and monocytes, yellow). On the right, the same data are plotted the same way, except with labels generated with SignacX. E, Bar plot of SignacX and SingleR performance in cell type classification with synovium. Bar plot shows each flow-sorted cell type category (x-axis), and the performance of SignacX (red) and SingleR (blue) in recalling the flow cytometry labels (error bars correspond to 95% confidence intervals, two-sided binomial test). F, Two-dimensional visualization of synovium single-cell transcriptomes identified by SignacX. G, Dot plot of top IMAGES expressed in single-cell transcriptomes from synovium in cellular phenotypes labeled by SignacX. See caption for Figure. 3B.
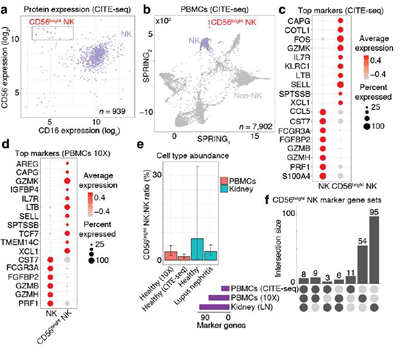
Figure 4: CD56bright NK cells were learned from CITE-seq data and then classified in PBMCs and kidney data. A, Scatter plot of protein expression in CITE-seq data revealed a population of CD56bright NK cells (red; box). Scatter plot shows the CD56 and CD16 protein expression for NK cells (dots). B, Two-dimensional visualization of the CITE-seq PBMCs single-cell data. SPRING plot visualization as-depicted previously (Figure. 3A) except annotating just the NK cells (purple) and the sub-population of NK cells identified in Figure. 4A as CD56bright NK cells (red). C, Dot plot of top NK cell markers expressed in CITE-seq PBMCs. Gene expression patterns across NK cell types; size of each dot indicates the percentage of single-cell transcriptomes within each cell populations (x-axis) for which non-zero gene expression (y-axis) was observed. Color displays the average gene expression (red indicates more expression) across single cell transcriptomes detected in each category. D, Dot plot of top NK cell markers expressed in 10X PBMCs. See the caption for Figure 4C, except these n = 17 marker genes were identified by classifying the CD56bright NK in n = 4,784 single-cell transcriptomes from a different human sample and then performing differential expression analysis (resulting in n 77 gene markers). The n = 17 plotted here were markers in both the CITE-seq and 10X data. E, CD56bright NK abundance bar plot in healthy blood, healthy kidney and lupus nephritis kidney. Each bar is the ratio of single-cell transcriptomes classified as CD56bright NK cells divided by all NK cells within each tissue (error bars are 95% C.I.; two-sided binomial test). These results were derived from n = 4,784 healthy PBMCs from one donor (10X), n = 7,902 healthy PBMCs from one donor (CITE-seq data described above), n = 501 healthy kidney cells from 8 biopsies, and n = 4,440 lupus nephritis kidney cells from 28 biopsies. F, Upset plot reveals the number of NK cell markers that are shared across single cell data from blood and kidney. Dark circles in the matrix (below) indicate sets that are part of the intersection. Bar plot (top) is ordered left-to-right by the largest intersecting set size; each number (top) indicates the number of marker genes belonging to that set. Bar plot (left) shows the number of marker genes identified in each data set (purple).
2.5 SignacX outperformed other pre-trained classification methods (scPred, Azimuth and SingleR) in annotation of CITE-seq PBMCs
We compared this result with other leading methods for cell type annotation: scPred, Azimuth and SingleR [6,12,26]. We expected that Azimuth would be the best performing method because it used reference data that was also produced from CITE-seq PBMCs, and thus it may exhibit a performance bias. We observed highly consistent results between SignacX and Azimuth, with SignacX outperforming both SingleR and scPred (Supplemental Figure 5).
We wondered if the consistency between SignacX and Azimuth might be explained by the reference data that Azimuth had used in this case – a large CITE-seq panel of PBMCs (n = 8 human donors) [27]. We tested this idea by applying SignacX to annotate the reference data set, which revealed that SignacX was consistent with the annotations for the Azimuth reference data, suggesting an agreement between their author-derived annotations of the Azimuth study and the data-derived SignacX annotations of these cellular phenotypes (Supplemental Figure 6).
Next, we benchmarked our approach against other pre-trained methods (such as Moana, Garnett, DigitalCellSorter and SCINA) in bencharking data from PBMCs that were sequenced with seven different technologies; SignacX was by far the best performing pre-trained method (see Methods: Benchmarking SignacX across sequencing technologies with PBMCs) [3,28–31]. Although this demonstrated the accuracy of SignacX in PBMCs, it remained unclear to what extent SignacX classified cells in other tissues. Since the immune composition of synovium is known to be distinct from that of blood, it was advantageous to next study data from the Accelerating Medicines Partnership (AMP), which isolated cells from human joint synovial tissues and performed flow cytometry in addition to scRNA-seq [4,32]. The proteins observed in this study were well-established lineage-specific markers for four distinct cell types: CD45+CD3+ T cells, CD45+CD3-CD19+ B cells, CD45+CD14+ monocytes and CD45-CD31-PDPN+ fibroblasts [4], which allowed us to compare flow cytometry labels established previously to those generated by our approach (Figure.3D) [4]. SignacX, using only the transcriptional measurements for each cell, identified 98.2% of the flow cytometry labels (95% C.I. [98.0%; 98.5%], p-value < 0.001, two- sided binomial test, n = 8,334 cells). Encouraged by this result, we compared SignacX to another cell type annotation tool, SingleR, which uses pairwise correlations between reference transcriptomes and single cell data to make cell type classifications [3,10,12]. SignacX and SingleR had relatively similar outcome among B cells and Monocytes. However, SignacX outperformed SingleR among T cells and most notably among fibroblasts, the only nonimmune cell type in the data. (Figure. 3E; see Methods: Comparing SignacX to SingleR) [10,12,33]. Furthermore, SignacX outperformed SingleR at low sequencing depths in immune cell type classification, generating accurate classifications with as few as 200 unique genes detected per cell (95.2% average recall; 95% C.I. [76.2%; 99.9%], p-value < 0.001, two-sided binomial test; n = 21 cells; Supplemental Figure 7), demonstrating that SignacX was robust and classified cell barcodes at low sequencing depths. Next, we turned our attention to the ability of SignacX to classify cellular phenotypes that extended beyond the flow cytometry panel (Figure. 3D) to the deepest level of SignacX annotations (Figure. 1A), resulting in new cell type annotations for the synovial cells (Figure 3F) [4]. To help validate these annotations, the IMAGES identified here were consistent with well-established gene markers for molecular phenotypes, like FOXP3 in T regulatory cells (Figyre 3G; Supplemental Figure 8) [11], which suggested that SignacX had made accurate cellular phenotype classifications. However, we note that CD19 transcript was detected in only 46.9% (n = 734 / 1,564) of the flow-sorted CD45+CD3-CD19+ B cells, which demonstrates the importance of using more than one gene marker to identify cellular phenotypes in scRNA-seq data.
In the comparison with Azimuth performed on CITE-seq data, the two methods were broadly consistent (Supplemental Figure 14). However, SignacX’s labeling of T CD4 Memory cells is more consistent with the expected marker expression, i.e. higher levels of CD45RO expression and lower levels of CD45RA expression. Similarly, while T-reg expression of TIGIT and CD25 is similar between SignacX and Azimuth, SignacX-annotated T-regs have a markedly higher level of FOXP3 gene expression. These findings suggest that the SignacX’s prediction of T CD4 Memory cells and T-regs is more conservative compared to Azimuth. Altogether, this demonstrated that SignacX accurately labeled cellular phenotypes in two distinct experiments deriving cells from either blood (Figure. 3A) or synovium (Figure. 3E), from either healthy (Figure. 3A) or diseased samples (Figure. 3E) and using either droplet-based (Figure. 3A) or well-based (Figure. 3E) technologies.
2.6 SignacX learned and reliably classified rare CD56bright NK cells across tissues
Next, we challenged SignacX to learn a gene expression-based representation of a rare cell type from single cell data. To explore this idea, we studied a cellular phenotype that is increasingly important in the study of autoimmune diseases and cancer, the CD56bright NK cells [34–39]. To identify this population, we followed a strategy typically used in flow cytometry; we defined CD56bright NK cells with CD16 and CD56 protein expression in the CITE-seq data from PBMCs described above (Figure. 4A-B) [34]. To help validate that these cells were CD56bright NK cells, we noted that these cells (a) were identified using CD56 and CD16 protein expression data similar to flow cytometry [40]; (b) expressed known gene markers of CD56bright NK cells, such as CCL5-, GZMB-/H-/K+, KLRC1+, PRF1-, SELL+ and XCL1+ that were identified here with an unbiased, unsupervised approach that compared NK cells to CD56bright NK cells (Figure. 4C; n = 31 marker genes detected; see Methods: Differential gene expression analysis; Supplemental Dataset 3) [40–43]; (c) were a minority subset of the NK cells that were detected (n = 12 CD56bright NK cells out of 939 NK cells; 1.3%; 95% C.I. [0.7%; 2.2%]; two-sided binomial test), consistent with the expected rarity of CD56bright NK cells in human blood [40]; and (d) the marker genes (n = 31) identified here were statistically enriched for a chemokine receptor pathway that includes CCL5, CCR7, XCL1 and XCL2 (see Methods: Gene set enrichment analysis), which is a known functional molecular phenotype of CD56bright NK cells in human blood [40]. Next, we sought to identify these cells in tissues that lacked protein expression data by performing additional training with the CD56bright NK cells serving as reference data for the SignacX approach (Figure 1C; see Methods: Establishing a predictive model for CD56bright NK cells from CITE-seq PBMCs). We used the “NK cell model” and classified additional single cell data from other tissues and technologies, which revealed that the CD56bright NK cells were a conserved molecular phenotype that appeared with consistent abundance and with universal expression of eight marker genes across data derived from kidney and blood: CAPG+, CST7-, FCGR3A- (CD16-), FGFB2-, GZMB-, IL7R+, PRF1-, TCF7+ (Figure 4D-F). Altogether, this demonstrated that SignacX learned a rare cell type from single cell data and then identified molecularly similar cells in other contexts [4,44].
The ability of SignacX to learn novel cell types from single-cell data was further demonstrated in the case of pDCs, which were initially flagged by the model as a potentially novel cell type. Since upon experimenter review these cells were identified as pDCs, they were subsequently incorporated into the model as a subtype of DCs using the learning function (Supplemental Figure 12).
Next, we studied the behavior of SignacX in the context of doublets, which are well- known artifacts in single cell data, by analyzing scRNA-seq data from human PBMCs that were analyzed previously in a study of in silico doublet detection using Scrublet (Supplemental Figure 9; see Methods: Doublet detection in scRNA-seq PBMCs) [45]. We found that every cellular barcode annotated as unclassified by SignacX was classified as a doublet by Scrublet, whereas cells classified as either cell types or as novel cell type populations were mostly singlets. Although we recommend performing doublet removal upstream of SignacX, this merely demonstrates that SignacX accurately discerned potentially novel cellular phenotypes from single cell artifacts.
2.7 Conserved IMAGES for SignacX annotations across distinct tissues, technologies and diseases
Next, we turned our attention to characterizing the stunning diversity of cellular phenotypes in the human immune system. To help identify a universal molecular profile of immune cell phenotypes, we determined to what extent IMAGES were conserved in a trans- human study of single cell gene expression data across human donors (Figure 5A). To help validate the performance of SignacX, we note that in contrast with data from kidney, lung and skin, SignacX did not detect a single macrophage in PBMCs from any human sample, consistent with the idea that differentiation from monocytes occurs in tissue and not in blood (Figure. 5B; synovium data were excluded from this analysis because those cells were flow-sorted prior to sequencing) [4,46]. Next, we identified IMAGES for each human sample using the deepest SignacX annotations (Figure. 1A), and then pooled them to identify IMAGES that were highly conserved (universal markers) across human samples and phenotypes, revealing known and novel gene markers (Figure. 5C; Supplemental dataset 4; see Methods: Identifying IMAGES in scRNA-seq data).
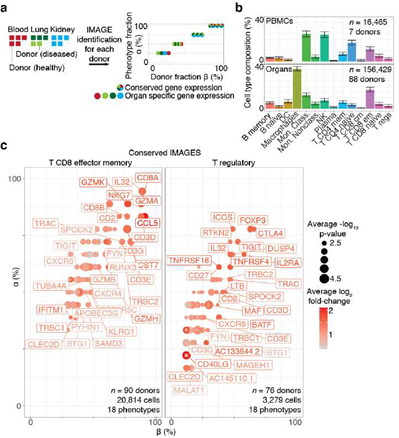
Figure 5: Systematic identification of conserved immune cell phenotypes with trans-human single cell gene expression study. A, Overview of the approach (example workflow with theoretical data). Cells were extracted from humans (n = 15) representing four distinct biological phenotypes (colors: healthy blood, red; healthy lung, dark green; diseased lung, light green; kidney, teal), each from an individual human donor (n = 15). ScRNA-seq was performed for each donor individually followed by read mapping, normalization, filtering, immune cell classified by SignacX, and then IMAGES were identified for each donor (arrow). Scatter plot displays the percentage of the four phenotypes (y-axis) and the percentage of the donors (x-axis) for which a gene (each dot is a unique gene) was identified as an IMAGE (colors indicate the phenotypes for which the gene was an IMAGE). Legend (right) shows the possible combinations. B, Bar plot shows the average immune cell type composition of blood and organ samples classified by SignacX. The percentage of immune cells (y-axis) of each cellular phenotype (x-axis) classified by SignacX. Results were average across donors; error bars were determined using the standard error of the mean. C, Scatter plot revealed conserved IMAGES for T regulatory and T CD8 effector memory cells. Scatter plot as depicted in Figure 5A. Each dot is a conserved IMAGE. Average log2 fold-change (colors) and p-values (size) were computed across human donors.
2.8 SignacX identified conserved and distinct gene expression patterns across species
Next, we challenged SignacX to classify single cell data from model organisms for which flow-sorted datasets were generally lacking. We performed scRNA-seq of cynomolgus monkey PBMCs from three donors. Remarkably, SignacX performed cell type classification without any species-specific training by mapping homologous gene symbols from monkey to human prior to classification (Supplemental Figure 10; see Methods: Cross-species classification of single cell data from cynomolgus monkey PBMCs with human reference data).
2.9 Disease biology surfaced from single cell data with annotations from SignacX
To illustrate how target genes specific to pathogenic cell types can be built with SignacX, we sought to identify therapeutic opportunities for RA using single cell data. Based on clinician input, we postulated that the ideal treatment for RA would engage pathogenic immune cells precisely, and thereby prevent or reduce side effects and insult to host tissue, perhaps even eliminating the need for continuous treatment [47]. Although we have demonstrated that we can identify pathogenic immune phenotypes precisely with single cell data using SignacX, finding a potential gene target was challenging because we lacked information about the expression of each gene in immune cells elsewhere in the body, risking the very off- target effects that we sought to avoid [7,48]. To overcome this challenge, we identified IMAGES that were specifically expressed in immune cells of diseased tissues in a pan-human study of disease-implicated cell types.
Here, we identified n = 24 genes as potential drug targets for RA on the basis that these genes were (a) in the initial pool of drug target candidates (see Methods: Establishing an initial pool of drug target candidates); (b) IMAGES for CD8+ effector memory T or naïve B cells in biopsies from RA synovium; and (c) not IMAGES for T regulatory cells in synovium (RA and OA), PBMCs (healthy and NSCLC), lung (NSCLC, sarcoidosis, ILD, IPF and healthy), kidney (lupus nephritis, renal carcinoma, healthy), or skin (healthy, atopic dermatitis lesions and non- lesions); datasets as detailed in Table 1. Altogether, these genes were expressed specifically in pathogenic cellular phenotypes and not in T regulatory cells, and, compared to the initial pool of drug target candidates, the potential drug targets identified here were significantly enriched for therapeutic targets that were either in clinicals trials or FDA approved already for an immune condition, consistent with our expectations that robust immune cell phenotype classification surfaces immune-relevant therapeutic targets (Supplemental Figure 11A-B) [4,18,47,49].
3. Discussion
The ability to identify known immune cell types uniformly and accurately in single cell data is a bottleneck for the processing of single cell data. There are several technical challenges in the development of a cell type classification algorithm, stemming from the diversity of gene expression across tissues and diseases, the relative paucity of unique gene expression-based markers for each cell category and the high number of dropout measurements inherent to single cell transcriptomic data. Here, we demonstrated that our approach was robust to tissue, disease status, sequencing depth, sequencing technology and even performed well with closely related species for which training data was not readily available. Our approach was originally trained on transcriptional data from sorted bulk samples, but also used single cell data to refine representations of existing categories and learn new ones. We used these annotations to study immune cells in different biological contexts to reveal conserved and distinct IMAGES, and to find gene signatures specific to inflamed synovium in RA. Importantly, SignacX also flagged potentially novel cell types (unclassified cells which do not match a known and well-defined cell-types in the reference dataset) for expert curation. These cells can be reviewed by the investigator post-annotation. If validated as truly novel, SignacX can be trained to recognize them (see Figure 4 and Supplemental Figure 12). Several new cell types have been identified recently with single cell technologies like CITE-seq, ATAC-seq and spatial transcriptomics. However, it remains unclear to what extent these cell types represent evidence of conserved cellular phenotypes that can be observed in other assays, or phenotypes that are unique to a given experimental protocol or observation method. As several high-profile projects strive to create an atlas of human cells, it is becoming increasingly important to learn gene expression-based cell type representations from these technologies to identify them when and where they appear in other assays. Existing classification methods help to address this problem, but risk overfitting on a specific technology or tissue, as was outlined previously, and additionally need orthogonal approaches to manual classification to help build consensus in annotations, such as the approach outlined here.
SignacX algorithm identifies cell-types and sub-cell-types according to a binary hierarchical decision-tree model trained on a consensus sorted-bulk reference dataset with fixed nomenclature compiled from multiple studies (HPCA). We believe this approach is valuable because it allows linking cell-types in single-cell data directly to cell types historically defined with orthogonal modalities (such as FACS and functional assays). This requirement for orthogonal validation was recently highlighted in Cell review paper (Zeng, 2022) as an important check in defining a cell- type. However, this approach also has certain limitations, some of which can be overcome in the future as more data and more streamlined nomenclatures become available. We have only demonstrated the capabilities of our method with respect to the particular nomenclature and dataset we have chosen. Standardized reference datasets that the scientific community agrees upon are lacking, and any annotated reference data, including the one we chose, can be susceptible to investigator bias. Furthermore, our approach at present does not uncover potential novel cell states within already known cell types (such as the six distinct DC subsets identified by [48]. However, SignacX can be extended to discover novel states at the desired level of granularity. For example, we demonstrate that the algorithm is capable of a) identifying pDCs as a novel cell state and b) learning to recognize them purely from single-cell data. Finally, it is worth noting that the problem of bulk deconvolution is formally related to the problem of cell type annotation in single- cell data. Therefore, widely used deconvolution algorithms such as ImmunoStates (Vallania, 2018) and CIBERSORT (Newman, 2015), as well as SignacX, can in principle be extended to serve both deconvolution and cell type annotation, subject to extensive benchmarking. This may be worthwhile subject of future development. The identification of gene expression-based representations of cell types using single cell data might also proffer new insights to existing bulk data. Several technologies, like gene expression-based biomarkers and cell type deconvolution algorithms like CIBERSORT, require well-established gene expression-based signatures for cell types, and thus we identified conserved and tissue-specific gene signatures for cell types here. Notably, all cell types were identified with the same semi-supervised approach described above (SignacX) without any changes to parameters or special considerations for an individual tissue or sample.
Finally, it is conventionally thought that machine learning methods require similar data types to train and to classify data. Here, we trained our models with data from microarray experiments with cellular ensembles and then used these models to classify single cell data from diverse tissues; we even accurately classified synovial fibroblasts in single cell data despite using fibroblasts isolated from human foreskin and then sequenced with microarrays in our training data10. We believe that this work is representative of a new wave of machine learning approaches that integrate disparate data types to help create more uniform and complete pictures of cellular biology.
4. Methods
4.1 Benchmarking SignacX across sequencing technologies with PBMCs
To benchmark SignacX against other annotation methods, we accessed the “PbmcBench” data – a resource of 19,792 human PBMCs sequenced across seven different technologies with cell type labels generated previously – from https://doi.org/10.5281/zenodo.3357167 on February 5, 2021[3]. Next, we classified scRNA-seq data from each of the seven technologies with SignacX (v2.0.7) in R with the default parameters. Median F1 scores were computed as described previously [3]. Good inter-dataset classification performance was defined as having an average median F1-score > 0.75 as described previously; by this measure SignacX was the best performing pre-trained classifier and performed well overall (Supplemental dataset 1) [3].
4.2 Overview of the SignacX approach
Our approach is based on an ensemble of neural network classifiers that were trained on reference data of bulk gene expression profiles for purified, sorted cell types. Let us define the pure, sorted reference data as Rij with genes (i = 1,…,m genes) and samples (j = 1,…,n samples), where each element of Rij is the gene expression value for the ith gene and jth sample. Each sample in Rij has a corresponding cell type label that was empirically determined (e.g., by flow cytometry); let us define this vector as xj (j = 1,…,n samples).
Using this formalism, we split Rij into two disjoint subsets of samples based on a hierarchy of cell type categories (Figure. 1A) that divided xj into two disjoint subsets:

Where Rik is the subset of Rij that contains all samples sorted to cellular phenotypes that were elements of cell type group Gk (e.g., if Gk is “immune”, then the matrix Rik contains data from all indices of the matrix corresponding to immune cell types). Using this notation, let us define Rip as a disjoint subset from Gk which contains all samples of type Gp (e.g., all non- immune-sorted samples). Let us define a set of predictive features for the two groups as a subset of the observed features in the data:

Where s are the indices of features that were selected as predictive for the groups Gk and Gp. To increase the sample size, we next bootstrapped Rsk by sampling the column indices with replacement (n = 1,000 bootstraps) using the sample function in R (the random number generator seed was set to 42), resulting in a bootstrapped gene expression matrix Rsk’(k = 1,…, n bootstraps). This process was performed separately for Rsp, resulting in two bootstrapped matrices corresponding to disjoint cell type populations – Rsk’ and Rsp’. To prevent overfitting, normally distributed noise was added to each row of Rsk’ (and Rsp’):

Where Nsk is the noise-added bootstrapped training data, µs and σs are the mean and standard deviation of the sth feature taken over all bootstrapped samples:
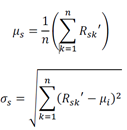
This process was repeated separately cells of group p, resulting in two noise-added, bootstrapped matrices: Nsk and Nsp, which were then augmented by features:

Where Tsj is the augmented matrix with s features and j = 1, …, 2n bootstrapped samples. Next, each feature in Tsj was scaled using min-max normalization, yielding the training data set Tsj:
Tsj − min Tsj

Next, we took two approaches, called Signac and SignacFast in the R software implementation of SignacX (v2.2.0). First, we trained an ensemble of n = 100 neural network classifiers with a single hidden layer using all of the features in the training data set Tsj. Any feature that was not present in test data was assumed to exhibit zero expression in all cells. Since no additional model training is required, this approach is implemented in the SignacFast function (SignacX R package v2.2.0). For our second approach, we first took the intersection of all features in the training and test data, and then trained models on a per-data set basis. As a result, the number of input neurons for each neural network changes, although there is still only one hidden layer. This approach is implemented in the Signac function, and is used here in this study.
4.3 Establishing the HPCA reference data for training SignacX
To establish a reference dataset, we accessed the HPCA consortium data [10], which comprised of 713 microarray samples annotated to 157 cell types, processed as described previously [12] except that all genes that encoded for ribosomal proteins and mitochondrial transcripts were removed, all samples derived from bone marrow biopsies were removed, and we used a subset of genes that were identified as exhibiting cell type-specific gene expression previously (what remained was n = 10,808 genes and n = 544 samples corresponding to 113 annotated cellular phenotypes) [11]. The data as well as the cell type annotations for the HPCA reference data were accessed in R from the SingleR R package (v0.2.0) [12].
To establish a set of gene markers for cellular phenotypes with these data, we performed differential gene expression analysis comparing samples annotated as different cellular phenotypes according to the cell type hierarchy (Figure 1A) and identified n = 5,620 genes that were significantly (p-value < 0.05, Wilcoxon-rank sum test; log-fold change > 0.25) differentially expressed using the Seurat package (v3.2.0) in R with the default settings, except that we used relative-count normalization instead of log normalization. This approach yielded no significantly differentially expressed genes for comparisons between memory and naïve B cells, plasma cells and B cells, memory and naïve CD4 T cells, T regulatory cells and CD4 memory T cells, memory and naïve CD8 T cells, and effector memory CD8 T cells and central memory CD8 T cells; in these cases we used n = 1,171 genes identified previously, which we accessed with the xCell package (v1.1.0) in R [12]. Altogether, the marker genes used here are available in Supplemental Dataset 2.
4.4 Establishing a predictive model for cellular phenotypes using the HPCA reference data
To establish a predictive model for cellular phenotypes, we first split the normalized HPCA reference data into disjoint subsets according to the cell type hierarchy (Figure. 1A; Supplemental Figure 1). At each level of the hierarchy, the marker genes were bootstrapped by random resampling with replacement across samples within each cell type, resulting in n = 1,000 bootstrapped samples of each marker gene for each cell type population. We introduced noise to each bootstrapped marker gene by sampling from a random normal distribution with mean and standard deviation set by the mean and standard deviation of the bootstrapped genes, and then we performed max-min normalization across genes (for additional details, see Methods: Overview of the SignacX approach).
Next, we constructed n = 100 neural networks in R with a logistic activation function and a single hidden layer using the neuralnet package (v1.44.2) with the neuralnet function with the default settings except that the linear.output parameter which was set to false. Neural networks were trained with the bootstrapped reference training data after taking the intersection of the genes in the training data and the target data, as a result the number of input neurons changes with different test data sets [50]. Neural network hyperparameters were validated using the caret package (v6.0-86) in R for immune and nonimmune cell type classification, which yielded the default neuralnet settings, which were subsequently used for all neural network models. Optimization of neural network hyperparameters can yield overfitting in training data (e.g., fitting a technical artifact specific to the HCPA samples or microarray technology), and therefore when we observed 100% accuracy in the classification of a test data set that was not used during model training and used a different sequencing technology (Supplemental Figure 2), we reasoned that this was sufficient evidence suggesting that the hyperparameters used here were sufficiently optimized. SignacX classification Cell type labels were generated according to the maximal probability derived from the average of an ensemble of neural networks (n = 100) trained with the HPCA reference data as described above (see Methods: Overview of the SignacX approach). For single cell data, any individual cell barcode was labeled “Unclassified” when it exhibited large (2 standard deviations greater than the mean) normalized Shannon entropy within four nearest neighbors of the KNN network computed with immune and main cell type labels (Figure 1A):

Where Hi is the normalized Shannon entropy for cell i, n is the number of unique cell type labels in the data set, and (xi) is the observed probability distribution of cell types within four nearest neighbors of the ith cell. We posited that any cell with heterogeneous nearest neighbors would exhibit unusually large Hi, and thus could be set to “Unclassified.” A user-set threshold was introduced such that any cell barcode with maximal average probability less than the threshold were labeled “Unclassified” – herein this threshold was not used (set to zero). In single cell data, any cell barcodes labeled “Unclassified” that significantly (p < 0.01, hypergeometric test) populated a Louvain cluster were amended a “potential novel cell type” label (Supplemental Figure 9).
K-nearest neighbor smoothing
To reduce classification errors of cell barcodes labeled by SignacX, we constructed k- nearest neighbor (KNN) graphs as described previously [9], and after classification of immune, nonimmune and major cell types as described above (See Methods: SignacX classification), the broad label for each cell barcode was assigned to the most frequent label of itself and of the nearest neighbors for immune cell type and major cell types (Figure 1A). Single cell data pre-processing. Unless stated otherwise, all scRNA-seq data analyzed here started from unfiltered count data. First, we removed all cell barcodes that expressed fewer than 200 unique genes and fewer than 500 counts. Next, we removed all cell barcodes with abundant (greater than 20% of the single cell library size) mitochondrial gene expression. Within this subset of cell barcodes, we removed all genes with zero detected counts, we removed all genes that were encoded for mitochondrial and ribosomal transcripts, and then library sizes were normalized to the mean library size of all cell barcodes. This procedure resulted in n = 8,920 cells in the synovium (Fig 2A), n = 4,941 cells in the kidney (Figure 2B), n = 42,844 cells in the lung (Figure 2C) and n = 7,902 cells in the CITE-seq PBMCs (Figure 2D). In the case of CITE-seq data (Figure 2D; Figure 3A), these same steps were performed only after setting aside the protein expression data. Protein expression data from CITE-seq were normalized with CLR normalization in R using the Seurat package (v3.2.0) [7]. Generation of a two-dimensional force-layout embedding was performed as described previously in Python with Jupyter notebooks that are available on our web-server [9].
4.5 Establishing an initial pool of drug target candidates
To establish an initial set of genes, we limited our analysis to genes that were druggable, associated with genetic evidence, or already approved by the FDA for an immunological condition as an established immune-relevant gene target. We accessed genes associated with genetic evidence from the GWAS catalog (version 1.0_e98_r2020-03-08) for any of the following immune conditions: rheumatoid arthritis, psoriatic arthritis, ankylosing spondylitis, giant cell arteritis, sarcoidosis, psoriasis, vitiligo, Crohn's disease, ulcerative colitis, systemic lupus erythematosus, cutaneous lupus erythematosus, lupus nephritis in systemic lupus erythematosus", Sjögren's syndrome, idiopathic pulmonary fibrosis, limited cutaneous systemic scleroderma, type 1 diabetes, celiac disease, asthma, chronic obstructive pulmonary disease, chronic rhinosinusitis with nasal polyps, atopic dermatitis, eosinophilic esophagitis, and peanut allergy. This yielded n = 2,326 unique genes. Next, we accessed all genes associated with genetic evidence and immune-relevant genes in clinical trials or approved by the FDA as those identified previously H. Fang et al., yielding n = 720 and n = 216 genes, respectively [51]. We identified genes expressed on the cell surface as those annotated as being a receptor, transmembrane protein, exhibiting peripheral expression, secreted or integrin with CellPhoneDB accessing the “protein_cureated.csv,” yielding n = 971 genes [52]. All total, this yielded n = 3,304 genes, which are provided with annotations in the SignacX R package (v2.0.7).
4.6 Establishing a predictive model for CD56bright NK cells from CITE-seq PBMCs
To learn a gene-expression based representation of CD56bright NK cells from single cell data, we first identified used CITE-seq to identify these cells with protein expression data (Fig 4A-B). Second, we defined a set of gene markers for the CD56bright NK cells (p-value < 0.05, Wilcoxon-rank sum test; log-fold change > 1) with differential gene expression analysis that compared the CD56bright NK cells to the non-CD56bright NK cells in the CITE-seq data. Differential gene expression analysis was performed with the Seurat package (v3.2.0) in R using the FindMarkers function with the default settings which resulted in n = 31 marker genes. Third, we took a subset of the CITE-seq expression matrix corresponding to the n = 31 marker genes, performed KNN imputation (Figure. 1D), and then bootstrapped the single cell data as described above (Figure 1C). Lastly, neural network model training and subsequent classification was performed as described above (Figure. 1), except now each cell classified as “NK” using the HPCA reference data were further classified as CD56bright NK cells and non-CD56bright NK cells with the new neural network models. This workflow was executed by the SignacLearn function in R with the SignacX (v2.0.7) package.
4.7 Cross-species classification of single cell data from cynomolgus monkey PBMCs with human reference data
As described previously in our single-cell optimization study [1], cryopreserved monkey PBMCs were thawed (2 vials at a time) in a 37oC water bath for 1-2 minutes until a small crystal remained. Cryovial was removed from the water bath and cell solution was transferred to a fresh, sterile 2 ml Eppendorf tube using a wide bore pipet tip. The cryovial was washed with 0.04% BSA/PBS and the solution was transferred to the Eppendorf tube. Sample was centrifuged at 150 rcf, 5 min, at room temperature (RT). Supernatant was carefully removed, and sample was washed with 1 ml of 0.04% BSA/PBS using wide bore pipet tip. Sample was re-centrifuged using the same conditions mentioned above. The cells were washed one more time for a total of 3 washes. After the final wash, cells were resuspended in 1 ml of 0.04% BSA/PBS and counted using manual hemacytometer and trypan blue. If the viability was found to be lower than 75%, the sample was subjected to a “clean-up” step using Dead Cell Removal kit (Miltenyi Biotec, Catalog #130-090-101). Cells were washed again and resuspended in 500 ul of 0.04% BSA/PBS and counted. Volume was adjusted to 1 million cells per ml of 0.04% BSA/PBS solution. After the cell volume was adjusted to 1 million per ml (or 1000 cells per ul), protocol for 10X Genomics 5’ v1 gene expression library preparation was used. 10,000 cells were targeted per sample. Quality of uniquely-indexed libraries was determined on the 2100 Bioanalyzer instrument (Agilent) using High Sensitivity DNA kit (Agilent, Catalog # 5067–4626) and quantified using Kapa library quantification kit (Kapa Biosystems, Catalog # KK4824 – 07960140001) on the QuantStudio 7 Flex Real-Time PCR system. The libraries were diluted in 10 mM Tris-HCl buffer and pooled in equimolar concentration (2 nM) for sequencing. Sequencing was performed on Nextseq2000. Sequencing depth and cycle number was as per 10X Genomics recommendations: Read 1 = 26 cycles, i7 index = 8 cycles, Read 2 = 98 cycles, and we aimed for a sequencing depth of 35,000 reads per cell. Reads were aligned to the cynomolgus monkey genome which was built from the fasta file for M. fascicularis (v5.0) with the CellRanger (v3.1.0) mkref command with the default settings. After mapping, the “raw_feature_bc_matrix.h5” files generated by CellRanger were used for subsequent analysis in R. To map gene annotations, the M. fascicularis gene symbols were mapped to human gene homologs using annotations from the 2019 ensemble archive of the M. fascicularis genome and the 2019 ensemble archive version of the homo sapiens genome with the getLDS function in biomaRt (v2.38.0) in R. Next, we used a subset of the data corresponding to only counts mapped to genes that had a homologous human gene pair (n = 17,365 genes remained). When multiple M. fascicularis genes were homologous to a single human gene, any counts mapped to those genes were summed and reported as a single mapped gene with the homologous human gene symbol, resulting in n = 16,854 unique genes. Each cell barcode was then filtered as described previously (See Methods: Single cell data pre-processing) and then classified with SignacX (v2.0.7) in R using the SignacX function with the default settings.
4.8 Comparing SignacX to SingleR
To compare SignacX to SingleR, we used the SingleR package (v0.2.0) in R and classified the synovium data with the SingleR function with the default settings, with the “ref_data” parameter set to the HPCA reference data attached to the SingleR package (Figure 2D-E; Supplemental Figure 7)[12]. We compared these results to SignacX; we used the SignacX package (v2.0.7) in R with the SignacX function with the default settings.
4.9 Differential gene expression analysis
Unless stated otherwise, differential expression analysis was performed with the Wilcoxon rank-sum test with an adjusted p-value cutoff (< 0.05), and a log-fold change cutoff (> 1) in R with the Seurat package (v3.0.2) in R using the FindMarkers function.
4.10 Gene set enrichment analysis
Gene set enrichment analysis was performed with the ReactomePA package (v1.26.0) in R using the enrichPathway function with the default settings with thresholds of 0.05 to the adjusted p-value and 0.05 to the FDR [53-56]. Identifying IMAGES in scRNA-seq data. To identify immune marker genes (IMAGES) in single cell data, we identified genes that were significantly differentially expressed (p-value < 0.05, Wilcoxon-rank sum test; log-fold change > 0.25) in a “one verse all” comparison only among single cell transcriptomes that were annotated as immune cell phenotypes by SignacX (v2.0.7) in R. Differential expression testing was performed with the Seurat package (v3.2.0) in R using the default settings. To identify conserved IMAGES (Figure. 5), we performed the IMAGE analysis described above, except that it was performed within each human sample that had at least n = 200 detected
immune cells, resulting in n = 178,929 immune cell barcodes across n = 114 human samples deriving cells from n = 18 distinct disease-tissue phenotypes corresponding to PBMCs (healthy, four stages of NSCLC), kidney (healthy, lupus nephritis and renal carcinoma), lung (healthy, IPF, four stages of NSCLC), and skin (heathy, atopic dermatitis from lesions and non-lesions) biopsies; all from previously published single cell studies (Table 1) [4,18,20–23]. The IMAGES for each human sample were pooled together, and then we reported the top genes (n =100; Figure. 5C) for each cellular phenotype corresponding to the most fractional appearance of each gene as an IMAGE across distinct human donors.
4.11 Doublet detection in scRNA-seq PBMCs
To classify doublets in PBMCs, we used Scrublet (v0.2.1) in python with the Scrublet and scrub_doublets functions with parameters set previously in the original Scrublet study [45]. The scRNA-seq data from PBMCS were accessed from 10X genomics (https://support.10xgenomics.com/single-cell-gene-expression/datasets/2.1.0/pbmc8k). To generate visualizations (Supplemental Figure 7), we used Seurat v3.2.0 in R with the default settings for each function: CreateSeuratObject, NormalizeData, FindVariableFeatures, ScaleData, RunPCA, FindNeighbors, FindClusters, RunUMAP and FindMarkers. To annotate cellular phenotypes (Supplemental Figure 7), we used SignacX (v2.0.7) in R with the SignacX function with the default settings, which was applied directly to the Seurat object using KNN edges identified with the FindNeighbors function.
4.12 KNN Imputation
To impute gene expression values, the total number of genes detected in each cell was set to the diagonal of a cell-by-cell matrix Wjj. Next, we established cells with direct and higher k- degree connections in the KNN network from the adjacency matrix Ajj and from kt3 powers of Ajj, forming a KNN network-based imputation operator Djj which was weighted by the total number of genes detected in each cell, and normalized such that each row sums to two:

The imputed expression matrix E) is then computed directly by operating on the observed expression matrix Eij. Here, we set k = 1 to use gene expression values within first nearest neighbors in the KNN network, resulting in the imputed gene expression matrix:

Data and software availability
All data reported here are publicly available (Table 1). The kidney and the synovium (Figure. 2) datasets were downloaded via ImmPort (accession codes SDY997 and SDY998, April 2019 release) from the AMP consortium4. The PBMCs CITE-seq data (Figure. 3) and healthy control data (Figure. 5) were downloaded from the 10X website
(https://support.10xgenomics.com/single-cell-gene-expression/datasets/3.0.2/5k_pbmc_protein_v3
and https://support.10xgenomics.com/single-cell- gene-expression/datasets/3.0.2/5k_pbmc_v3). The blood and lung (Supplemental Figure 11) NSCLC data sets were downloaded from the NCBI GEO depository (accession number GSE127465) [18]. All software used in this study is available on the GitHub page for SignacX (https://github.com/Sanofi-Public/PMCB-SignacX).. We also provide a website
(https://sanofi-public.github.io/PMCB-SignacX/) and data portal for interactive access of single cell data used in this study (https://sanofi-public.github.io/PMCB-SignacX/articles/dataportal.html).
Acknowledgments
We would like to thank members of the Precision Medicine and Computational Biology & the Immunology and Inflammation Therapeutic Areas at Sanofi for insightful discussions. We would like to thank Reza Olfati-Saber for revisions to the manuscript. This work was supported by Sanofi US.
Declarations of Interests
The authors are employees of Sanofi. M.C., V.S. and E.D.R have a patent pending for the approach described herein (U.S. Patent Application No. 63/137,843).
Authors’ contributions
E.D.R., V.S. and F.N. oversaw the research; M.C. N.N., and A.H.K performed the research, developed SignacX and performed computational analysis of data with the guidance of V.S.; R.H. performed single-cell experiments with the guidance of V.S.; M.C., R.H. and V.S. drafted the manuscript and all authors contributed to writing the final version.
References
- Abdelaal T, Michielsen L, Cats D, et al. A comparison of automatic cell identification methods for single-cell RNA sequencing data. Genome biology 20 (2019): 1-19.
- Adan A, Alizada G, Kiraz Y, et al. Flow cytometry: basic principles and applications. Critical reviews in biotechnology 37 (2017): 163-176.
- Alquicira-Hernandez J, Sathe A, Hanlee P Ji, et al. scPred: accurate supervised method for cell-type classification from single-cell RNA-seq data. Genome biology 20 (2019): 1-17.
- Aran D, Hu Z & Atul J Butte. xCell: digitally portraying the tissue cellular heterogeneity landscape. Genome biology 18 (2017): 1-14.
- Aran D, Agnieszka P Looney, Liu L, et al. Reference-based analysis of lung single-cell sequencing reveals a transitional profibrotic macrophage. Nature immunology 20 (2019): 163-172.
- Arazi A, Deepak A Rao, Celine C Berthier, et al. The immune cell landscape in kidneys of patients with lupus nephritis. Nature immunology 20 (2019): 902-914.
- Bluestone JA & Anderson M. Tolerance in the age of immunotherapy. New England Journal of Medicine 383 (2020): 1156-1166.
- Butler A, Hoffman P, Smibert P, et al. Integrating single-cell transcriptomic data across different conditions, technologies, and species. Nature biotechnology 36 (2018): 411-420.
- Buttner M, Miao Z, Alexander W F. A test metric for assessing single-cell RNA-seq batch correction. Nature methods 16 (2019): 43-49.
- Bzdok D, Krzywinski M & Altman N. Machine learning: supervised methods. Nature methods 15 (2018):
- Chamberlain M, Hanamsagar R, Nestle F O, et al. Cell type classification and discovery across diseases, technologies and tissues reveals conserved gene signatures and enables standardized single-cell readouts. Biorxiv (2021).
- Chanvillard C, Jacolik F, Carmen Infante-Duarte, et al. The role of natural killer cells in multiple sclerosis and their therapeutic implications. Frontiers in immunology 4 (2013).
- Costales JA, Daily J P, Burleigh B A. Cytokine-dependent and--independent gene expression changes and cell cycle block revealed in Trypanosoma cruzi-infected host cells by comparative mRNA profiling. BMC genomics 10 (2009): 1-17.
- De Jonge K, Anna Ebering, Sina Nassiri, et al. Circulating CD56bright NK cells inversely correlate with survival of melanoma patients. Scientific reports 9 (2019): 1-10.
- Domanskyi S, Hakansson A, Bertus T J, et al. Digital Cell Sorter (DCS): a cell type identification, anomaly detection, and Hopfield landscapes toolkit for single-cell transcriptomics. PeerJ 9 (2021): 10670.
- Efremova M, Miquel Vento-Tormo, Sarah A Teichmann, et al. CellPhoneDB: inferring cell--cell communication from combined expression of multi-subunit ligand--receptor complexes. Nature protocols 15 (2020): 1484-1506.
- Encode Project C. An integrated encyclopedia of DNA elements in the human genome. Nature 489 (2012): 57.
- Fang H, Knezevic B, Burnham K L, et al . A genetics-led approach defines the drug target landscape of immune-related traits. Nature genetics 51 (2019): 1082-1091.
- Fogel L A. Natural killer cells in human autoimmune disorders. Arthritis research & therapy 15 (2013): 1--9.
- Fonseka CY. Mixed-effects association of single cells identifies an expanded effector CD4+ T cell subset in rheumatoid arthritis. Science translational medicine 10 (2018): 0305.
- Greenberg, Jack L Pinkus, Sek Won Kong. Highly differentiated cytotoxic T cells in inclusion body myositis. Brain 142 (2019): 2590-2604.
- Gunther F, Fritsch S. Neuralnet: training of neural networks. R J 2 (2010): 30.
- Habermann A Austin J, Linh T. Single-cell RNA sequencing reveals profibrotic roles of distinct epithelial and mesenchymal lineages in pulmonary fibrosis. Science advances 6 (2020): 1972.
- Hanamsagar R, Reizis T, Chamberlain M, et al. An optimized workflow for single-cell transcriptomics and repertoire profiling of purified lymphocytes from clinical samples. Scientific reports 10 (2020): 1-15.
- Hao Y, Stephanie Hao, Erica Andersen-Nissen. Integrated analysis of multimodal single-cell data. Cell, 184 (2021): 3573-3587.
- He, Hemant Suryawanshi, Pavel Morozov. Single-cell transcriptome analysis of human skin identifies novel fibroblast subpopulation and enrichment of immune subsets in atopic dermatitis. Journal of Allergy and Clinical Immunology 145 (2020): 1615-1628.
- Huang Q, Yu Liu, Yuheng Du. Evaluation of cell type annotation R packages on single-cell RNA-seq data. Genomics, proteomics & bioinformatics 19 (2021): 267-281.
- Italiani P, Boraschi D. From monocytes to M1/M2 macrophages: phenotypical vs. functional differentiation. Frontiers in immunology 5 (2014).
- Kang J B, Nathan A, Weinand K, et al. Efficient and precise single-cell reference atlas mapping with Symphony. Nature communications 12 (2021): 1-21.
- Lex A, Gehlenborg N. Points of view: Sets and intersections. Nature Methods 11 (2014): 779.
- Luetke-Eversloh M, Killig M, & Romagnani C. Signatures of human NK cell development and terminal differentiation. Frontiers in immunology 4 (2013).
- Mabbott N A, Baillie J K, Brown H, et al. An expression atlas of human primary cells: inference of gene function from coexpression networks. BMC genomics 14 (2013): 1-13.
- Mamessier, Hemant Suryawanshi, Pavel Morozov, et al. Human breast cancer cells enhance self tolerance by promoting evasion from NK cell antitumor immunity. The Journal of clinical investigation 121 (2011): 3609-3622.
- Martens JH. BLUEPRINT: mapping human blood cell epigenomes. Haematologica 98 (2013): 1487.
- Michel T, Poli A, Cuapio A, et al. Human CD56bright NK cells: an update. The Journal of Immunology 196 (2016): 2923-2931.
- Newman A, Liu C L, Green M R, et al. Robust enumeration of cell subsets from tissue expression profiles. Nature methods 12 (2015): 453-457.
- Plasschaert L, Rapolas Zilionis, Rayman Choo-Wing, et al. A single-cell atlas of the airway epithelium reveals the CFTR-rich pulmonary ionocyte. Nature 560 (2018): 377-381.
- Pliner HA. Supervised classification enables rapid annotation of cell atlases. Nature methods 16 (2019): 983-986.
- Poli A. CD56bright natural killer (NK) cells: an important NK cell subset. Immunology 126 (2009): 458-465.
- Poznanski SM. Shining light on the significance of NK cell CD56 brightness. Cellular & molecular immunology 15 (2018): 1071-1073.
- Reyfman, James, Nikita, et al. Single-cell transcriptomic analysis of human lung provides insights into the pathobiology of pulmonary fibrosis. American journal of respiratory and critical care medicine 199 (2019): 1517-1536.
- Schepis D, Gunnarsson I, Maija-Leena E, et al. Increased proportion of CD56bright natural killer cells in active and inactive systemic lupus erythematosus. Immunology 126 (2009): 140–146.
- Smith SL. Diversity of peripheral blood human NK cells identified by single-cell RNA sequencing. Blood advances 4 (2020): 1388-1406.
- Stewart B J. Spatiotemporal immune zonation of the human kidney. Science 365 (2016): 1461-1466.
- Stoeckius M, Hafemeister C, Stephenson W, et al. Simultaneous epitope and transcriptome measurement in single cells. Nature methods 14 (2017): 865-868.
- Trapnell C. Defining cell types and states with single-cell genomics. Genome research 25 (2015): 1491-1498.
- Vallania, F, Tam A, Lofgren S, et al. Leveraging heterogeneity across multiple datasets increases cell-mixture deconvolution accuracy and reduces biological and technical biases. Nature communications 9 (2018): 1-8.
- Villani A-C, Satija R, Reynolds G, et al. Single-cell RNA-seq reveals new types of human blood dendritic cells, monocytes, and progenitors. Science 356 (2017): 4573.
- Wagner F, Yanai I. Moana: a robust and scalable cell type classification framework for single-cell RNA Seq data. BioRxiv (2018): 456129.
- Weinreb C, Wolock S, Allon M K. SPRING: a kinetic interface for visualizing high dimensional single-cell expression data. Bioinformatics 34 (2018): 1246-1248.
- Wolock S, Romain L, Allon M K. Scrublet: computational identification of cell doublets in single-cell transcriptomic data. Cell systems 8 (2019): 281-291.
- Yu G, Yu Q. ReactomePA: an R/Bioconductor package for reactome pathway analysis and visualization. Molecular BioSystems 12 (2016): 477-479.
- Zeng H. What is a cell type and how to define it? Cell 185 (2022): 2739-2755.
- Zhang F, Kevin W, Kamil S, et al. Defining inflammatory cell states in rheumatoid arthritis joint synovial tissues by integrating single-cell transcriptomics and mass cytometry. Nature immunology 20 (2019): 928-942.
- Zhang Z, Danni L, Xue Z, et al. SCINA: a semi-supervised subtyping algorithm of single cells and bulk samples. Genes 10 (2019): 531.
- Zilionis R, Camilla E, Christina P, et al. Single-cell transcriptomics of human and mouse lung cancers reveals conserved myeloid populations across individuals and species. Immunity 50 (2019): 1317-1334.
Supplementary Materials:
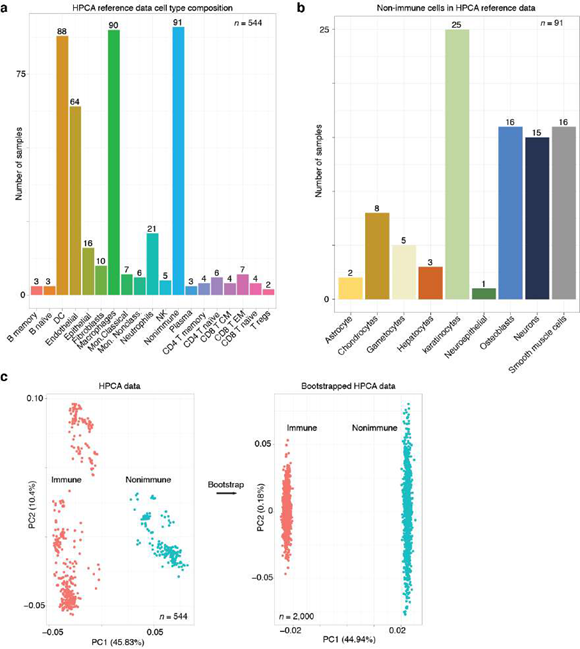
Supplemental Figure 1: Overview of the HPCA reference data. A, Number of samples bar plot for each annotated cell type. Bar plot indicates the number of samples (y-axis; numbers) for each cellular phenotype (x-axis) that was in the HPCA reference data set. B, Number of samples bar plot for the “nonimmune” cellular phenotypes. Bar plot as depicted in Supplemental Figure 1A for the n = 91 samples in the “nonimmune” cell type category. C, Principal component analysis (PCA) plots revealed that the HPCA reference data and the bootstrapped training data were separable by immune and nonimmune gene markers. PCA plot (left) shows a gene expression sample (each dot) from the HPCA reference data that is either labeled as immune (red) or nonimmune (teal) based on the classification hierarchy established here and the annotated cell type established experimentally (Figure. 1A). PCA was performed on the marker gene that were determined by differential gene expression analysis comparing the samples annotated as immune and nonimmune. After bootstrapping (arrow); PCA was performed with the same marker genes, except with data that was bootstrapped from the immune and nonimmune samples. We note that the structure in the PCA plot prior to bootstrapping was largely removed, consistent with the view that bootstrapping generated what can be thought of as composite or as average immune and nonimmune gene expression samples.
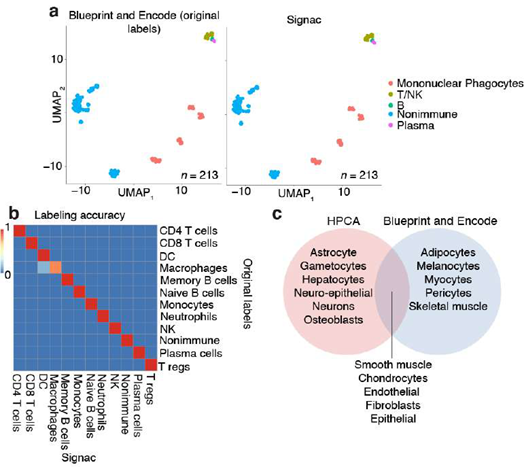
Supplemental Figure 2: Neural networks robustly classified validation data from the Blueprint and Encode consortia. A, UMAP plots show that cellular phenotypes were accurately classified by SignacX. In the scatter plot (left), each dot is a sample of pure cell type gene expression data that was amended labels for cellular phenotypes (colors; see legend). The data represented here are in a two-dimensional embedding (axes), in which distances correspond to transcriptional similarities between samples (closer samples are more similar); we determined this embedding with UMAP. Cellular phenotype labels (colors) were established either by the Blueprint and Encode consortium (left) with empirical measurements or by our computational approach (right). B, Heatmap shows that distinct immune cell phenotypes were accurately classified by SignacX. Heatmap displays the fraction of the samples within each cellular phenotype category (axes) that were accurately classified by our approach (scale bar; red is more accurate; blue is less accurate). C, Venn diagram shows that SignacX accurately identified the transcriptomes of nonimmune cellular phenotypes despite never being trained to recognize them. Venn diagram depicts the nonimmune cellular phenotypes that were specific to the HPCA reference data (left; red), that were shared between the HPCA reference and the Blueprint and Encode data (middle; purple), and that were distinct to the Blueprint and Encode data (right; blue).
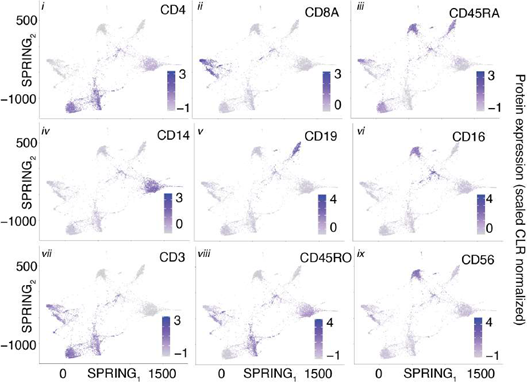
Supplemental Figure 3: Protein expression SPRING plots validated the cellular phenotypes classified by SignacX for the CITE-seq PBMCs data. Each SPRING plot (i-ix) displays the z- score transformed CLR normalized protein expression (colors) generated for each individual cell.
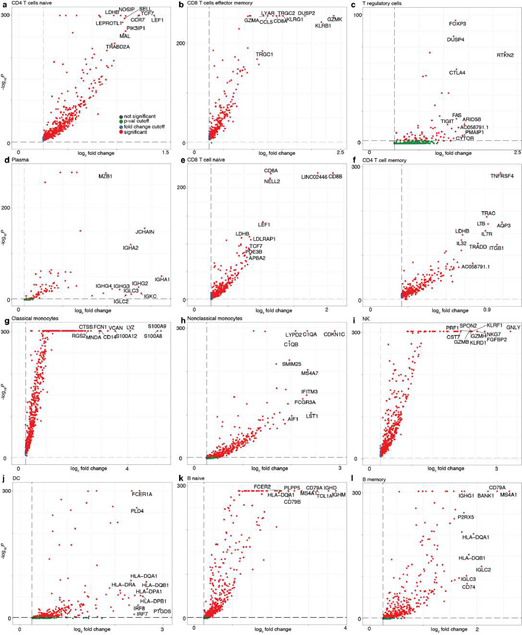
Supplemental Figure 4: IMAGES identified from immune phenotypes in CITE-seq PBMCs single cell transcriptomes. A-I, Volcano plots demonstrate the IMAGES identified in each cell population. Each scatter plot depicts the statistical association (y-axis) and the average fold- change of IMAGES (each dot is a unique gene) for immune cell phenotypes. Colors (red) indicate IMAGES that passed the thresholds applied to the fold-change and adjusted p-values.
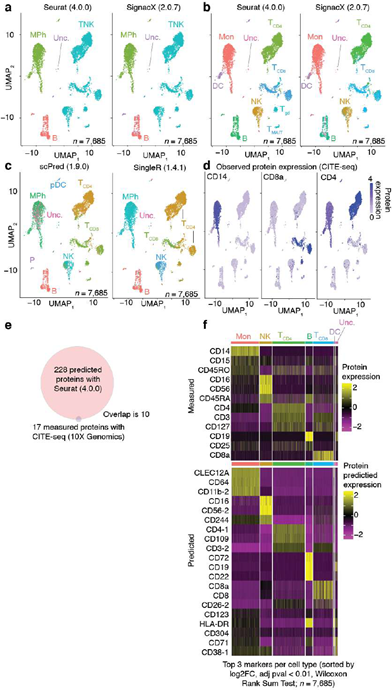
Supplemental Figure 5: Direct comparison of single cell annotation methods. A, Clear similarity between SignacX and Azimuth annotations. UMAP plot where each dot is an individual cell annotated (colors) by Azimuth (left) and by SignacX (right) reveals broad consistency between the two methods using CITE-seq data from human PBMCs (n = 1 human sample). B, Similarity between SignacX and Azimuth in cellular phenotype annotations. Cells were labeled to more nuanced cellular phenotypes (colors), revealing consistency between SignacX and Azimuth. C, scPred and SingleR were not as effective in classifying CITE-seq PBMCs. ScPred (left) left many monocytes unclassified, whereas SingleR (right) misclassified a large group of CD8+ T cells. D, Observed lineage-specific protein expression. Each UMAP plot displays the z-score transformed CLR normalized protein expression (colors) generated for each individual cell with CITE-seq. E, Exploring protein expression with Seurat multi-modal analysis. Venn diagram displays the number of proteins predicted with Seurat (4.0.0) as well as those measured in the CITE-seq panel. F, Heatmap of protein expression (measured and predicted) in CITE-seq PBMCs in cellular phenotypes labeled by SignacX. Color shows the scaled protein expression data (yellow is higher expression; purple is lower expression) across single-cell transcriptomes (columns). Annotation bar indicates the cellular phenotypes assigned by SignacX. The predicted protein expression patterns help to yield insight to why SignacX and Azimuth were consistent.
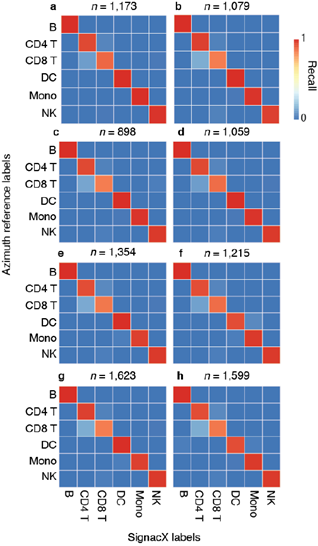
Supplemental Figure 6: Validation for SignacX labeling by correspondence with Azimuth reference CITE-seq data. A-H, heatmaps of SignacX recall of Azimuth reference labels. Each heatmap indicates the recall of cellular phenotype labels by SignacX compared to the Azimuth CITE-seq reference data separated by n = 8 independent human samples, indicating no sample-specific bias in SignacX recall of PBMC labels.
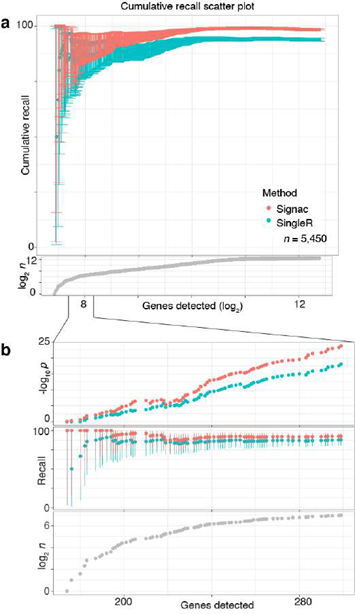
Supplemental Figure 7: SignacX accurately recalled flow cytometry labels with few genes detected. A, Cumulative recall scatter plot showed that SignacX outperformed SingleR as a function of genes detected in immune cell transcriptomes. Plot depicts the cumulative recall (y-axis) of immune cell type labels. The labels were originally determined by flow cytometry (T cell, B cell or monocyte). Recall of these labels was calculated cumulatively as a function of the number of genes detected (x-axis) by either SignacX (red) or SingleR (teal). Fibroblasts were omitted from this analysis due to broad misclassification by SingleR. Scatter plot, bottom depicts the number of single cell transcriptomes (n) as a function of genes detected. Error bars (top) are 95% C.I.s determined by two-sided binomial testing. B, Inset shows stronger SignacX performance at low genes detected. Scatter plot (top) depicts the p-value for the two-sided binomial test and showed that SignacX (red) outperformed SingleR (teal) at low sequencing depths. Scatter plots (middle; bottom) are close-ups of Supplemental Figure 5A for data with less than 300 genes detected.
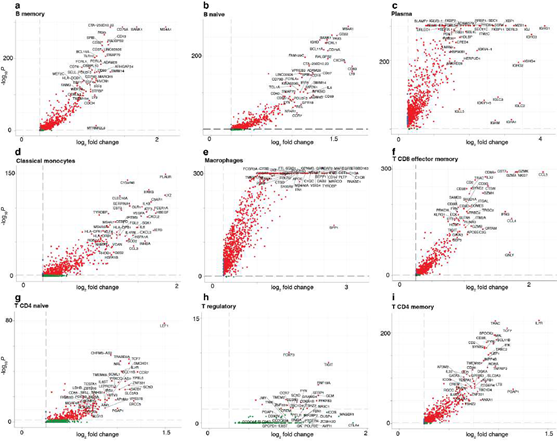
Supplemental Figure 8: IMAGES identified from immune phenotypes in synovium single cell transcriptomes. A-I, Volcano plots demonstrate the IMAGES identified in each cell population. Each scatter plot depicts the statistical association (y-axis) and the average fold- change of IMAGES (each dot is a unique gene) for immune cell phenotypes. Colors (red) indicate IMAGES that passed the thresholds applied to the fold-change and adjusted p-values.
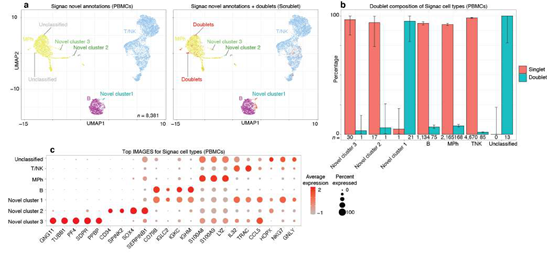
Supplemental Figure 9: SignacX-generated “unclassified” PBMCs were all identified as doublets (Scrublet), novel and classified cell type populations were mostly singlets. A-I, Volcano plots demonstrate the IMAGES identified in each cell population. A, UMAP plot displays the cell type annotations of SignacX for PBMCs (left), and the same data but with doublets classified by Scrublet (right). Each cell barcode (n = 8,381 from one human donor) was classified by SignacX (left), and then doublet labels were amended to each cell with Scrublet (right; red); see Methods: SignacX classification. B, Bar plot reveals that unclassified cells were entirely composed of doublets, whereas novel cell populations and classified cells were mostly composed of singlets. Each bar shows the percentage (y-axis) of each cell type (x-axis) that is a doublet (teal) or a singlet (red). Error bars correspond to 95% confidence intervals, two- sided binomial test. C, IMAGE expression dot plot shows that unclassified cells and novel cluster 2 were doublet-like, whereas novel cluster 2 and 3 were singlet-like and enriched for known platelet and hematopoietic stem-cell gene markers. Dot plot shows the percentage (size) of single-cell transcriptomes within a cell type (y-axis) for which non-zero expression of marker genes was observed (x-axis). Color displays the average gene expression (red indicates more expression) in each cell type category. Novel cluster 1 was enriched for IMAGES that were typically enriched in either B cells or T cells, but not both (i.e., these cells expressed both CD79B and TRAC), consistent with the view that these cells were doublets. Novel cluster 3 images (GNG11+ TUBB1+) suggested platelet-like cells, and novel cluster 2 images (CD34+ SPINK2+) suggested hematopoietic stem cell-like cells.
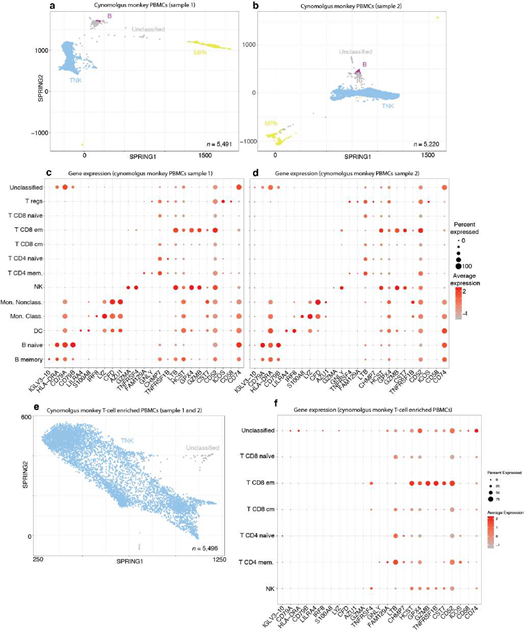
Supplemental Figure 10: SignacX accurately classified primate PBMCs without any species-specific training. A, SPRING plot for PBMCs from cynomolgus monkey donor 3003. B, SPRING plot for PBMCs from cynomolgus monkey donor 3004. C-D, IMAGE expression dot plot shows that SignacX classifications for immune phenotypes were consistent with known gene markers. E, SPRING plot for PBMCs from cynomolgus monkey samples that were enriched for T cells during sequencing. See Methods: Cross-species classification of single cell data from cynomolgus monkey PBMCs with human reference data. F, IMAGE expression dot plot shows that SignacX classifications for immune phenotypes were consistent with T cell type enrichment assay.
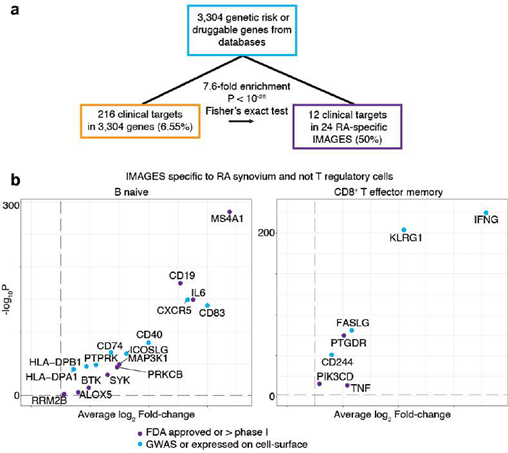
Supplemental Figure 11: Disease biology surfaced from single cell data with SignacX. A, Overlap of drug targets and IMAGES identified here with enrichment score. The initial set of genes (teal) contained n = 216 clinical targets in 3,304 genes (orange). We identified n = 24 RA-specific IMAGES (purple) and this set was enriched for clinical targets. B, Volcano plot shows the IMAGES for the n = 24 potential target genes in RA. Scatter plot shows the IMAGES identified here colored by clinical targets (purple) and genes that were in the initial set of genes, but not clinical targets (teal).
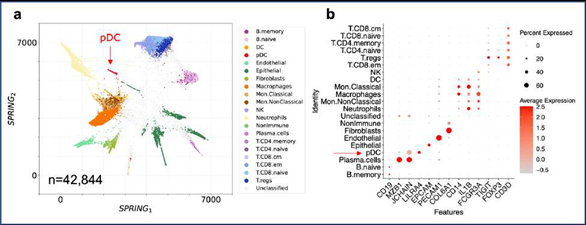
Supplemental Figure 12: Trained annotation of pDCs consistent with expected marker expression. (a) SPRING visualization of the cancer lung dataset with all the cell labels predicted by SignacX based on the modified reference dataset that includes pDCs identification. (b) Average marker expression across the SignacX’s cell type labels, with pDCs indicated by an arrow. Sizes of circles correspond to the percentage of cells that express the marker gene.
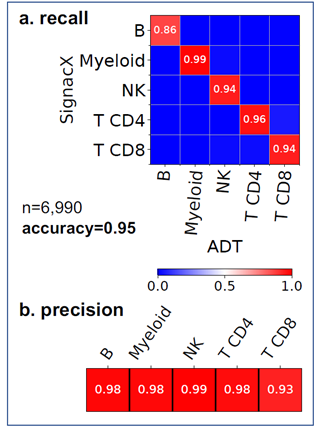
Supplemental Figure 13: Comparison between cluster-based annotation of PBMC CITE- seq data and SignacX. Similarity between the annotations was determined by calculating (a) recall, (b) precision, and accuracy. Precision and recall values are represented by the blue-to-red color scheme indicated by the color bar.
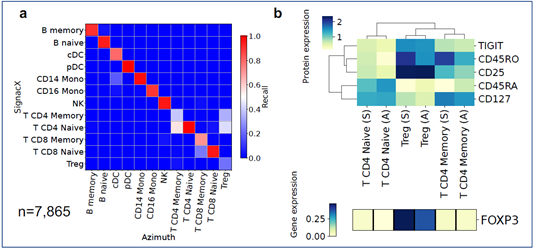
Supplemental Figure 14: Comparison between SignacX and Azimuth annotation of the CITE-seq lung data. (a) Heatmap of recall values comparing SignacX labels to those of Azimuth. (b) Average expression of ADT tags (top) and genes (bottom) relevant to CD4+ cells.


 Impact Factor: * 4.2
 Acceptance Rate: 77.66%
  Time to first decision: 10.4 days
  Time from article received to acceptance: 2-3 weeks