A Computational Pipeline to Control the Quality and Reduce Contamination in Single Retinal Ganglion Cells
Yeganeh Madadi1, Hao Chen2, Lu Lu3, Monica M Jablonski1, Robert W Williams3, Siamak Yousefi1,3
1Department of Ophthalmology, University of Tennessee Health Science Center, Memphis, TN, USA
2Department of Pharmacology, Addiction Science and Toxicology, University of Tennessee Health Science Center, Memphis, TN, USA
3Department of Genetics, Genomics, and Informatics, University of Tennessee Health Science Center, Memphis, TN, USA
*Corresponding author: Siamak Yousefi, Department of Ophthalmology, University of Tennessee Health Science Center, 930 Madison Ave., Suite 471, Memphis, TN 38163.
Received: 08 August 2023; Accepted: 15 August 2023; Published: 30 August 2023
Article Information
Citation: Yeganeh Madadi, Hao Chen, Lu Lu, Monica M Jablonski, Robert W Williams, Siamak Yousefi. A Computational Pipeline to Control the Quality and Reduce Contamination in Single Retinal Ganglion Cells. Journal of Bioinformatics and Systems Biology. 6 (2023): 201-208.
View / Download Pdf Share at FacebookAbstract
Single-cell transcriptome profiling has transformed our understanding of cellular heterogeneity. However, single-cell data with poor quality can impede proper identification of distinct cell populations and subsequent biological interpretations. In this study, we present a customized computational approach to control the quality and reduce contaminations in single-cell transcriptome profiling of retinal ganglion cells (RGCs). We leverage domain knowledge and statistical methods to effectively eliminate various sources of contaminants for identification of RGC types and subtypes. We show that our end-to-end computational pipeline improves the accuracy and reliability of single-cell transcriptome profiling of RGCs and enhances the biological interpretations. To show the effectiveness of our pipeline, we use 5,994 RGCs captured from retinas of mouse using Fluidigm technology as a benchmark dataset and compare with widely used quality control tools. Further, we introduce seven candidate F-RGC subtype markers that we identified after applying our introduced pipeline on the benchmark dataset. Our customized quality control pipeline could enable retinal single RGC probing with more granularity, leading to new insights into RGC-related visual diseases and development of therapeutic approaches.
Keywords
<p>Single Cell RNA Sequencing (scRNA-seq), Retinal Ganglion Cell (RGC), Quality Control, Contamination, Computational Models.</p>
Article Details
1. Introduction
Recent progress in single cell RNA sequencing (scRNA-seq) have led to identification of various cell types, subtypes, and their function [1-3].
One of the most challenging aspects of single-cell transcriptome profiling is to control the quality and deal with contamination. Single cell contamination comes from a variety of sources, including environmental RNA, cell doublets, cross-contamination (during sample handling). Such sources of contamination could adversely impact the accuracy and biological relevance of the downstream analysis [4]. Single-RGCs are challenging to capture, and various sources of contamination reach to the final data generation steps.
To control the quality of the scRNA-seq data and to mitigate the effect of contamination, researchers have developed several computational methodologies [5, 6]. Available tools for QC and mitigating the effect of contamination are as follows: 1) Cell Ranger [7] is a widely used software application developed by 10x Genomics for the processing and analysis of scRNA-seq data. It has built-in QC measures to eliminate poor-quality cells based on parameters such as the number of detected genes, total counts, and mitochondrial gene content; 2) Seurat [8] is a popular R package for analyzing scRNA-seq data. In terms of QC, Seurat can identify cells based on various parameters of the expressed genes, total counts, and mitochondrial level as well as identifying highly variable genes and determining the batch effects and outliers; 3) Scrublet [9] is a program that can find doublets in scRNA-seq data, or cells that were incorrectly counted as two different cells during droplet-based single-cell library preparation; 4) scater [10] is an R package that performs a number of QC tasks, such as calculating QC metrics, generating QC graphs, and discarding cells with quality scores below a specified threshold; 5) Scran [11] is a QC program for R that implements approaches to perform low-level processing in scRNA-seq data, such as cell cycle phase assignment and variance modeling; 6) Linnorm [12] is an R package focused on normalizing approaches that can assist in addressing potential technical biases in single-cell data; 7) ZINB-WaVE [13] is intended to deal with zero-inflated data by employing a zero-inflated negative binomial model to improve the quality of the downstream scRNA-seq data analysis; 8) Monocle [14] is an R program developed for analyzing single-cell trajectories by QC procedures that seek for and eliminate any cells of poor quality; 9) scvis [15] is a data visualization program that helps finding and investigating patterns in scRNA-seq data. Users can spot problems or contradictions in the data by visually analyzing the quality of the clustering; and 10) scPipe [16] pipeline detects low-quality cells and possible batch effects through QC procedures.
Researchers have used some of these techniques or various combination of these QC techniques for analyzing single-RGC RNA-seq data. Rheaume et al. [2] used Seurat to implement QC and cell filtering to minimize contamination by excluding low-quality cells and those with poor sequencing metrics, ensuring that the analysis focused on high-quality data and minimizing contamination effect on the results. In order to reduce the amount contaminations, Tran et al. [17] removed cells based on the number of genes and employed Scrublet for removing doublet. Li et al. [3] used Seurat to sift through genes expressed in cells, total reads per cell, and the level of mitochondrial genes. To further reduce contamination and include RGCs only, they required expression of at least one out of seven pan-RGC markers and no (or low) expression of Pten.

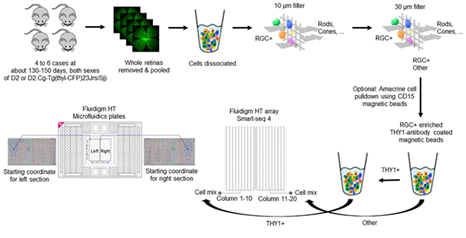
Figure 1: The experimental workflow of creating single-RGC RNA-seq from mice retinas by utilizing Fluidigm technology. Six DBA/2j glaucoma mice and four DBA/2J-Gpnmb non-glaucoma mice were used to generate 5,994 retina cells through HiSeq 3000 and SMART-Seq v4 technologies.
2. Materials and Methods
2.1 Benchmark datasets; RGC sampling, isolation, and single-cell transcriptome profiling technology
Six DBA/2J or D2.Cg-Tg (thyl-CFP) 23 Jrs/Sj mice aged 130-180 days and four DBA/2J-Gpnmb mice aged 120-140 days were anesthetized and their retinas were extracted in one piece (Figure 1). The optic nerve was removed, and the harvested retinas were separated into two tubes. The pooled retinas were given a quick spin to gather the tissue at the bottom of the tubes after which they were mechanically separated using trituration. To collect the cell suspension and the pre-wetted contents, a short spin was given to each cell strainer. Placing the cell suspension on a Plurifilter with a pore size of 10 µm allowed cells smaller than 10 µm to pass through while cells larger than 10 µm are retained on the filter. To eliminate cells larger than 30 µm, a second Plurifilter was added to the system. Then, THY1 antibody-coated beads were used to enrich RGCs. With the use of SMART-Seq v4 [18], full-length polyA-positive mRNAs were isolated and used to generate scRNA-seq libraries. We sequenced 5,994 cells from eight plates by using a HiSeq 3000 and 150 nucleotide pair-end reads. 5,194 cells in seven plates were captured from DBA/2J mice suspected of glaucoma, and 800 cells in one plate were taken from DBA/2J-Gpnmb mice which were used as control samples. To generate gene expressions data, we used R1 reads to de-multiplex barcode rows and R2 reads to time and align to a reference genome [19].
2.2 Data preprocessing and quality control
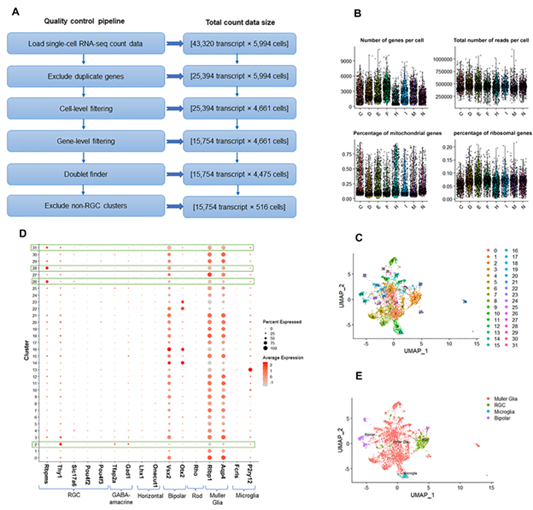
We utilized Seurat and employed other tools that were customized to create a QC pipeline to reduce contamination in single-cell transcriptome profiling of RGCs. The main steps in proposed QC pipeline are as follows: 1) load scRNA-seq count data; 2) exclude duplicate genes; 3) filter cells (based on the number of reads per cell, number of genes per cell, mitochondrial level, and ribosomal level); 4) filter genes (based on the number of cells expressing genes and genes with zero expression); 5) find doublets; and 6) exclude non-RGC clusters (based on known retinal cell markers). Overview of proposed QC pipeline is illustrated in Figure 2A. Below, we have outlined assessment of the proposed QC pipeline. scRNA-seq count data was loaded into R software. We merged scRNA-seq data from seven plates (C, D, E, F, H, I, and M) collected from DBA/2J. Plate N included scRNA-seq data from control mice. The scRNA-seq data from the glaucoma mice included 5,994 cells with 43,320 transcripts. All plates were combined based on unique gene names and duplicated gene names were removed (we kept the transcripts with a greater number of non-zero expressions across 5,994 cells). This step generated 25,394 transcripts. In the two next steps, we excluded some of the cells and genes. For cell-level filtering, we assessed various metrics such as cell counts, unique molecular identifier (UMI) counts (transcripts) per cell, number of genes detected per cell, mitochondrial counts ratio, and ribosomal counts ratio and excluded cells that did not met our criteria (Fig. 2B). Specifically, we filtered cells with fewer than 250,000 UMIs, 900 genes, mitochondrial counts ratio higher than 0.6, or ribosomal counts ratio lower than 0.02. The size of count matrix after cell-level filtering was [25,394 transcript * 4,661 cells]. For gene-level filtering, we removed genes with zero expression in all cells and excluded genes that had not been expressed in at least five cells. The size of count matrix after gene-level filtering was [15,754 transcript * 4,661 cells]. We then utilized DoubletFinder() function to identify doublets formed from cells with identical single nucleotide polymorphisms (SNP) profiles and removed them from the downstream analysis. The count data size after doublet removal was [15,754 transcript * 4,475 cells]. Finally, we used graph-based clustering method and identified 32 different clusters (Figure 2C). We then excluded non-RGC clusters based on pan-RGC markers (Rbpms, Thy1, Slc17a6, Pou4f2, Pou4f3) and non-RGC markers (Tfap2a, Gad1, Lhx1, Onecut1, Vsx2, Otx2, Rho, Rlbp1, Aqp4, Fcrls, P2ry12) (Figure 2D-E) [17]. The final count data size was [15,754 transcript * 516 cells].
2.3 Identification of specific markers for different RGC subtypes
After excluding various potential sources of contamination, we re-clustered the remaining cells. Our aim of re-clustering is to group different putative RGCs into distinct subtypes. We thus normalized the data based on Fragments Per Kilobase Million (FPKM) values then converted the values to log2 scale using Seurat functions [20]. We then used principal component analysis (PCA) to linearly reduce the dimensionality while maintaining the primary structures in the data.

Figure 2: Overview of data preprocessing and quality control (QC) pipeline.
- Different stages of QC of scRNA-seq data and the total size of count matrix in each step.
- The cell level filtering step of QC for scRNA-seq data shows the thresholds of number of genes detected per cell (nGene), the total reads per cell (nUMI), the percentage of mitochondrial genes (mitoRatio), and the percentage of ribosomal genes (riboRatio).
- Uniform Manifold Approximation and Projection (UMAP) visualization of 4,475 retinal cells by computing both nearest neighbor graph and shared nearest neighbor (SNN). Cells are colored by cluster assignments.
- Dotplot shows the expression patterns of marker genes (columns) specific to different retinal types for RGC and non-RGC clusters. Our identified clusters are shown in rows. The size of each circle represents the percentage of cells expressing the gene; the color represents the average normalized transcript count in expressing cells. The average expressions of RGC markers in comparison to non-RGC markers are higher in clusters 2, 26, 28, and 31, so they are kept for the following process.
- UMAP visualization of 4,475 retinal cells which are colored by cell-type assignments. 516 RGCs are shown in green color.
Determining how many PCs are optimal for the downstream analysis is crucial to ensure that most of the variation in the dataset is captured. We thus examined the optimal number of PCs and selected top ranked PCs that retained most of the variability in the data. We then used graph-based clustering method to identify RGC subtypes (clusters) and visualized the outcome in the uniform manifold approximation and projection (UMAP) [21] space. Applying graph-based clustering on UMAP will identify cells with similar patterns of gene expression, and thus similar PCs and UMAP scores, and will group these cells into non-overlapping clusters objectively (Figure 3A). In the UMAP space, cells that are close to each other and have many neighbors are typically grouped together using graph-based clustering, while cells that are too far apart and lay alone are considered outliers. After clustering, we identified differentially expressed markers for each cluster, which enabled us to find the biological identity of each cluster. We used FindAllMarkers() function in Seurat for this purpose. Our customized QC pipeline for single-RGCs and our scRNA-seq dataset were made publicly available in https://github.com/DM2LL/QC_RGCs and https://genenetwork.org/, respectively.
3. Results and Discussion
3.1 Single RGC clustering and RGC subtype-specific unique markers
A total of 20 PCs retained over 85% variability in the data. We selected UMAP in two dimensions to visualize the data. To partition the cells in the UMAP space, we set the reachability distance parameter (eps) to 1, which provided four clusters (Figure 3A). Using the FindAllMarkers() function in Seurat, we compared each cluster to every other cluster to look for candidate marker genes. The cells within each cluster were considered replicates, and the Wilcoxon Rank Sum test was used to assess differences in gene expression between groups. We selected the top 30 genes by average fold change across clusters for downstream analysis. Further, we identified RGC subtypes based on RGC marker genes provided in the Tran et al. study [17]. Specifically, we discovered two new RGC subtypes (clusters 0 and 3), one N-RGC subtype (cluster 1), and one F-RGC subtype (cluster 2) Two known RGC subtypes and corresponding marker genes in our dataset were N-RGCs (Satb2) and F-RGCs (Foxp2) [17].

Figure 3: Single RGC clustering and RGC subtype-specific unique markers.
- UMAP visualization of 516 RGCs which are colored by cell-type assignments.
- Dotplot display of the expression patterns of marker RGC sub-types (columns).
The size of each circle represents the percentage of cells expressing the gene; the color represents the average normalized transcript count in expressing cells. Clusters 0, 1, 2, and 3 are identified as New, N-RGC, F-RGC, and New sub-types, respectively.
3.2 Highly and differentially expressed genes
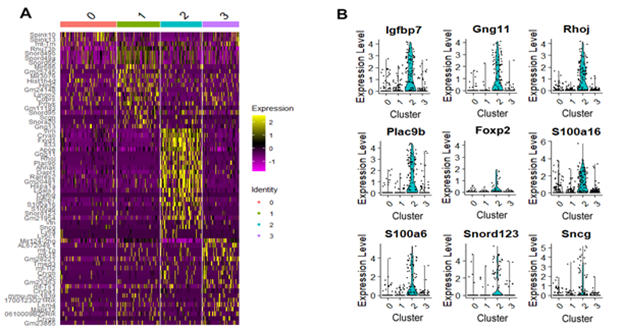
Highly expressed genes play a crucial role in cell function and often define cell type-specific characteristics. Identifying these genes is important for understanding cellular processes and identifying key regulators. We found that some RGC genes are enriched in several subtypes whereas others are subtype specific. Figure 4A shows Heatmap of the top genes differentially expressed in each cluster across all RGCs. As shown at the top of the graph, cells are sorted based on cluster identity. Differential expression genes show significant changes in expression between different cell populations or conditions. These genes are uniquely expressed or differentially regulated, providing insights into cell type diversity and functional differences. Figure 4B demonstrates Violin plots of nine differentially expressed RGC genes for cluster 2. We anticipate that Igfbp7, Gng11, Rhoj, Plac9b, S100a16, S100a6, Snord123, and Sncg RGC genes in cluster 2 are likely F-RGC subtype markers due to the expression of F-RGC subtype marker, Foxp2, in cluster 2.
3.3 Comparison between highly and differentially expressed genes with/without using proposed method
In this section, we compare top expressed RGC genes in final clusters based on our customized pipeline and if we use Seurat [22] only for QC. The objective metric for comparing our customized pipeline and Seurat pipeline is the number of RGC related genes at the end of the downstream analysis.

Figure 4: Top expressed genes in each cluster.
- Heatmap displaying the top genes differentially expressed in each cluster across all RGCs. As shown at the top of the graph, the cells are arranged based on their corresponding cluster. On the y axis, differentially expressed genes are displayed. Yellow color represents heigh expression.
- Violin plots show nine samples differentially expressed RGC genes for cluster 2.
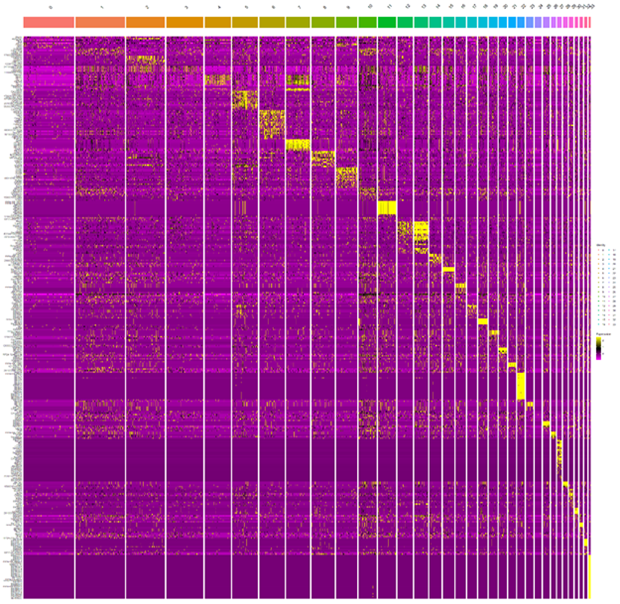
Figures 4 and 5 show heatmap corresponding to the top genes expressed in each cluster using our customized QC pipeline and Seurat package, respectively. Cells were sorted based on cluster identity as shown on top of the plot. As can be seen, using our customized pipeline led to differentially expressed genes primarily corresponding to RGCs (Figs. 4A and 4B) suggesting contamination has optimally reduced while using Seurat, most of identified differentially expressed gens correspond to non-RGC retinal cells indicating a significant level of the contamination in the data has yet remained (Figure 5).

Figure 5: Heatmap displaying top genes expressed in each cluster based on the Seurat pipeline.
X axis represents clusters of cells and y axis presents genes. Differentially expressed genes (top markers) corresponding to each cluster is shown in yellow.
4. Conclusions
In this study, we generated 5,994 single RGCs from mouse retina using Fluidigm technology, focusing on retinal ganglion cells (RGCs) by employing THY1 antibody-coated beads. We used SMART-seq v4 to generate scRNA-seq libraries with very deep phenotype. We then developed a customized computational QC pipeline to reduce various sources of contamination in single RGCs to enhance downstream biological interpretations. We applied our pipeline on the scRNA-seq data and compared our customized pipeline with widely used Seurat package and showed that our pipeline generated clusters with significantly greater number of known RGC markers compared to Seurat. We also identified several previously unknown markers for F-RGC subtype. Lastly, we made our customized QC pipeline for single RGCs and our scRNA-seq dataset publicly available to the research community for the advancement of open science.
Acknowledgments
This work was supported by the Bright Focus Foundation, NIH EY033005, and a Challenge Grant from Research to Prevent Blindness (RPB). The funders had no role in study design, data collection and analysis, decision to publish or preparation of the manuscript.
Conflict of interest
No potential conflict of interest was reported by the author(s).
References
- Macosko EZ, Basu M, Satija R, et al. Highly parallel genome-wide expression profiling of individual cells using nanoliter droplets. Cell 161 (2015): 1202-1214.
- Rheaume BA, Jereen A, Bolisetty M, et al. Single cell transcriptome profiling of retinal ganglion cells identifies cellular subtypes. Nat Commun 9 (2018):
- Li L, Fang F, Feng X, et al. Single-cell transcriptome analysis of regenerating RGCs reveals potent glaucoma neural repair genes. Neuron 110 (2022): 2646-2663
- Packer JS, Zhu Q, Huynh C, et al. A lineage-resolved molecular atlas of C. elegans embryogenesis at single-cell resolution. Science 365 (2019): 1971.
- Madadi Y, Monavarfeshani A, Chen H, et al. Artificial Intelligence Models for Cell Type and Subtype Identification Based on Single-Cell RNA Sequencing Data in Vision Science. IEEE/ACM Transactions on Computational Biology and Bioinformatics 9 (2023).
- Madadi Y, Sun J, Chen H, et al. Detecting retinal neural and stromal cell classes and ganglion cell subtypes based on transcriptome data with deep transfer learning. Bioinformatics 38 (2022): 4321-4329.
- Zheng GX, Terry JM Belgrader P, et al. Massively parallel digital transcriptional profiling of single cells. Nature communications 8 (2017):
- Satija R, Farrell JA, Gennert D, et al. Spatial reconstruction of single-cell gene expression data. Nature biotechnology 33 (2015): 495-502.
- Wolock SL, R Lopez, AM Klein, et al. Scrublet: computational identification of cell doublets in single-cell transcriptomic data. Cell systems 8 (2019): 281-291.
- McCarthy DJ, Campbell KR, L Lun AT, et al. Scater: pre-processing, quality control, normalization and visualization of single-cell RNA-seq data in R. Bioinformatics 33 (2017): 1179-1186.
- L Lun AT, Bach K, and Marioni JC, et al. Pooling across cells to normalize single-cell RNA sequencing data with many zero counts. Genome biology 17 (2016): 1-14.
- Yip SH, Wang P, Kocher AJ, et al. Linnorm: improved statistical analysis for single cell RNA-seq expression data. Nucleic acids research 45 (2017): 179-179.
- Risso D, Perraudeau F, Gribkova S, et al. A general and flexible method for signal extraction from single-cell RNA-seq data. Nature communications 9 (2018): 284.
- Qiu X, Hill A, Packer J, et al. Single-cell mRNA quantification and differential analysis with Census. Nature methods 14 (2017): 309-315.
- Cao J, Spielmann M, Qiu X, et al. The single-cell transcriptional landscape of mammalian organogenesis. Nature 566 (2019): 496-502.
- Zheng J and Wang k. Emerging deep learning methods for single-cell RNA-seq data analysis. Quantitative Biology 7 (2019): 247-254.
- Tran N M, Shekar K, Whitney I A, et al. Single-cell profiles of retinal ganglion cells differing in resilience to injury reveal neuroprotective genes. Neuron 104 (2019): 1039-1055.
- Liu Y, Zhu Y, Shi Y, et al. Deciphering Adult Neural Stem Cells with Single-cell Sequencing. Stem Cells and Development 23 (2023): 213-224.
- Yousefi S, Chen H, Ingels J, et al. Computational approaches towards reducing contamination in single-cell RNA-seq data. bioRxiv (2020).
- Hao Y, Hao S, Zheng S, et al., Integrated analysis of multimodal single-cell data. Cell 184 (2021): 3573-3587.
- McInnes L, Healy J, and Melville J. Umap: Uniform manifold approximation and projection for dimension reduction 10 (2018).
- Stuart T, Butler A, Hoffman P, et al. Comprehensive integration of single-cell data. Cell 177 (2019): 1888-1902.


 Impact Factor: * 4.2
 Acceptance Rate: 77.66%
  Time to first decision: 10.4 days
  Time from article received to acceptance: 2-3 weeks