The Need for Visualization Tools in the Electronic Health Record and in Decision Aids
Jonathan Bidwella,b, Alan Levitona*, Michele Jacksona, Ketan Manea Sayantanee Dasc, Tobias Loddenkempera
aDepartment of Neurology, Division of Epilepsy and Clinical Neurophysiology, Boston Children's Hospital and Harvard Medical School, 300 Longwood Avenue, Boston, MA, USA 02115
bAcademic Research Department, Center for Outcomes and Health Services Research
Ochsner Health, 1514 Jefferson Hwy, Jefferson, LA 70121
cUniversity of Queensland – Ochsner Clinical School, School of Medicine, Ochsner Medical Center and Ochsner Clinical School, 1401 Jefferson Hwy, Jefferson, LA, USA 70121
*Corresponding author: Alan Leviton. Department of Neurology, Division of Epilepsy and Clinical Neurophysiology, Boston Children's Hospital and Harvard Medical School, 300 Longwood Avenue, Boston, MA, USA 02115
Received: 17 June 2023; Accepted: 24 June 2023; Published: 11 August 2023
Article Information
Citation: Jonathan Bidwell, Alan Leviton, Michele Jackson, Ketan Mane, Sayantanee Das, Tobias Loddenkemper. The Need for Visualization Tools in the Electronic Health Record and in Decision Aids. Journal of Bioinformatics and Systems Biology. 6 (2023): 183-186.
View / Download Pdf Share at FacebookAbstract
For epilepsy physicians and their patients who access some of their information visually, the electronic health record’s (EHR) lack of visual displays of disease manifestations and characteristics over time, as well as risk information can be limiting. We review issues related to numeric and graph literacy and capability, visual analytics, decision-making, workload, and usability of visualization programs. This review is intended to support requests for visualization tools that can be incorporated into EHRs and also be made available as patient decision aids.
Keywords
<p>Electronic health records, Information visualization, Seizures, Clinical decision support systems, Diaries, Shared decision-making, Risk communication</p>
Article Details
1. Introduction
Standard EHR systems currently do not have longitudinal visualization tools, hindering analysis of a patient’s varying seizure occurrences over time. This letter is a plea for visualization tools that can be incorporated into EHRs and made available as epilepsy patient decision aids. Below we describe usability, cognition, and workflow considerations associated with developing visualization tools and share our experiences developing these tools.
2. The Problem
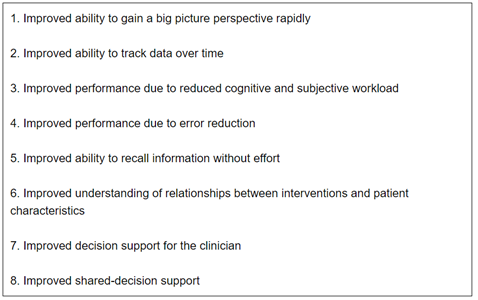
The fundamental lack of visualization options in EHRs hinders the care of patients with epilepsy. Seizure occurrence is highly variable, and response to medication changes needs to be documented and reevaluated over varying timeframes. Without the ability to see changes and relationships over time, clinicians have limited opportunities to obtain the benefits listed in Table 1. These benefits are especially relevant to caring for patients with seizures, particularly the identification of any periodicity. If the visualization is linked to recording other events, the clinician can see to what extent different types of events are related, and suggest appropriate adjustments to the patient/family (1). Furthermore, visualization of seizure frequency in conjunction with treatment adjustments help structure information on treatment response. The 'display fragmentation problem' refers to the requirement that the EHR user views multiple screens and retains information in memory or external tools rather than being able to view all relevant information together. Displaying patient-reported outcomes (PROs) graphically can significantly lower subjective workloads, allow pattern recognition, potentially reduce processing time and medical errors, and alleviate decision-making (2). User interfaces are often 'one-size-fits-all' and provide minimal customization, consequently limiting easy relationship or pattern identification within seasonal, menstrual, or other periodicities (2). By being able to customize access and analyze EHRs of similar patients, the clinician can better decide how best to treat unique patients. Cognitive task analysis, or "human factors," and ergonomics, use methods of psychology and engineering to design "all aspects of a working system to support human performance and safety"(3). Visualization tools such as ensemble displays, which show all relevant items simultaneously, are well suited for pattern recognition, uncertainty management, and tactical thinking to care for complex epilepsy patients (4).
3. Solutions
Many human beings best process information visually. Thus, visual aids can be expected to help medical caregivers and their patients who have limited ability to appreciate numerical information (5). Data visualization can benefit clinicians’ understanding of temporal changes in individual patients and multiple patients. Effective information visualization systems can “be understood at a glance and later recalled without effort”(6). Interactive data visualization, or visual analytics, “puts control into the hands of the user, where details can be obtained, and/or modified ‘on demand”(7). On occasion, clinicians face difficult therapeutic dilemmas despite clinical practice guidelines. Reviewing the EHRs of patients similar to the one in front of the clinician “can identify drugs/treatments that have helped others, especially if relevant components of their EHRs can be displayed to show what worked and what did not”(8). Patients likely benefit from interactive visualization programs that display their progress. Decision aids designed for clinical encounters can improve patients' risk perception, knowledge of their disease, decision-making skills, physician-patient relationships, and satisfaction with their care (4). The combination of brief text descriptions with visualizations improves risk perception accuracy better than either alone (5).
4. Usability
Usability, the overall satisfaction of a user interface, is assessed by measuring multiple dimensions, in particular effectiveness, efficiency, engagement, error tolerance, and ease to learn (9). Desirable attributes of an EHR system include ease of navigation, individualization, and visual clarity.
5. Knowledge discovery
"Knowledge discovery" describes the identification of relationships in large data tables. her-visualizations that improve the presentation, analysis, and understanding of data will have significant benefits (Table 1). A recent review prompted authors to suggest that future programs should:
- Summarize data, yet preserve the ability to examine the granularity of data.
- Graphically display temporal data from individuals and across EHRs.
- Appreciate when data may be uncertain, inaccurate, or missing.
- Present a single easily understood screenshot allowing users to explore information interactively.
- Be implemented with minimal training.(10)
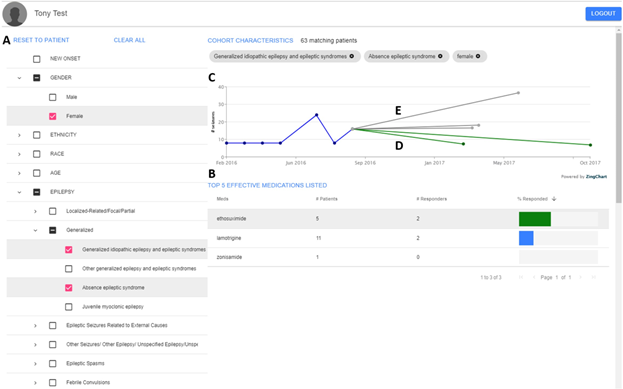
We created a prototype dashboard showing how comparable patients respond to a selected medication (Figure 1), which can be shown to patients as they participate in making upcoming treatment decisions.
6. Conclusion
Now more than ever we can and should provide patients and clinicians with visual displays that bring together contextual information in an easy-to-understand format in the EHR in a way that helps them make more informed individual and shared decisions. These displays should address the individual needs of both highly capable physicians and patients, as well as patients who have limitations.
Disclosures:
JB, AL, MJ, and TL were in part funded by the Epilepsy Research Fund. No ethics approval or consent was required for this manuscript. There are no financial disclosures or conflicts of interest to report. All authors contributed equally.
References
- Wang S, Boston R, Lawn N, et al. Revisiting an ancient legend: Influence of the lunar cycle on occurrence of first-ever unprovoked seizures. Internal medicine journal 52 (2020): 1057-1060.
- Pollack AH, Pratt W. Association of Health Record Visualizations With Physicians' Cognitive Load When Prioritizing Hospitalized Patients. JAMA network open 3 (2020):
- Senathirajah Y, Kaufman DR, Cato KD, et al. Characterizing and Visualizing Display and Task Fragmentation in the Electronic Health Record: Mixed Methods Design. JMIR human factors 7 (2020): 18484.
- Szafir DA, Haroz S, Gleicher M, et al. Four types of ensemble coding in data visualizations. Journal of vision 16 (2016): 11.
- Petrova D, Kostopoulou O, Delaney BC, et al. Strengths and Gaps in Physicians' Risk Communication: A Scenario Study of the Influence of Numeracy on Cancer Screening Communication. Medical decision making: an international journal of the Society for Medical Decision Making 38 (2018): 355-365.
- Kosslyn S. Graph Design for the Eye and Mind. Epilepsy Res 162 (2020): 106233.
- Hund M, Bohm D, Sturm W, et al. Visual analytics for concept exploration in subspaces of patient groups: Making sense of complex datasets with the Doctor-in-the-loop. Brain informatics 3 (2016): 233-247.
- Gombar S, Callahan A, Califf R, et al. It is time to learn from patients like mine. NPJ digital medicine 2 (2019): 16.
- Landauer TK. The Trouble with Computers: Usefulness, Usability, and Productivity. Cambridge, MA: The MIT Press 18 (1995): 69.
- Yang A, Arndt DH, Berg RA, et al. Development and validation of a seizure prediction model in critically ill children. Seizure 25 (2015): 104-11.
Appendix

Table 1: What adding visual displays of patient-generated data to EMRs is likely to achieve

Figure 1: Screenshot of our "Pediatric Epilepsy Patient Cohort Dashboard" showing medical outcomes among groups of pediatric patients with similar charac


 Impact Factor: * 4.2
 Acceptance Rate: 77.66%
  Time to first decision: 10.4 days
  Time from article received to acceptance: 2-3 weeks