Global Pain State Questionnaire: Reliability, Validity, and Gender Gap
Jordi Barrachina1, Javier Muriel1, Cesar Margarit1, 2, Beatriz Planelles1, Pura Ballester1, Miguel Richart-Martínez3, Esperanza Cutillas4, Thomas Zandonai5, 6, Domingo Morales7, Ana M Peiró1, 2, 8*
1Neuropharmacology on Pain and Functional Diversity, Institute of Health and Biomedical Research of Alicante, Alicante, Spain
2Pain Unit, Department of Health, Alicante-General Hospital, Alicante, Spain
3Department of Nursing, Faculty of Health Sciences, University of Alicante, Alicante, Spain
4Occupational Observatory, Miguel Hernández University of Elche, Elche, Spain
5Department of Clinical Pharmacology, Paediatrics and Organic Chemistry, Miguel Hernández University of Elche, Elche, Spain
6Mind, Brain and Behaviour Research Centre, Department of Experimental Psychology, University of Granada, Granada, Spain
7Operations Research Centre, Miguel Hernández University of Elche, Elche, Spain
8Clinical Pharmacology Unit, Department of Health, Alicante - General Hospital, Alicante, Spain
*Corresponding author: Ana M Peiró, Clinical Pharmacology Unit, Department of Health of Alicante - General Hospital Calle Pintor Baeza 12, Alicante, Spain
Received: 26 March 2021; Accepted: 06 April 2021; Published: 18 May 2021
Article Information
Citation:
Jordi Barrachina, Javier Muriel, Cesar Margarit, Beatriz Planelles, Pura Ballester, Miguel Richart-Martínez, Esperanza Cutillas, Thomas Zandonai, Domingo Morales, Ana M Peiró. Global Pain State Questionnaire: Reliability, Validity, and Gender Gap. Archives of Internal Medicine Research 4 (2021): 091-113.
View / Download Pdf Share at FacebookAbstract
Objective: To quantify patients’ pain more objectively is essential to guide an individualized therapy, all the more so in patients under long-term opioid-use. Only a thoughtful and objective understanding of risks and benefits could improve an individualized standard of care. Our aim was to assess metric reliability and validity of an integrated and self-report Global Pain Status questionnaire to quantify the impact of pain on patient’s health in a more precise manner.
Methods: A cross-sectional study was conducted to analyse the reliability, agreement, and validity of an integrated questionnaire compared to isolated scales, due to kappa statistics, intra- class and other correlation coefficients. Level of pain (intensity and relief), quality of life, most prevalent analgesic adverse events and hospital frequentation were registered in a total of 38 cases (pain unit patients) and 52 painless matched-controls.. A reduced multitrait-multimethod matrix and a canonical-correlation analysis were developed together with a multiple linear regression.
Results: Cases (56 ± 10 years old, 63% females, pain intensity 66 ± 23 mm, incidence rate of 5 adverse events) represented a regular pain population. A high intraobserver correlation (r0.75- 0.88, weighted-κ 0.41–0.51, unweighted-κ 0.66-0.82) was evidenced together with significant correlation coefficients in test-retest reliability, and for validity, even more, in a reduced multitrait-multimethod matrix (>0.8) and canonical-correlation (>0.95). A gender gap was evidenced in cases’ companions, mostly middle-aged females (78%), who experienced negative effects on their health.
Conclusions: The Global Pain Status questionnaire is an evaluation instrume
Keywords
Reliability, Validity, Chronic Pain, Gender, Analgesic Response
Reliability articles; Validity articles; Chronic Pain articles; Gender articles; Analgesic Response articles
Article Details
Abbreviation:
GPSq: Global Pain State questionnaire; CNCP: Chronic Non-Cancer Pain; AEs: Adverse Events; PC: Patients’ Companions; PU: Pain Unit; CC: Clinical Units; VAS: Visual Analogue Scale; EQ: EuroQol; MEdDRA: Medical Dictionary for Regulatory Activities; ICC: Intraclass Coefficient Correlation; κ: Kappa; ANOVA: Analysis of Variance; IRB: Institutional Review Board
1. Introduction
Pain is the most common physical symptom that occurs in medicine representing a substantial burden for the individual patient and medical care [1]. However, pain as a multifaceted outcome is still an underestimated health problem with high interindividual variability in analgesic response [2]. One of the challenges when using opioids is to improve their safety profile, since it is still the leading cause of treatment abandonment [3]. Polypharmacy is very frequent in pain management and side effects that often are underestimated or misinterpreted as they may mimic underlying causes of pain co-morbid conditions [4], fostering a prescribing cascade [5]. Developing a better understanding of such differences and the mechanisms that support them is the basis for optimising pain treatment on an individual-by- individual focus. The first step for this understanding is the use of objective and validated tools to quantify the impact of pain on the patient’s health in a more precise manner [6].
Nowadays, there are multiple instruments to assess chronic pain [7]. However, questionnaires separately assess effectiveness variables (pain and functional impact as in Brief Pain Inventory) and, on the other, pharmacological secondary effects such as UKU side effect rating scale. What´s more, most of them are “hardly likely to exploit the discriminative capacity of most people in terms of their perceived welfare” [8], are too restrictive, not self-reported, and require precious clinical time and they are thus scarcely used in standard pain care [9].
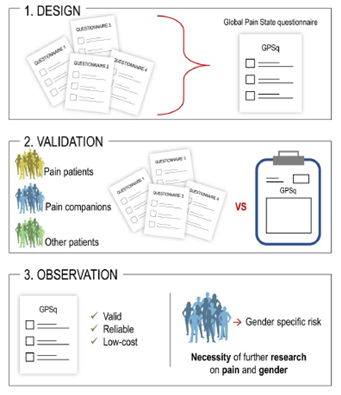
Therefore, there is a need for easy-to-use questionnaires that quickly check the patient's general pain status and analgesic side-effects, which reliably measures, and able to assess patients interindividual differences in clinical routine. What’s more, instruments need to be easy to use and understand in order to facilitate patient´s collaboration, saving time for the healthcare physicians. Hence, the possibility of using a self-report and integrated questionnaire that incorporates the most used and validated scales in pain management [10] would be interesting. The purpose of this study was to assess metric reliability – in terms of constancy and accuracy of the results on different occasions- and validity – in terms the degree to which an instrument measures the variable it has been designed for - of an integrated Global Pain Status questionnaire (GPSq) to be used in standard pain care.
2. Materials and Methods
2.1 Study design
A cross-sectional study was conducted at the Pain Unit of the Department of Health of Alicante-General Hospital (Alicante, Spain) from October 2015 to July 2016. Ethics Committee approved the study that was carried out following the ethical guidelines of the Declaration of Helsinki. This study was approved by the appropriate Institutional Review Board (IRB) and written informed consent was obtained from all subjects. This manuscript adheres to standardised questionnaire validation methods.
2.2 Participant selection
A consecutive sampling method was used open to CNCP outpatients, in the waiting room, before any medical practice was conducted. Once a week during a month (from 10-12 a.m.), patients were informed about the purpose of the study. Interested individuals were asked to complete on their own a routine questionnaire consisting of clinical assessment measures (isolated questionnaires) and the integrated (GPSq) under study, with 10 minutes of washout period. Supplementary Material Figure 1 illustrates the GPSq questionnaire (Spanish and English versions). At the same time, researchers offer the possibility of participating in the study on pain unit outpatient painless matched-controls divided into two groups: a) patients’ companions (PC) with potential common life style or dietary habits; and b) outpatient patients from another three clinical units (CC: cardiology, haematology, and orthopaedic surgeon). Inclusion criteria were: adult (≥18 years old), under long-term pain therapy at the PU (stable for six months or longer), previous diagnosis of CNCP verified by record review, according to medical standard care, an adequate mental status for properly filling in the scales and questionnaire, and agreement with verbal consent. Two control-matched groups (age, sex, and geographical area) comprising painless individuals included: PC (n=27, subjects from cases’ companions) and CC (n=25, patients from three other clinical Units who usually collaborate with our Pain Unit). The exclusion criteria were people that do not fulfil inclusion criteria or an inability to complete the tasks.
2.3 Instrument design
GPSq items were selected through a multi-step process: 1) review of the existing literature about most frequently used validated scale suggested by the Spanish Pain Society; 2) patient interviews and focus group of 20 patients in a PU outpatient environment (these patients were selected two weeks before recruitment started); 3) examination by the research group of the focus group; 4) item writing and selection revised by the group; and 5) examination of the inventory by seven independent experts in pain management, for content validity. This questionnaire was used at previous research projects in a different set of pain patients at our PU [10, 11].
2.4 Variables
After verbal consent to participate, questionnaires were self-administered under the supervision of a researcher, assessing socio-demographic (age, gender, height, weight, employment situation, and education level), clinical and safety pain-related variables [12].
2.4.1 Clinical variables: A hard copy version of the Visual Analogue Scale (VAS), consisting of a 100mm horizontal line anchored by two extremes, where 0 means ‘‘no pain’’ and 100mm is ‘‘worst pain imaginable”, and a 5-scores Likert categorical scale were full fight from 0 “none”, 1 “mild”, 2 “moderate”, 3 “severe” and 4 “extremely severe pain” [13] were used to record pain intensity and relief [14, 15]. Quality of life was registered due to EQ-VAS (0-100mm) and EQ-5D questionnaire (maximum value is 1 “best” and 0 “worst” state of health imaginable), it includes five questions regarding mobility, personal care, daily activities, pain and anxiety/depression dimensions, that allows us to obtain the final score [16].
2.4.2 Safety variables: Patients were encouraged to report all AEs in which pain medication was suspected (any noxious, unintended, or undesired effect of a drug that occurs at dosages used in humans for prophylaxis, diagnosis, or therapy). Most frequent opioid AEs were listed including open fields for patients to include any other. All reports were classified following the Medical Dictionary for Regulatory Activities (MedDRA) for the coding of clinical data in AEs reports [17]. Even more, hospital admission, frequentation, and drug prescription change (due to pain or other reasons) were asked.
2.5 Procedures
The completion of isolated scales and GPSq was performed in the clinical units to which participants belonged, administered in a random order following sequence: A (first GPSq, second control-isolated scales) and B (opposite order). Test-retest reliability was examined 10 minutes apart, firstly one questionnaire and after that period, patients must complete the next. This short time was fixed in an effort to capture a constant pain level [18]. All were registered in a single session lasting 15 minutes. Each study participant was provided with instructions by four researchers who had a previous experience minimum of six months in medical pain routine. Hence, intra-observer reliability was evaluated.
2.6 Reliability evaluation
Reliability was measured according to the maintenance of constancy in participants’ answers [19] in a minimum sample size of 35 participants. This was calculated based on parameter estimation of an intra-class correlation coefficient (ICC, 0.85, 95% CI with of 0.20 scores) and a 10% loss to follow-up. Intra-rater reliability, a metric for rater’s self- consistency, was used to assess in a continuous clinical measurement [20]. It is considered as reproducible if the same rater, under the same conditions and with repeated scores, shows a non-significant rater variation [21].
2.6.1 Cohen´s kappa coefficient for categorical variables: This κ coefficient measures agreement between two raters (intra-rater reliability) who classify N items into C mutually exclusive categories in categorical variables (Likert pain and relief intensity). Weighted κ coefficient is related to the level of disagreement between raters, whilst unweighted κ coefficient indicated how different the scores are. κ values range between -1 (“no agreement”) and 1 (“complete agreement”). Thus, correlation can be “poor” (κ between -1 and 0), “slight” (0.01-0.2), “fair” (0.21-0.4), “moderate” (0.41-0.6), “substantial” (0.61-0.8) or “almost perfect” (0.81-1).
2.6.2 Intraclass correlation coefficient (ICC) for continuous variables: This is a measurement of the total variance of the sample, which includes the differences among raters, subjects, and the unexplained residual variance. Both, ICC and weighted-κ scores may be interpreted according to the following values: “chance” (0), “poor” (0 to 0.19), “fair” (0.20 to 0.39), “moderate” (0.40 to 0.59), “substantial” (0.60 to 0.79), and “almost perfect” (0.80 to 1.0) agreement [22].
2.7 Validity evaluation
2.7.1 Responsiveness or sensitivity to change: This is the ability of an instrument to detect changes in the attribute or variable that is measured over time and related to the magnitude of the difference in the subject’s scores [23]. To assess the responsiveness, effect size technique was performed. Cramer’s V considered values were <0.07 “small”, >0.21 “medium” and >0.35 “large”. Eta-squared considered values were <0.02 “small”, >0.13 “medium” and >0.26 as a “large” effect.
2.7.2 Content validity: Questionnaire items were selected initially by two pain unit anaesthesiologist clinicians (CM, LG), two clinical pharmacologists (JH, AP), two pharmacists (JM, PB) and one biotechnologist (BP) as a group of experts due to: clarity (easily understood), coherence (related with that which it is intended to evaluate), relevance (to evaluate that which is intended) and sufficiency (to fully assess that which is intended). Half the experts account for more than 20 years of healthcare, teaching, and research experience [24].
2.7.3 Criterion validity-correlation: Correlations were assessed using Spearman’s (non-parametric variables) or Pearson’s (parametric variables). Paired two-sided student’s t-tests were used for a comparison of the means of normally distributed parameters. A “moderate” (>0.5) or “strong” (>0.7) correlation were considered. Given the direction of the scales, VAS pain intensity was expected to demonstrate a “strong” negative correlation (r≥−0.70) with VAS pain relief and a “moderate” negative correlation (r≥−0.40) with VAS quality of life. In the same way, a “moderate” to “strong” positive correlation (r≥0.50) would be expected between VAS pain relief and VAS quality of life.
2.7.4 Construct validity: An instrument is validated when it correlates with another through variables that should be related. The unrelated ones can be obtained with (i) known-groups validity that is a type of construct validity which measures the ability of an instrument to distinguish and between different groups [25], and (ii) convergent and divergent validity that evaluates the sensitivity and the divergent specificity of the instrument [26].
2.7.5 Reduced multitrait-multimethod matrix: It was performed to provide evidence of validity about the pain and quality of life items to prove convergent and divergent hypotheses through three concepts (pain intensity, relief, and quality of life) and two methods (VAS and Likert). In this type of matrix, convergent validity refers to the fact that the correlation between the same trait (e.g. pain intensity) with a different method (e.g. VAS or Likert) will show the highest correlations [25]. Values >0.5 will be considered “moderate” and >0.7 “strong” correlation.
2.7.6 A canonical-correlation analysis: The Common between two sets of variables was calculated to infer information from cross-covariance matrices. This analysis will try to find linear combinations of the two vectors X (case) = (X1, …, Xn) and Y (control) = (Y1, …, Ym) which have a maximum correlation with each other. Data is showed by plotting them as heliographs, a circular format with ray-like bars, with each half representing the two sets of variables for better visualisation.
2.8 Statistical analysis
Sample size was calculated due to 10 participants per item evaluated as described in other studies [27]. Therefore, at least 50 subjects were required for the five- items (VAS pain intensity, relief, and quality of life; 5-Likerts points for pain intensity and relief). The assumption of normality was tested with the Kolmogorov Smirnov test with the correction of Lilliefors. Data were expressed as mean ± standard deviation or as median (P25- P75) for parameters with non-normal distribution. Whether two groups were compared, differences for numerical or ordinal data were evaluated with T-test or Mann-Whitney test, and one-way analysis of variance or Kruskal-Wallis ANOVA-test whether we compared three groups, according to normality. χ2 and Fisher’s Exact test were used to compare groups for categorical data, depending on whether two or three groups were analysed. The effect size was calculated. Multiple linear regression was carried out to analyse the influence of the following factors: pain intensity, quality of life, age, sex, and number of AEs over pain relief. Floor and ceiling effects were performed, defined as the percentage of patients with the lowest and highest score in the categorical variables (Likert pain intensity and relief). The alpha level that defines statistical significance was 0.05 (p-value<0.05). Statistical analyses were performed on R 3.2.0.
3. Results
A total of 65 patients pre-screened at the Alicante Hospital Pain Unit met the inclusion criteria, of which 52 agreed to participate. Of the latter, 14 patients were excluded as some data on the questionnaires were missing. Thus, 38 cases and all controls finished the study (PC control group n=27, CC control group n=25) (Figure 1).

Figure 1: Flow chart.
3.1 Participant
Demographic, clinical, and safety data are reported in Table 1. Participants were mainly middle-aged (range 56-65 years) women (63-78%), with secondary school certificate (more than 45%) and retired (48-65%). Participants were predominantly female representing 78% of cases companions. No other differences were observed in the other demographic variables registered in the present study.
3.2 Clinical variables
As expected, cases showed the highest significant pain intensity (66 ± 23 mm) compared to controls (PC and CC, 44 ± 20 and 41 ± 29 mm, p-value=<0.0001) with a large effect size (0.243). Cases and their PC companions showed similar scores for VAS pain relief (mean range 39-41 mm) and significantly different from CC (65 mm, p<0.05). Furthermore, the CC group showed the highest EQ-5D quality of life (0.68 ± 0.23 scores) with differences around 0.20 scores from PU and PC (p-value=0.0064, effect size=0.257), mostly related to mobility and pain areas (Supplementary Material Table 1). Thus, caregivers showed lower quality of life outcomes than patients from other clinical units (PC vs. CC, 0.51 ± 0.24 vs 0.68 ± 0.23, p- value=0.0064, effect size=0.257). Cases and their companions showed similar hospital services use rates but significantly different from CC related to hospital frequentation. They visited more frequently emergency room (PU, PC and CC, 27%, 16% and 0%, respectively, p-value=0.008, large effect size=0.38) with higher hospital admission rates (25%, 21% and 0%, respectively, p-value=0.006, large effect size=0.49).
3.3 Safety variables
Table 2 and Supplementary Material Figure 2 illustrated a total of 247 AEs registered in the study. Half of the cases demonstrated almost one AE (incidence rate 5 AEs/case) with a median AEs number of 2 (IQR, 1-5). This was significantly higher than controls (p-value=0.031, effect size=0.144) and in a similar range than our typical PU population [28]. Cases vs. control (PC-CC) showed a significant higher degree of xerostomia (50% vs. 0-15%, p-value=<0.0001), constipation (39% vs. 8-15%, p-value=0.0195), dry skin (29% vs. 4-15%, p-value=0.043) and somnolence (23% vs. 0-18%, p-value=0.0192). It is interesting to point out that all participants suffer from a similar prevalence of insomnia (20-25%), depression (15- 17%). Furthermore, a consistent high prevalence was found for cases and their companions vs. CC in weight change (15-23 vs. 8%), loss of appetite (10-21 vs. 4%), edema (13-15% vs. 0%) and loss of libido (5-6 vs. 0%).
3.4 Multiple linear regression
Cases and their companions did not show any statistically significant relation of some variables (pain intensity, quality of life, age, sex, and number of AEs) over their pain relief. However, the CC group evidenced a negative correlation of pain relief with pain intensity and a positive correlation with the quality of life (Supplementary Material Table 2).
3.5 Reliability analysis
Results showed high intra-observer reliability and agreement between GPSq and isolated scales (Table 3). Substantial agreement was found between VAS pain intensity (>0.7), relief (>0.8), and quality of life (EQ-VAS 0.88; EQ-5D 0.86). The agreement of Likert pain intensity achieved a moderate weighted-κ coefficient (0.41, the limit of an acceptable correlation), but also a substantial unweighted-κ (0.66). Furthermore, Likert pain relief obtained a moderately weighted-κ (0.51) and an almost perfect unweighted-κ (0.82).
3.6 Validity analysis
3.6.1 Responsiveness or sensitivity to change: Results suggested GPSq good responsiveness through effect size (Table 1). A large effect size was evidenced in pain intensity (VAS, 0.243), quality of life (EQ-5D, 0.257), and number of AEs (0.144). Furthermore, a medium effect size in sex (0.124) and pain relief (0.093) was found according to the expected differences between groups.
3.6.2 Content validity: Experts chose the items that formed the GPSq questionnaire due: easy to understand (clarity), able to evaluate pain intensity adequately (related to that which it is intended to evaluate). Besides, the items were isolated used in our population showing good results (essential to evaluate what is intended) and allowing an idea of the patient’s state of pain to be obtained (enough to fully assess that which is intended) [29, 30].
3.6.3 Criterion validity-correlation: Table 4 represents the intra-rater correlation between the GPSq questionnaire and isolated scales. Spearman correlation coefficients (pain scores and quality of life) ranged from 0.72 to 0.90, Spearman correlation coefficients (pain scores and quality of life) ranged from 0.72 to 0.90, in this case, Spearman correlation was used, since both variables did not comply with the assumption of normality. It has been found that when VAS pain intensity increased, a decreased score was found for: (i) pain relief at a moderate level (GPSq [r =0.52], isolated scales [r=0.35], and both [r=0.29]); and (ii) quality of life at a mild level (r=0.22, r=0.21 and r=0.28, respectively). This VAS pain intensity increases and also associated Likert pain intensity increase to a strong degree (r=0.81, r=0.83, and r=0.75, respectively). Furthermore, GPSq VAS pain relief increases induce a quality of life increase to a moderate degree (r=0.45). On the other hand, the correlation between GPSq and isolated scales regarding the same variables were high at pain intensity (VAS [r=0.91], Likert [r=0.9]) and pain relief (VAS [r=0.82], Likert [r=0.83]). The highest correlation was found for the quality of life (EQ-VAS [r=0.88], EQ-5D [r=0.98]). Thus, participants did not change their answers depending on the scale (GPSq or the isolated ones).
|
Self-Reportedey Pantients |
||||
|
Population |
Case |
Control |
P-value |
|
|
Variables |
PU (n=38) |
PC (n = 27) |
CC (n = 25) |
|
|
Sex (female, %) |
63 |
78*X |
65 |
.031a |
|
.124I |
||||
|
Age, mean (SD), yeas old |
56 (10) |
65 (15) |
62 (15) |
.268b |
|
.09II |
||||
|
Pain intensity, mean (SD), VAS mm |
66 (23)*** |
44 (20) |
41 (29) |
.0001b |
|
.243III |
||||
|
Pain relief, mean (SD), VAS mm |
41 (28)++ |
39 (23)XX |
65 (26) |
.0005b |
|
.093III |
||||
|
Likert pain intensity (%) |
||||
|
None |
0 |
0 |
12 |
.417c |
|
Mild |
11 |
26 |
24 |
3.81 |
|
Moderate |
44 |
39 |
12 |
102 |
|
Severe |
37 |
26 |
20 |
.35I |
|
Extreme severe |
11 |
9 |
16 |
|
|
Likert pain relief (%) |
||||
|
EQ-VAS, mean (SD), mm |
52 (21) |
57 (18) |
60 (25) |
.852b |
|
.003III |
||||
|
EQ-5D, score, mean (SD) |
0.48 (0.19) |
0.51 (0.24) |
0.68 (0.23) |
.0064d |
|
.257III |
||||
|
Adverse Events, median [IQR] |
2 [1-5]** |
1.5 [0-3] |
1 [0-2] |
.031e |
|
. 144III |
||||
|
Due to pain |
||||
|
Emergency visit (%) |
11 |
5 |
4 |
.082a |
|
.255I |
||||
|
Hospital admission (%) |
8 |
5 |
4 |
.677a |
|
.066I |
||||
|
Change of drug (%) |
21 |
16 |
8 |
.193a |
|
.36I |
||||
|
Due to other causes |
||||
|
Emergency visit (%) |
27++ |
16X |
0 |
.008a |
|
.38I |
||||
|
Hospital admission (%) |
25++ |
21XX |
0 |
.006a |
|
.49I |
||||
|
Change of drug (%) |
9 |
7 |
0 |
.134a |
|
.23I |
||||
Note: SD: Standard Deviation; IQR: Interquartile Range; VAS: Visual Analogue Scale; EQ-VAS: EuroQol scale; EQ-5D:
EuroQol-5D. P-value < 0.05 is written in bold font. Cases vs. controls (PC and CC): p-value *<0.05, **p-value <0.01, p-value***<0.001 Cases vs. control (CC): +p-value<0.05, ++p-value <0.01,Control PC vs. CC: Xp-value<0.05, XXp-value<0.01
1 Floor effect (%) patients with the lowest score; 2 Ceiling effect (%) patients with the highest score.
a Fisher’s exact test; b One-way ANOVA; c Chi-Square Test; d Kruskal-Wallis test; e Mann-Whitney Test. Estimation of Effect size: I Cramer’s V; II Eta squared for One-Way ANOVA; III Eta squared for Kruskal Wallis Test.
Table 1: Demographic, clinical and pharmacological data related to cases (pain unit patients, PU) and controls (patients’ relatives (PC) and patients from other clinical units (CC)).
|
Case |
Control |
P-value |
||
|
Adverse events (%) |
PU (n = 38) |
PC (n = 27) |
CC (n = 25) |
|
|
Xerostomia |
50*** |
15 |
0 |
<0.001 |
|
Constipation |
39** |
15 |
8 |
0.0195 |
|
Dizziness |
35 |
10 |
16 |
0.1366 |
|
Dry skin |
29* |
15 |
4 |
0.043 |
|
Headache |
29 |
10 |
12 |
0.2036 |
|
Somnolence |
23++ |
18xx |
0 |
0.0192 |
|
Insomnia |
23 |
25 |
20 |
0.4268 |
|
Weight change |
23 |
15 |
8 |
0.262 |
|
Loss of appetite |
21 |
10 |
4 |
0.1509 |
|
Depression |
17 |
15 |
16 |
0.9808 |
|
Nervousness |
16 |
15 |
0 |
0.068 |
|
Pruritus |
13 |
0 |
4 |
0.1874 |
|
Nauseas |
13 |
5 |
4 |
0.4129 |
|
Edema |
13 |
15 |
0 |
0.1492 |
|
Vomiting |
10 |
5 |
0 |
0.2816 |
|
Erectile dysfunction |
8 |
0 |
0 |
0.2166 |
|
Loss of libido |
6 |
5 |
0 |
0.4273 |
|
Erythema |
4 |
0 |
0 |
0.4736 |
|
Incidence rate AE/patient |
5 |
2 |
0.5 |
0.3294 |
Control PC vs. CC: Xp-value<0.05, XXp-value<0.01, P-values < 0.05 are written in bold font. P-values were obtained through Chi-square test. Cases vs. controls (PC and CC): p-value *<0.05, **p-value <0.01, p-value***<0.001 Cases vs. control (CC): +p-value<0.05, ++p-value <0.01++
Table 2: Frequency of adverse events self-reported by cases (pain unit patients, PU) and controls (patients’ relatives (PC) and patients from other clinical units (CC)).
|
Clinical variable |
Scale |
Reliability test-retest |
|
VAS |
0.761 |
|
|
Pain intensity |
Likert |
0.412 / 0.663 |
|
VAS |
0.811 |
|
|
Pain relief |
Likert |
0.512/ 0.823 |
|
VAS |
0.881 |
|
|
Quality of life |
EQ-5D |
0.861 |
VAS: Visual Analogue Scale (0-100 mm); EQ-5D: EuroQol-5D (0-1 score)
1 Intraclass Correlation Coefficient; 2 weighted Kappa; 3 unweighted Kappa.
Table 3: Reliability of test-retest analysis. Results of Intraclass Correlation Coefficient (ICC) for continuous variables, and Cohen’s Kappa (weighted and unweighted) for continuous variables.
|
Correlations between GPSq scales |
|||||||
|
|
Pain intensity |
Pain relief |
Quality of life |
||||
|
VAS |
Likert |
VAS |
Likert |
VAS |
EQ-5D |
||
|
Pain intensity |
VAS |
1,000 |
0,814 |
-0,529 |
-0,554 |
-0,217 |
-0.373 |
|
Likert |
0,814 |
1,000 |
-0,531 |
-0,527 |
-0,165 |
-0.528 |
|
|
Pain relief |
VAS |
-0,529 |
-0,531 |
1,000 |
0,912 |
0,446 |
0.531 |
|
Likert |
-0,554 |
-0,527 |
0,912 |
1,000 |
0,469 |
0.47 |
|
|
Quality of life |
VAS |
-0,217 |
-0,165 |
0,446 |
0,469 |
1,000 |
0.494 |
|
EQ-5D |
-0,373 |
-0.528 |
0.531 |
0.47 |
0.494 |
1 |
|
|
Correlations between isolated scales |
|||||||
|
Pain intensity |
VAS |
1,000 |
0,833 |
-0,346 |
-0,515 |
-0,214 |
-0.244 |
|
Likert |
0,833 |
1,000 |
-0,410 |
-0,414 |
-0,263 |
-0.355 |
|
|
Pain relief |
VAS |
-0,346 |
-0,410 |
1,000 |
0,802 |
0,372 |
0,072 |
|
Likert |
-0,515 |
-0,414 |
0,802 |
1,000 |
0,367 |
0.156 |
|
|
Quality of life |
VAS |
-0,214 |
-0,263 |
0,372 |
0,367 |
1,000 |
0,430 |
|
EQ-5D |
-0.244 |
-0.355 |
0,072 |
0,156 |
0,430 |
1,000 |
|
|
Correlations between GPSq and isolated scales |
|||||||
|
Pain intensity |
VAS |
0,911 |
0,754 |
-0,290 |
-0,447 |
-0,282 |
-0.363 |
|
Likert |
0,702 |
0,900 |
-0,313 |
-0,487 |
-0,401 |
-0.512 |
|
|
Pain relief |
VAS |
-0,294 |
-0,447 |
0,820 |
0,801 |
0,458 |
0.512 |
|
Likert |
-0,365 |
-0,284 |
0,756 |
0,833 |
0,542 |
0.424 |
|
|
Quality of life |
VAS |
-0,379 |
-0,350 |
0,176 |
0,159 |
0,886 |
0.419 |
|
EQ-5D |
-0,266 |
-0,355 |
0,152 |
0,156 |
0.464 |
0,978 |
|
VAS: Visual Analogue Scale; EQ-5D: EuroQol-5D
Pearson correlation measures the degree of linear relationship between two parametric variables (VAS) and assuming a normal distribution of the variables; and Spearman correlation between two non- parametric variables (Likert). Correlations between the same scales are written in grey background. The diverging average correlation (italics) is 0,38 and the convergent (bold) is 0.88.
Table 4: Correlation intra e inter-scales between GPSq and isolated scales.
3.6.4 Construct validity: GPSq could distinguish and detect significant differences between cases and control scores groups (Table 1) related to pain level and safety variables. Furthermore, correlations between the same traits (pain intensity and relief) but dissimilar methods showed the largest correlation with higher scores (0.8), except for the correlation between pain relief (VAS and Likert [0.521]) as it is supposed to be (Supplementary Material Table 3). As explained above, the highest correlation was evidenced between the same trait (pain intensity) and different methods (VAS [r = 0.936], Likert [r = 0.833]); and the lowest between different traits and methods (r=0.190). As we hypothesised, the second-largest correlation was found between the same method and different traits (Likert, mean 0.46; maximum 0.554); and lowest (mean 0.324) between different traits and methods. Discriminant validity was confirmed due to correlations with different traits, and the same or different methods (GPSq, VAS pain intensity and Likert pain relief [r = 0.190]).
3.6.5 Canonical-correlation analysis: Supplementary Material Figure 3 showed that the two sets of random variables were highly correlated as cor (A1, B1) = 0.999, and cor (A2, B2) = 0.956.
4. Discussion
GPSq demonstrated adequate validity and reliability indicators to be used with confidence in outpatient patients experiencing CNCP. Considering the need for an objective and precise measurement tool for revealing CNCP patients’ statuses patients, this study provides a questionnaire that easily assesses pain condition thanks to clear, simple language. Furthermore, a gender gap was found in pain patients’ caregivers that highlights the need for support interventions taking gender-specific risk factors into account. Metric validity was confirmed through known groups’ expected differences. Here, cases referred to higher pain intensity and more AEs than the control group, as it is usual in our polymedicated pain population [12, 31]. Surprisingly, a gender gap was found in the cases’ companions. Our data showed that female middle-aged women were the predominant providers of informal care for family members. What’s worse, when women are the patients (as of our 63% Pain Unit cases), their sisters or daughters took this role maintaining the implicit gender stereotypes. This can be due to the unequal distribution of responsibilities due to societal and cultural demands that persist on women [32] who experience a higher caregiver burden [33] with a high impact on their health [34] being at high risk of a wide spectrum of hidden morbidities [35, 36]. A tailored-made gender perspective research should be incorporated in pain management highlighting the need to analyse research results by gender [37].
4.1 Reliability and validity
Reliability shows the homogeneous nature of the questionnaire tested, indicating that individuals reported identical pain scores at both time intervals due to the high ICC results (VAS pain, relief, and quality of life, mean correlation r>0.8). What’s more, high κ correlations showed that there was little difference between measurements (VAS, Likert). Also, an instrument for clinical decision-making is considered valid when Pearson or Spearman correlation coefficients are high [38]. In the present study, all clinical variables evaluated had a coefficient correlation higher than r=0.8, almost perfect for the quality of life (r=0.978). Thus, our data also provide metric validity to the GPSq and confirm its convergent/discriminant validity. In addition, results showed a higher correlation with the rest of clinical variables (pain, quality of life) through a Likert evaluation than by a line at VAS to record pain. This increases the accuracy or our objective GPSq measure. Our questionnaire’s content validity was performed in line with experts’ criteria in CNCP management which constitutes the importance of its use-value and justification [39]. Consequently, our findings indicated that when used under the same conditions, as described in our methodology, clinicians could use the GPSq with confidence in terms of its validity. Furthermore, using integrated and self-reported GPSq instead of isolated scales could be more practical for the patient, since it only fills in a page with all the scales integrated, and also for the doctor who can interpret the questionnaire more clearly and quickly.
4.2 Limitations
The GPSq questionnaire consists of validated scales since it allows us to ascertain the patient’s condition in several health areas in just one medical appointment. However, some limitations should be taken into account. Firstly, the total number of subjects studied was relatively small and this can compromise the ability to find differences. A minimum number was calculated using a "convenience sample" of patients attending the pain clinic. This may compromise valid statistical analysis.
Secondly, control patients were divided into two groups (cases’ companions and patients from other units) due to the differences observed. This could place constraints in terms of an inappropriate choice of control group because the partners of the patients cannot be completely independent controls. What’s more, AEs may be due to pain treatment, or concomitant medical conditions. This could introduce a bias [36] mediated by several other variables (socio-demographic or cultural variables, or what’s more, ethnicity) [32] which are more relevant than pain status. Finally, EQ-5D scale was used instead of SF12 -that provides a wide broad coverage of different health domains [40] in order to obtain the VAS quality of life score, an item comparable with others VAS records. In fact, we used the GPSq questionnaire in previous studies, in different pain population at our Pain Unit, with optimal results and low cost of resources [10, 11].
5. Conclusions
This study formally established that the GPSq shows good psychometric properties of reliability, validity, and responsiveness, enabling it to be used to measure CNCP in outpatient pain settings. Furthermore, a gender gap was demonstrated due to the difficult situation of female caregivers which should be recognized, devoting more effort to supporting their health.
Author Contributions
Jordi Barrachina, Javier Muriel, Cèsar Margarit, Beatriz Planelles, Pura Ballester, Thomas Zandonai, and Ana Maria Peiró were involved in the conception and design of the study. Jordi Barrachina, Javier Muriel, Miguel Richart, Domingo Morales, and Ana Maria Peiró were involved in the analysis and interpretation of the data. Jordi Barrachina, Javier Muriel, Miguel Richart Martínez, Domingo Morales and Ana Maria Peiró designed the statistical analysis plan. Jordi Barrachina, Beatriz Planelles and Ana Maria Peiró wrote this manuscript. All authors were involved in drafting of the paper and revising it critically for intellectual content. All authors approved of the final version of this manuscript and agree to be accountable for all aspects of the work.
Acknowledgments
We would like to express our thanks for the help received from Mrs. Miriam Coves (Occupational Therapy pain care assistant, Alicante, Spain), Emi Martínez, Pharm D (Pharmacy Fellowship), M-del-Mar Inda Ph. Sci (Pain researcher) for their support in data management and paper corrections, and Mrs. Marie Gombert (M.Sc., Department of Paediatrics, Obstetrics and Gynaecology, University of Valencia, Valencia, Spain) for her help with the Graphical Abstract.
Conflict of Interests
All authors declare there is no conflict of interests.
References
- Hasselström J, Liu-Palmgren J, Rasjö-Wrååk G. Prevalence of pain in general practice. European Journal of Pain 6 (2002): 375-385.
- Gureje O, Von Korff M, Simon GE, et al. Persistent pain and well-being: A World Health Organization study in primary care. Journal of American Medical Association 280 (1998): 147-151.
- Vadivelu N, Kai AM, Kodumudi V, et al. The Opioid Crisis: a Comprehensive Overview. Current Pain and Headache Reports 22 (2018): 16.
- Oscanoa TJ, Lizaraso F, Carvajal A. Hospital admissions due to adverse drug reactions in the elderly. A meta-analysis. European Journal of Clinical Pharmacology 73 (2017): 759-770.
- Ponte ML, Wachs L, Wachs A, et al. Prescribing cascade. A proposed new way to evaluate it. Medicina (B. Aires) 77 (2017): 13-16.
- Jensen MP, Karoly P. Self-Report Scales and Procedures for Assessing Pain in Adults, in: Handbook of Pain Assessment (2010): 15-34.
- Dansie EJ, Turk DC. Assessment of patients with chronic pain. British Journal of Anaesthesiology 111 (2013): 19-25.
- Cummins R, Gullone E. Why we should not use 5-point Likert scales: The case for subjective quality of life measurement. Paper presented at: Proceedings, Second Int Conf Qual Life Cities 74 (2000): 93.
- Hasson D, Arnetz BB. Validation and Findings Comparing VAS vs. Likert Scales for Psychosocial Measurements. International Electronic Journal of Health Education 8 (2005): 178-192.
- Planelles B, Margarit C, Inda M del M, et al. Gender based differences, pharmacogenetics and adverse events in chronic pain management. The Pharmacogenomics Journal 20 (2020): 320-328.
- Muriel J, Margarit C, Barrachina J, et al. Pharmacogenetics and prediction of adverse events in prescription opioid use disorder patients. Basic Clinical Pharmacology & Toxicology 124 (2019): 439-448.
- Planelles B, Margarit C, Ajo R, et al. Health benefits of an adverse events reporting system for chronic pain patients using long-term opioids. Acta Anaesthesiologica Scandinavica 63 (2019): 248-258.
- Von Korff M, Ormel J, Keefe FJ, et al. Grading the severity of chronic pain. Pain 50 (1992): 133-149.
- Herr K, Titler M, Fine P, et al. Assessing and Treating Pain in Hospices: Current State of Evidence- Based Practices. Journal of Pain Symptom Management 39 (2010): 803-819.
- van Grootheest K, Olsson S, Couper M, et al. Pharmacists’ role in reporting adverse drug reactions in an international perspective. Pharmacoepidemiology & Drug Safety 13 (2004): 457-464.
- Herdman M, Badia X, Berra S. EuroQol-5D: a simple alternative for measuring health-related quality of life in primary care. Atención Primaria 28 (2001): 425-429.
- Tan C, Du X. KRAS mutation testing in metastatic colorectal cancer. World Journal of Gastroenterology 18 (2012): 5171-5180.
- Seymour RA. The use of pain scales in assessing the efficacy of analgesics in post-operative dental pain. Europena Journal of Clinical Pharmacology 23 (1982): 441- 444.
- Stewart WF, Ricci JA, Chee E, et al. Cost of Lost Productive Work Time among US Workers with Depression. Journal of American Medical Association 289 (2003): 3135-3144.
- Campo-Arias A, Herazo E. Concordancia intra- e interevaluadores. Revista Colombiana de Psiquiatría 39 (2010): 424-432.
- Fleiss JL, Cohen J. The equivalence of weighted kappa and the intraclass correlation coefficient as measures of reliability. Educational and Psychological. Measurements 33 (1973): 613-619.
- Enderlein G. Fleiss JL: The Design and Analysis of Clinical Experiments. Wiley, New York - Chichester - Brislane - Toronto - Singapore (1986) 432 S., £38.35. Biometrical Journal 30 (1988): 304.
- Argimon Pallás JM, Jiménez Villa J. El artículo original, in: Métodos de Investigación Clínica y Epidemiológica 34 (2004): 312-320.
- Escobar-Pérez J, Cuervo-Martínez Á. Validez De Contenido Y Juicio De Expertos: Una Aproximación a Su Utilización. Avances en Medición 6 (2008): 27-36.
- Campbell DT, Fiske DW. Convergent and discriminant validation by the multitrait-multimethod matrix. Psychological Bulletin 56 (1959): 81-105.
- McConnell S, Kolopack P, Davis AM. The Western Ontario and McMaster Universities Osteoarthritis Index (WOMAC): a review of its utility and measurement properties. Arthritis Care and Research 45 (2001): 453-461.
- Nunnally J, Bernstein I. Psychometric Theory, 3rd edn, (1994). McGraw-Hill, New York (1994).
- Turabian JL. The social and health gender differences in patient’s companion in the family medicine consultation. Current Research: Integrative Medicine 2 (2017): 45-49.
- Hawker G, Mian S, Kendzerska T. Measures of adult pain: Visual Analog Scale for Pain (VAS Pain), Numeric Rating Scale for Pain (NRS Pain), McGill Pain Questionnaire (MPQ), Short-Form McGill Pain Questionnaire (SF-MPQ), Chronic Pain Grade Scale (CPGS), Short Form-36 Bodily Pain Scale (SF-36 BPS), and Measure of Intermittent and Constant Osteoarthritis Pain (ICOAP)). Arthritis Care Research 63 (2011): 240-252.
- Natour J, Cazotti LDA, Ribeiro LH, et al. Pilates improves pain, function and quality of life in patients with chronic low back pain: A randomized controlled trial. Clinical Rehabilitation 29 (2015): 59-68.
- Ferrari A, Baraldi C, Licata M, et al. Polypharmacy Among Headache Patients: A Cross-Sectional Study. CNS Drugs 32 (2018): 567-578.
- Sharma N, Chakrabarti S, Grover S. Gender differences in caregiving among family - caregivers of people with mental illnesses. World Journal of Psychiatry 6 (2016): 7-17.
- Xiong C, Biscardi M, Nalder E, et al. Sex and gender differences in caregiving burden experienced by family caregivers of persons with dementia: A systematic review protocol. British Medical Journal Open 8 (2018): e022779.
- Perrin PB, Panyavin I, Morlett Paredes A, et al. A Disproportionate Burden of Care: Gender Differences in Mental Health, Health-Related Quality of Life, and Social Support in Mexican Multiple Sclerosis Caregivers. Behavioural Neurology (2015).
- Li Q, Loke AY. A spectrum of hidden morbidities among spousal caregivers for patients with cancer, and differences between the genders: A review of the literature. European Journal of Oncology Nursing 17 (2013): 578-587.
- Li Q P, Mak YW, Loke AY. Spouses’ experience of caregiving for cancer patients: A literature review. International Nursing Review 60 (2013): 178-187.
- Margarit C, Roca R, Inda MDM, et al. Gender Bias and Genotype Influence on Opioid Safety Profile in Chronic Low Back Pain. The Clinical Journal of Pain 36 (2020): 420-429.
- Chou R, Fanciullo GJ, Fine PG, et al. American Pain Society-American Academy of Pain Medicine Opioids Guidelines Panel, 2009. Clinical guidelines for the use of chronic opioid therapy in chronic noncancer pain The Journal of Pain 10 (2): 113-130.
- Urrutia Egaña M, Barrios Araya S, Gutiérrez Núñez M, et al. Optimal method for content validity [Métodos óptimos para determinar validez de contenido]. Revista Cubana de Educación Medica Superior 28 (2015): 547-558.
- Johnson JA, Pickard AS. Comparison of the EQ-5D and SF-12 health surveys in a general population survey in Alberta, Canada. Medical Care 38 (2000): 115-121.
- Johnson JA, Pickard AS. Comparison of the EQ-5D and SF-12 health surveys in a general population survey in Alberta, Canada. Medical Care 38 (2000): 115-121.
- Geller AI, Nopkhun W, Dows-Martinez MN, et al. Polypharmacy and the Role of Physical Medicine and Rehabilitation. PM R 4 (2012): 198-219.
Supplementary


Supplementary Figure 1: GPSq questionnaire, with the English version and the Spanish version, which was validated in this study.

Note: PU: Pain Unit Cases; PC: Control; CC: Other clinical’s units controls; AEs: Adverse Events.
Supplementary Figure 2: Adverse Events (AEs) frequency by system depending on the group. A) case group (PU), B) Patients’ companions’ group (PC), and C) Patients from other clinical Units (CC).

Supplementary Figure 3: Variables plotted on the first two canonical variates.
|
EQ-5D Dimensions |
Case |
Control |
Control |
P-Value |
||
|
PU (n=38) |
PC and CC (n=52) |
PC (n=27) |
CC (n=25) |
PU vs. PC + CC PC vs. CC PU vs. CC |
||
|
Mobility, No. (%) |
No problems to walk |
6 (16%) |
13 (36%) |
6 (25%) |
7 (58%) |
.0481 .0052 .03453 |
|
Some problems to walk |
32 (84%) |
22 (61%) |
18 (75%) |
4 (33%) |
||
|
I must lay in bed |
0 (0%) |
1 (3%) |
0 (0%) |
1 (9%) |
||
|
Personal care, No. (%) |
No problems |
18 (47%) |
18 (49%) |
14 (56%) |
4 (33%) |
.99241 .7812 .42083 |
|
Some problems |
18 (47%) |
17 (46%) |
10 (40%) |
7 (58%) |
||
|
Many problems |
2 (6%) |
2 (5%) |
1 (4%) |
1 (9%) |
||
|
Daily activities, No. (%) |
No problems |
11 (29%) |
13 (36%) |
9 (36%) |
4 (36%) |
.75901 .9322 .84863 |
|
Some problems |
20 (53%) |
18 (50%) |
12 (48%) |
6 (54%) |
||
|
Many problems |
7 (18%) |
5 (14%) |
4 (16%) |
1 (10%) |
||
|
Pain, No. (%) |
I have no pain |
0 (0%) |
7 (19%) |
2 (8%) |
5 (42%) |
.01451 .00072 .04933 |
|
Moderate pain |
34 (89%) |
25 (68%) |
19 (76%) |
6 (50%) |
||
|
Much pain |
4 (11%) |
5 (13%) |
4 (16%) |
1 (8%) |
||
|
Anxiety/Depression (A/D), No. (%) |
No A/D |
12 (32%) |
20 (51%) |
15 (56%) |
5 (42%) |
.16551 .3212 .51843 |
|
Moderately |
23 (61%) |
18 (46%) |
11 (40%) |
7 (58%) |
||
|
Very A/D |
3 (7%) |
1 (3%) |
1 (4%) |
0 (0%) |
||
P-value<0.05 is written in bold font, 1PU patients vs PC + CC. 2PC vs CC. 3PU vs CC. Chi-square Test was carried out in all the statistical analyses.
Supplemental Table 1: Results of EuroQol-5D (EQ-5D) depending on the dimension affected at cases (PU, pain patients’ group) and control group (PC, cases companions and n=CC, patients from other clinical units).
*P value <0.05 is in bolt font. VAS, Visual Analogue Scale (0-100mm); EQ- VAS EuroQol scale (0-100mm); AEs, Adverse Events.
Supplemental Table 2: Multiple linear regression of descriptive, clinical, and pharmacological parameters with Visual Analogue Scale (VAS) relief intensity scores for the Pain Unit (PU), Patients’ companions (PC) and Clinical Units (CC) groups.
|
Similar trait/dissimilar method |
Similar method/dissimilar trait |
Dissimilar trait/method |
|
|
GPSq |
0,936a |
0,527c |
0,190e |
|
0,521b |
0,554d |
0,446f |
|
|
Isolated Scales |
0,833a |
0,414c |
0,289e |
|
0,802b |
0,346d |
0,372f |
Note: The matrix was performed to assess the relation between the different traits (pain intensity, relief intensity) and different methods (Visual Analogue Scale and Likert). a Pain intensity VAS and Likert; b Pain relief VAS and Likert; c VAS pain and relief; d Likert pain and relief; e VAS pain and Likert relief; f Likert pain and VAS relief
Supplemental Table 3: Convergent/discriminant validity for Global Pain Scale questionnaire (GPSq) and isolated scales and multitrait-multimethod matrix.

 Impact Factor: * 3.6
 Acceptance Rate: 78.21%
  Time to first decision: 10.4 days
  Time from article received to acceptance: 2-3 weeks