SARS-CoV-2, Alcohol Consumption, Poor Social Behavior, and the COVID-19 Pandemic
Marques F O*,
Retired from University of Lisbon, Portugal
*Corresponding author: Marques F O, Retired from University of Lisbon, Portugal
Received: 30 April 2022; Accepted: 09 May 2022; Published: 20 May 2022
Article Information
Citation: Marques F O. SARS-CoV-2, Alcohol Consumption, Poor Social Behavior, and the COVID-19 Pandemic. Archives of Internal Medicine Research 5 (2022): 182-191.
View / Download Pdf Share at FacebookAbstract
A pandemic can only take place if virus transmission is out of control, especially if transmission is through the air. Here, we carry out a critical analysis of data regarding COVID-19, because it is crucial for effective decision making and control of the pandemic. As a major conclusion, an intimate relation between the number of cases/deaths and the consumption of alcohol is found, because, with very few exceptions, the ranked top 30 countries in COVID-19 cases/deaths and alcohol consumption coincide. This coincidence is not fortuitous nor surprising, because excessive alcohol consumption is known to have pernicious effects on social behavior, i.e. lead to deviant and irresponsible behavior that greatly promotes transmission, like dropping the mask, gather in large numbers, and keep in very close contact.
Keywords
SARS-CoV-2, COVID-19, Alcohol Consumption, Poor Social Behavior, Pandemic
Article Details
1. Premises
COVID-19 is mostly transmitted through the air, thus greatly influenced by proximity between host and recipient. Sneezing, coughing, and kissing without appropriate protection provide the highest instant-aneous virus load, which is difficult to handle even by a strong immune system. The number of cases is biased by the number of tests, but to what extent it is not known. Given that the number of asymptomatic people may be large, the number of cases may be greatly underestimated. Therefore, special attention will be paid to the number of deaths attributed to COVID-19, although it may also be somewhat biased. Only countries in the northern hemisphere are analyzed here to avoid the mixing of countries with opposite seasonal evolution, i.e. countries currently entering Winter (northern hemisphere with increasing number of cases) or Summer (southern hemisphere with decreasing number of cases). The 7th of December was chosen to avoid the Omicron effect. Alcohol has negative effects on the social behavior (deviant, irresponsible) and the immune system (deficient, e.g. Molina et al., 2010, and references therein), but here we concentrate on the former.
1.1 Analysis of current available data (7 December 2021)
The analysis of COVID-19 graphs shows that:
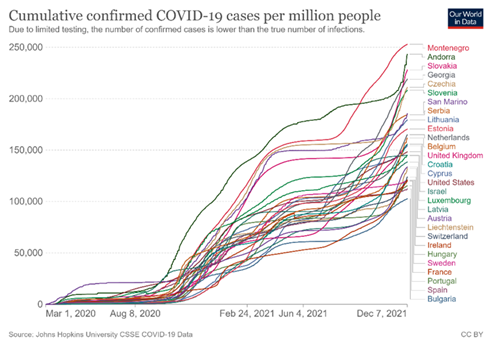
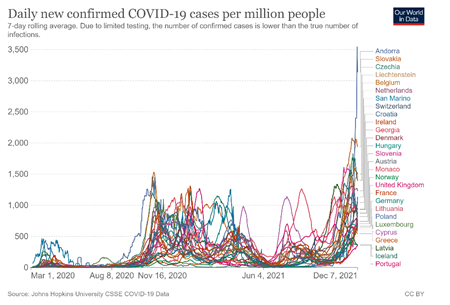
- COVID-19 is clearly seasonal, with low and high incidences in Summer and Winter, respectively (Figs. 1 and S1);
- Cumulative and daily cases are led by European countries in the top 28 rank (Figs. 1 and S1);
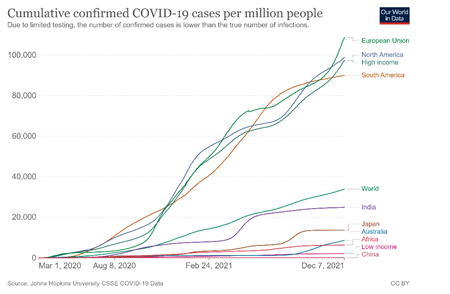
- Regarding cumulative cases by main geographical areas (Fig. S2), the European Union, and North and South Americas have each accumulated almost the triple of cases relative to the World value, and that high-income countries have accumulated about 50 times more cases than low-income countries;
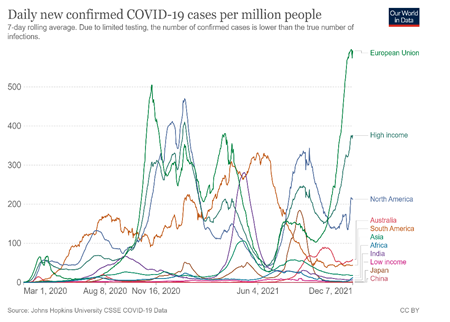
- As to daily new confirmed COVID-19 cases/million people by continent, income and selected countries (Fig. S3), the European Union has currently almost 3 times more cases than North America, and almost 60 times more than Africa;
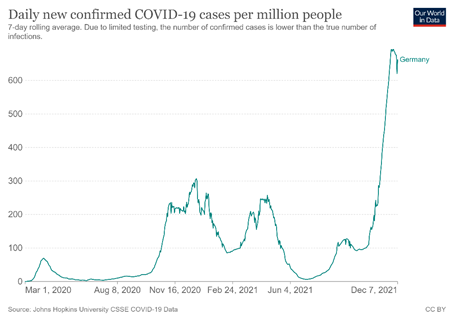
- Regarding the evolution of the daily new confirmed COVID-19 cases/million people in Germany (Fig. S4), the number of daily cases has almost tripled relative to the same period in 2020, even though ca. 70% of the population be fully vaccinated to date;
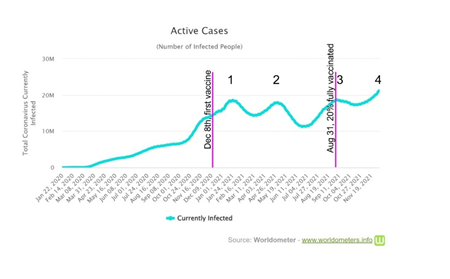
- Concerning the evolution of the number of active cases (cases still waiting for an outcome) (Fig. S5): (i) the total number of active cases is still increasing and has increased linearly on average, despite some stabilization with fluctuations around 15 M cases between the ends of January and July 2021; (ii) at the end of January 2021, the number of fully vaccinated people was insignificant, therefore vaccination cannot explain the inflection on the curve; (iii) from left to right, the three peaks are coincident with Winter in the northern hemisphere (peak 1), Winter in the southern hemisphere (peak 2), and again Winter in the northern hemisphere (more recent increase, 3 and 4); (iv) the evolution of the curve after January 2021 and the recent increase are consistent with the fact that the northern hemisphere dominates de number of cases.
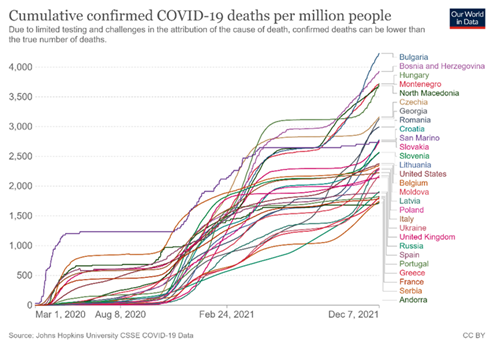
- Regarding the cumulative confirmed COVID-19 deaths/million people in the northern hemisphere (Fig. 2), the top 28 is comprised of European countries, with the exception of three countries (USA, Mexico and Russia, all in the bottom half);
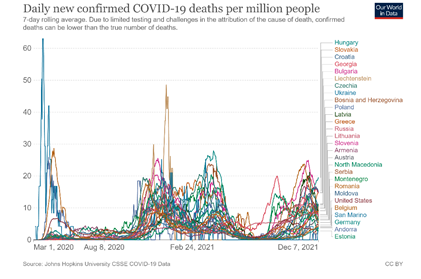
- As for daily new confirmed COVID-19 deaths/million people in the northern hemisphere (Fig. S6), the top 28 is comprised of European countries, except for the USA;
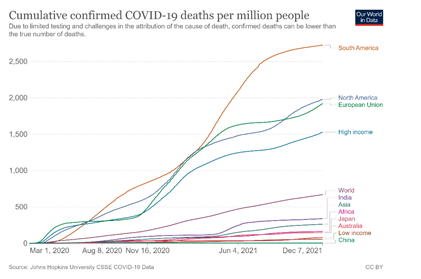
- Concerning the daily new confirmed COVID-19 deaths/million people by continent, income, and selected countries (Fig. S7): (i) South America leads by a significant difference, (ii) North America and European Union have more than 4 times difference relative to other main regions of the world, and (iii) the difference between high- and low-income countries is about 30 times;
- In all graphs with main geographic regions, Africa, Australia, Japan, China and low-income countries are always at the bottom of the rank.
Figure 2: Ranked top 28 countries in the northern hemisphere for cumulative confirmed COVID-19 deaths/million people, ranked by total deaths/million people. Note that the top 28 is composed of European countries, except for the USA, Ukraine and Russia in the bottom half. Top 1 in the world was Peru on the 7th of December 2021. Source: Ritchie et al., 2020.
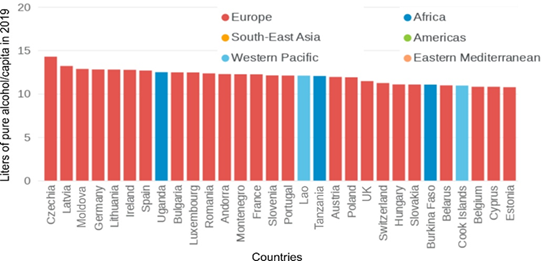
Figure 3: Alcohol consumption in the whole world in 2019, measured in liters of pure alcohol per person ≥15 years of age. The average world consumption was 5.8 l/person. Note that the top 30 is largely dominated by European countries, except for 5 countries from Africa and Western Pacific. Source: World Health Organization (WHO).
2. Discussion
Only countries in the northern hemisphere were analyzed here to avoid the mixing of countries with opposite seasonal evolution, which could be thought of as a source of bias. However, the graphs comprising the main regions in the world clearly show that the conclusions reached from the analysis of the northern hemisphere still apply to the whole world. Despite the opposite seasonal evolution between hemispheres, the number of cases/deaths in the northern hemisphere dominate the signal from the seasonal effect in the southern hemisphere. At the end of January 2021, the number of fully vaccinated people was insignificant, therefore vaccination cannot explain the inflection on the curve, which could be the result of a combination of seasonal effect (end of Winter) and confinement. In all graphs comprising main geographic regions, Africa, Australia, Japan, China, and low-income countries are always at the bottom of the rank, which seems at first sight puzzling because of the mixture of high- and low-income countries. The biased idea that poor countries should be more affected by a pandemic is thus shown to be no more than prejudice. This association should be a matter of urgent and major reflection.
The current available numbers clearly show that Europe faces two major problems: (1) fast contami-nation as soon as cold arrives, and (2) alcohol consumption, even during Summer, with excessive cases despite our immune system being at its peak. The COVID-19 numbers also show that the measures taken by European governments have been mostly ineffec-tive. Media, and, in fact, many decision makers, have mostly been telling people that vaccination is the universal panacea to put an end to the pandemic, and have mostly confused protection with immunity. The (mis)use of the term immunity has serious conse-quences, mostly because people get the idea that they can do anything (misbehave) because they are “immune”. The current vaccines against COVID-19 do not give immunity; they protect from serious consequences of the disease (e.g. death), so avoiding the collapse of the health systems, especially the ICUs (intensive care units). Therefore, the message to be spread to the public should be that the vaccine does not give immunity, and that it only protects the vaccinated person, not the people around. In fact, governments that want to make vaccination mandatory in their countries, or even in the whole European Union, are sending the wrong message to the people. A good example is the digital passport, and how people perceive it. It is a passport to misconduct, to be irresponsible, and to legally transmit a virus (again a problem of confusion between the protection given by a vaccine and its power to impede transmission). Current government measures, as in Portugal (Europ-ean Union), allow people to enter a restaurant with the digital passport, but without a mask and without having to keep the physical distancing.
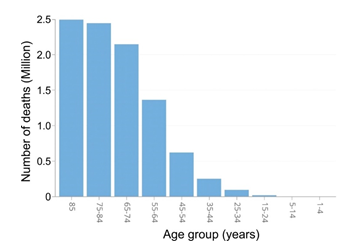
Therefore, the main problem, which is irresponsible behavior, will remain unresolved, thus proceeding as a main problem to the next pandemic. The effects of alcohol are twofold: (1) poor and irresponsible social behavior, and (2) destruction of the immune system at different degrees depending on the amount of consum-ption (e.g. Molina et al., 2010, who concluded that “alcohol abuse suppresses multiple arms of the immune response, leading to an increased risk of infections”). Alcohol and the (wrong) idea that vaccines are a universal panacea have led people to the God/Superman complex, i.e. the feeling that they are immune to anything. First, they are not immune, and second, they are still carriers of the virus and thus able to transmit it. The numbers have shown, since the beginning of the COVID-19 pandemic, an exponential relation between death and age (cf. Fig. S8), with very few cases below 10 years and highest number of cases above 64 years. The most obvious conclusion to draw from such a distribution is that young people should avoid, at all costs, the contact with the elderly, unless the youngsters are systematically tested for SARS-CoV-2 and, if positive, forbidden to contact elderly people and be immediately quarantined until testing negative.
As shown by the numbers, Europe faces a major problem of alcohol consumption, and this pandemic crisis could be a great opportunity to show people how damaging alcohol consumption can be, especially in terms of behavior in times of a pandemic. Low alcohol consumption triggers the God/Superman complex, which is typically responsible for deviant and irresponsible social behavior, in the current pandemic case by dropping the mask and gathering in large numbers of people in very close contact. High alcohol consumption is damaging for the health, especially the immune system (Molina et al., 2010). Both represent a major threat at times when we must face a pandemic, because education, a clear mind and a strong immune system are the key to overcome the current and future pandemics.
4.1 Messages to take home
Irresponsible social behavior is the main controlling factor in the virus transmission, which is the main problem when a pandemic is at stake. A deficient immune system is a second stage problem, especially because the number of serious and critical cases may lead to the collapse of National Health Systems and ICUs. If we do not urgently assume responsible behavior to overcome the current crisis, we will have wasted a great learning opportunity. This time of crisis could be a great opportunity for people to learn how damaging alcohol consumption can be, especially when proper education and conduct are the best solution. Population protection (social distancing, mask, testing regularly and before mixing young and old people, avoid alcohol and irresponsible behavior) and self-protection (vaccine) are necessary but insufficient to overcome the pandemic. The universal panacea for the current pandemic is not a vaccine, it is education, knowledge, and rational and responsible behavior. Ignorance and irresponsible behavior must be avoided at all cost.
References
- Molina PE, Happel KI, Zhang P, et al. Focus on: Alcohol and the immune system. Alcohol Res Health 33 (2010): 97-108.
- Ritchie H, Mathieu E, Rodés-Guirao L, et al. Coronavirus Pandemic (COVID-19) (2020).
Supplementary:
Supplementary Figure 1: Ranked top 28 countries in the northern hemisphere for daily new confirmed COVID-19 cases/million people, ranked by daily cases/per million people. Note that all countries are European. Even considering the entire world, the top 23 is composed of European countries. Source: Ritchie et al., 2020.
Supplementary Figure 2: Cumulative confirmed COVID-19 cases/million people by main geographical regions. Note that European Union, and North and South Americas have each accumulated almost the triple of cases relative to the World value (large gap on the graph), and that high-income countries have accumulated about 50 times more cases than low-income countries. Source: Ritchie et al., 2020.
Supplementary Figure 5: Evolution of the number of active cases (cases still waiting for an outcome), which is calculated by removing deaths and recoveries from the total number of cases. Note that: (1) despite some stabilization around 15 M cases, although with fluctuations, after the end of January 2021, the total number of active cases is still increasing and has increased linearly on average; (2) at the end of January 2021, the number of fully vaccinated people was insignificant, therefore vaccination cannot explain the inflection on the curve; (3) from left to right, the three peaks are coincident with winter in the northern hemisphere (peak 1), winter in the southern hemisphere (peak 2), and again winter in the northern hemisphere (recent increase). The evolution of the curve after January 2021 and the recent increase are consistent with the fact that the northern hemisphere dominates de number of cases.
Supplementary Figure 7: Evolution of the cumulative daily new confirmed COVID-19 deaths/million people by continent, income, and selected countries. Note that: (1) South America leads by a significant difference; (2) North America and European Union also show > 4 times difference relative to other main regions of the world; and (3) the difference between high- and low-income countries is about 30 times. Source: Ritchie et al., 2020.


 Impact Factor: * 3.6
 Acceptance Rate: 78.21%
  Time to first decision: 10.4 days
  Time from article received to acceptance: 2-3 weeks