The Effects of Payer-Mix on Utilization during the COVID-19 Pandemic, in Urgent and Primary Care
Luis W Dominguez MD, MPH*, Brandon Beattie MMSc, PA-C, Alexander Poulose MHA
Department of Emergency Medicine, The GW Medical Faculty Associates, Washington DC, United States
*Corresponding author: Luis W Dominguez, Department of Emergency Medicine, The GW Medical Faculty Associates, 2120 L ST NW, Suite 450, Washington DC 20037, United States
Received: 22 June 2022; Accepted: 04 July 2022; Published: 12 August 2022
Article Information
Citation: Luis W Dominguez, Brandon Beattie, Alexander Poulose. The Effects of Payer-Mix on Utilization during the COVID-19 Pandemic, in Urgent and Primary Care. Archives of Internal Medicine Research 5 (2022): 420-422.
View / Download Pdf Share at FacebookAbstract
Background: Healthcare utilization has changed dramatically during the COVID-19 crisis with the most dramatic drops in April 2020. While a lot of research has focused on utilization among Medicare and the privately insured, comparatively less has been published on the effect of payer-mix, particularly Medicaid, on utilization.
Methods: Monthly patient volume was gathered across 3 ambulatory primary and urgent care clinics. The timeframe included appointments, walk-ins and virtual visits from January through June 2020, including the nadir in April. Patient volume was then compared to average payer mix over that same time, at each clinic. A simple linear regression was then run, comparing changes in patient volume and percent Medicaid. The limited data points allowed for a qualitative analysis.
Results: Two clinics had similar payer mixes, and saw similar decreases in utilization. A third clinic with twice as many Medicaid patients, saw only half the reduction in patient volume, during the nadir in April 2020.
Conclusion: Given the limited number of data points, only a qualitative analysis was possible. A simple regression line indicated a correlation between the proportion of Medicaid patients and demand resilience for healthcare resources. At scale, the Medicaid population may be less vulnerable to variations in utilization, exhibiting less elastic demand, despite a pandemic, for a myriad of reasons.
Keywords
<p>Pandemic Utilization, Medicaid, Payer-Mix, Primary Care Utilization</p>
Article Details
1. Background
On March 31st 2020, the United States declared a national emergency due to COVID-19 [1]. The combination of public concern and de-prioritization of non-urgent health care resulted in dramatic decreases in patient volume [1, 2]. The negative ramifications on patients, providers, and healthcare systems will take years to quantify [2, 3]. We may begin to understand the future consequences by examining previous outbreaks. During the 2013 SARS outbreak in Taiwan, Lee et al. [4] reported a 23.9% decrease in ambulatory care utilization. The Ebola outbreak in West Africa from 2013-16 dropped healthcare utilization by 18% resulting in quantifiable spikes in excess deaths, unrelated to the virus [5]. The MERS epidemic of 2015 in South Korea decreased utilization by 28% [6].
In the US, examinations of commercially insured patients estimate a 32-43% drop in outpatient utilization [1, 2, 7, 8] and a 30% drop in emergency room visits during the spring of 2020, compared to previous years [3]. The purpose of this study was to examine the relationship between healthcare utilization and payer-mix. Patient volume from January through June of 2020 was compared across three urgent & primary care clinics, broken down by payer-mix. We hypothesized that Medicaid patients have greater needs and less flexibility, resulting in more resilient (or less elastic) demand.
2. Methods
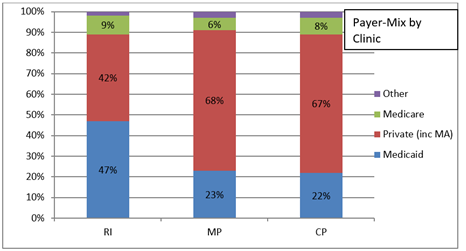
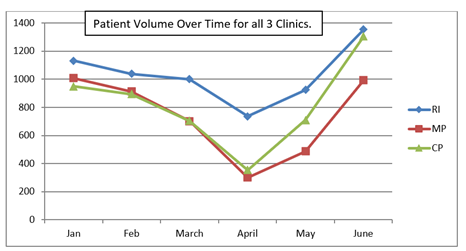
There were three ambulatory clinics under the administration of the authors, and thus three clinics were chosen. The clinics were open 7 days per week, for 12 hours daily on weekdays, and 10 hours daily on weekends. Clinics saw a combination of urgent and primary care patients. All clinics offered daily COVID-19 screenings, and telehealth visits. One clinic was located in the eastern half of the city, with a higher proportion of Medicaid patients. The other two clinics were located in the western half of the city, with higher proportions of the privately insured. Patient volume data was collected for each clinic from January 2020 through June 2020. Data combined urgent-care walk-ins, primary care in-person appointments, and tele-visits, along with COVID-19 screenings. Over the same period of time, payer-mix data was collected in aggregate based on claims, and given analytic restrictions, was not broken down monthly (Figure 1). A baseline was calculated for each clinic based on volume in January and February. The national emergency order was given at the end of March, and the patient volume nadir was noted in all three clinics the following April, 2020 (Figure 2). The percent decrease in patient volume was calculated for each clinic by averaging their baseline volume from January and February, and comparing it to the nadir in April. The percent decrease in patient volume was then plotted against the payer-mix proportion of Medicaid. A simple regression line, along with a slope was calculated.
3. Results
3.1 Payer mix
The two clinics in the western side of the city, CP and MP had very similar payer-mixes (Figure 1) with 67% and 68% privately insured, and only 22% and 23% Medicaid, respectively. Clinic RI had the near inverse payer-mix, with only 42% privately insured and twice as many patients on Medicaid (47%).
3.2 Patient volume
Comparing patient volume during the April nadir (Figure 2); clinic MP and CP saw 69% and 61% drops in patient volume respectively, while clinic RI suffered only a 32% drop.
3.3 Change in patient volume by medicaid
Presuming similarity between all clinics, a qualitative assessment would suggest the smaller change in patient volume at RI to be associated with its double-proportion of Medicaid patients. When plotting a line comparing the percent change in patient volume in April, with the percent of Medicaid patients in the payer-mix, the slope was calculated at -1.36.
3.4 Limitations
This observational study has many limitations. First, we had 3 clinics, with monthly patient volumes from January through June, yielding a total of 18 data points. 18 data points are not enough to make broad characterizations of healthcare utilization during a pandemic. Baselines were taken from proceedings months, instead of previous years due to limitations in the electronic health record. Furthermore, to properly compare clinics, we would have to assume that the clinics were equal. There are, at a minimum, geographical, architectural, and personnel differences. While we were able to ascertain the payer-mix for those 6 months, we did not have a monthly breakdown. As a result, the effects of any monthly changes in payer-mix were not accounted for. This study did not distinguish between primary care appointments, urgent care walk-ins and tele-visits, preventing a more complete analysis of utilization behavior. Finally, there was no effort made to control for demographics across clinics. It seems likely that differences in age, race or sex could have significant effects on changes in utilization.
4. Discussion
While limited, the graphical assessment comparing payer-mix and patient volume supports an association between Medicaid and utilization. Two clinics (MP and CP) had nearly identical payer-mixes, with nearly two-thirds of patients having private insurance, and less than 25% having Medicaid. These clinics saw the greatest reduction in patient volume during April 2020. In contrast, RI clinic had twice the proportion of Medicaid (47%), with markedly fewer privately insured (42%). RI clinic however, only suffered a 32% drop in patient volume, compared to a 69% and 62% decrease in MP and CP respectively.
Plotting the percent change in patient volume by the proportion of Medicaid, across all three clinics, yielded a line with a slope of -1.36. If our observation extrapolates to the general population: for every percent increase in Medicaid patient-mix, we would expect 1.36% less variation in pandemic-driven utilization. Put another way, the more privately insured patients in a payer-mix, the more elastic is the demand. The more Medicaid patients, the less elastic is the demand.
5. Conclusion
Most of the data published thus far have looked at the effect of the pandemic on private payer or Medicare utilization. However, few studies have attempted to examine the differences between payer-groups. While utilization plummeted across our clinics, the decrease in patient volume was not uniform. The clinic with the greatest share of Medicaid patients was more resistant to swings in utilization despite a pandemic, while people with private insurance may be able to afford, financially and physiologically, to delay care. While this study is severely limited by power, the trends are nonetheless thought provoking. While greater quantitative research is required, it is interesting to posit that Medicaid patients may have less capacity to delay care, and thus exhibit inelastic demand for services. If true, such a realization would have direct effects on resource allocation during future pandemics.
Declarations and Disclosures
Human subjects were not used, and thus ethics approval was not applied for. All authors give consent for publication. De-identified data and all study materials are available upon request. The authors report no conflicts of interest. This study was self-funded by the authors, and the authors’ department. All authors contributed to this report. AP lead the data gathering, BB led the background research, and LD originated and oversaw the entire process.
References
- Lange SJ, Ritchey MD, Goodman AB, et al. Potential Indirect Effects of the COVID-19 Pandemic on Use of Emergency Departments for Acute Life-Threatening Conditions - United States, January-May 2020. Morbidy and Mortality Weekly Report 69 (2020): 795-800.
- Whaley CM, Pera MF, Cantor J, et al. Changes in Health Services Use Among Commercially Insured US Populations During the COVID-19 Pandemic. JAMA Netw Open 3 (2020): e2024984.
- Giannouchos TV, Biskupiak J, Moss MJ, et al. Trends in outpatient emergency department visits during the COVID-19 pandemic at a large, urban, academic hospital system. Am J Emerg Med 40 (2021): 20-26.
- Chang J, Huang N, Lee C, et al. The Impact of the SARS Epidemic on the Utilization of Medical Services: SARS and Fear of SARS. American Journal of Public Health 94 (2004): 562-564.
- Wilhelm JA, Helleringer S. Utilization of non-Ebola health care services during Ebola outbreaks: a systematic review and meta-analysis. J Glob Health 9 (2019): 010406.
- Lee SY, Khang YH, Lim HK. Impact of the 2015 Middle East Respiratory Syndrome Outbreak on Emergency Care Utilization and Mortality in South Korea. Yonsei Med J 60 (2019): 796-803.
- Gilson SF, Umscheid CA, Laiteerapong N, et al. Growth of Ambulatory Virtual Visits and Differential Use by Patient Sociodemographics at One Urban Academic Medical Center During the COVID-19 Pandemic: Retrospective Analysis. JMIR Med Inform 8 (2020): e24544.
- Cox C, Amin K. How Have Health Spending and Utilization Changed During the Coronavirus Pandemic? KFF. Morbidy and Mortality Weekly Report (2020).


 Impact Factor: * 3.6
 Acceptance Rate: 78.21%
  Time to first decision: 10.4 days
  Time from article received to acceptance: 2-3 weeks