Greenhouse Gas Emissions an Index of Global Warming is not Associated with Ischemic Heart Disease Mortality
Ishmeet Singh1, Simon W Rabkin1, 2*
1University of British Columbia, Vancouver, Canada
2Department of Medicine Division of Cardiology, Vancouver, Canada
*Corresponding author: Dr. Simon Rabkin, Department of Medicine Division of Cardiology, University of British Columbia, 9th Floor 2775 Laurel St. Vancouver, B.C., Canada
Received: 17 September 2021; Accepted: 24 September 2021; Published: 20 December 2021
Article Information
Citation: Ishmeet Singh, Simon W Rabkin. Greenhouse Gas Emissions an Index of Global Warming is not Associated with Ischemic Heart Disease Mortality. Cardiology and Cardiovascular Medicine 5 (2021): 715-725.
View / Download Pdf Share at FacebookAbstract
Objective: The objective of this study was to examine the relationship between greenhouse gas (GHG) emissions and ischemic heart disease (IHD) and for comparison chronic lower respiratory tract disease (RESP) mortality, between different countries.
Methods: The United Nations Framework Conven-tion on Climate Change (UNFCC) GHG inventory database for 2015 (37 countries) and 2016 (12 countries) was related to World Health Organization (WHO) age-standardized death rates per 100,000 for IHD and RESP diseases. The next approach was to focus on one country with a similar health care system, GHG for each province of Canada from 2013-2018 was related to age-standardized IHD mortality.
Results: In the 2015 database, there was no significant correlation (r=0.046, p=0.785) between GHG and IHD mortality and similarly after excluding the 3 countries in the 90th percentile for GHG. In contrast, there was a suggestion of a relationship between GHG and RESP mortality (r=0.306, p=0.069). Evaluating countries with GHG values that were not in the upper 90th percentile showed a significant (r=0.380, p=0.03) relationship between GHG and RESP mortality. Focusing on one country with a similar health care system, GHG for each province of Canada from 2013-2018 was related to age-standardized IHD mortality. There was no increase in IHD mortality in regions with high compared to low GHG.
Conclusion: These data suggest that greenhouse gas (GHG) emissions, an index of global warming is not associated with ischemic heart disease mortality while an association with chronic lower respiratory tract disease (RESP) mortality is possible.
Keywords
Greenhouse gas emissions; Ischemic heart disease mortality; Chronic lower respiratory tract disease; Global health
Article Details
1. Introduction
Greenhouse gas (GHG) emissions are an indicator of global warming because GHGs trap heat which in turn leads to increased environmental temperature [1]. Climatic change and extreme weather events have profound impacts on infectious diseases [2]. A theoretic construct of how climate change might impact non-communicable risks, which include cardiovascular mortality, has been advanced and suggests that hot weather would increase cardio-vascular mortality, through overcoming physiologic attempts to regulate body temperature as well as the effect of climate change to increase the salinity of drinking water that may increase blood pressure with its adverse effects on the cardiovascular system [3]. This suggestion underscores the importance of an examination of global warming indicators and cardiovascular mortality. Extremes of temperature may affect cardiovascular mortality [4]. Whether GHG emissions are associated with cardiovascular mortality has not been studied in detail. Climate change induced by human activities, is due in part to the globally aggregated excess of greenhouse emissions [5]. Different types of GHG, such as carbon dioxide (CO2), methane (CH4), and nitrous oxide (N2O) have different capacities to retain atmospheric heat so that a composite index has been developed and measured in terms of CO2 equivalence (CO2e). This is the amount of CO2 emissions that the GHG emissions are equivalent to, in terms of the amount of heat they trap in the atmosphere [1]. We sought to test the hypothesis that greenhouse gas was associated with an increase in ischemic heart disease mortality (which includes myocardial infarction) by comparing countries around the globe with different amounts of greenhouse gas emissions, as well as regionally within one geographically diverse country - Canada. As a comparator mortality from chronic lower respiratory diseases, which includes obstructive lung disease, was evaluated because of their purported link to global warming [6-8]
2. Methods
2.1 Global data
2.1.1 Greenhouse gases: The United Nations Framework Convention on Climate Change (UNFCC) greenhouse gas inventory database was used to identify the total greenhouse gas (GHG) emissions without land use, land-use change, and forestry (LULUCF) for the years 2015 and 2016 for multiple countries. The countries on the database were either part of Annex 1 group or the non-Annex 1 group based on how the countries signed the agreement. The Annex 1 group countries report the GHG emission as Mt CO2 equivalent (megatons), whereas the non-Annex 1 group countries report them as Mg CO2 equivalent (megagrams). All emissions were converted to Mt CO2 equivalent. Countries that are parties to the Climate Change Convention submit GHG inventories to the Climate Change secretariat in the UN. According to the UN, “these submissions are made in accordance with the reporting requirements adopted under the Convention, such as the revised “Guidelines for the preparation of national communications by Parties included in Annex I to the Convention, Part I: UNFCCC reporting guidelines on annual greenhouse gas inventories” (decision 24/CP.19) for Annex I Parties and “Guidelines for the preparation of national communications for non-Annex I Parties” (decision 17/CP.8)” [9].
2.1.2 IHD and chronic respiratory disease mortality: The World Health Organization (WHO) mortality database was used to identify the age-standardized death rates (ASDR) per 100 000 for ischemic heart diseases (ICD-10 codes I20-I25), which includes myocardial infarction and other acute myocardial ischemic heart disease, for both sexes for the years 2015 and 2016 for countries that release their mortality data to WHO [10]. The World Health Organization (WHO) mortality database was also used to identify the age-standardized death rates (ASDR) per 100 000 for chronic lower respiratory diseases (ICD-10 codes J40-J47), which include specific and unspecific chronic bronchitis, emphysema, asthma, bronchiectasis and other chronic obstructive pulmonary disease, for both sexes for the years 2015 and 2016 for countries that release their mortality data to WHO. The WHO recognized that the “cause-of-death statistics are from country civil registration systems. When a death occurs, this event is registered at the local civil registry with information on the cause of death. The information is then compiled by the national authority and submitted to WHO every year”. The data is only published for medically certified deaths. The world standard population has been used by WHO to calculate ASDR (World Health Organization) [10].
2.1.3 Inclusion criteria: The standardized databases were used to identify information about GHG emissi-ons and cardiovascular disease mortality for various countries. The inclusion criteria were: countries that had data available for both sets of variables (GHG emissions and IHD mortality) for last 5 years which was only 2015 and 2016. There was no global IHD mortality data after 2016. Only countries with both kinds of data were selected for analysis which resulted in 37 countries for the year 2015 (Australia, Austria, Belgium, Brazil, Croatia, Cyprus, Czech Republic, Denmark, Estonia, Finland, Germany, Greece, Hungary, Iceland, Israel, Italy, Japan, Kazakhstan, Latvia, Lithuania, Luxembourg, Malta, Netherlands, Norway, Poland, Republic of Korea, Romania, Russian Federation, Slovenia, Spain, Sweden, Switzerland, Turkey, Ukraine, United Kingdom, United States of America, and Canada), and 12 countries in the year 2016 (Austria, Croatia, Cyprus, Czech Republic, Hungary, Iceland, Lithuania, Netherlands, Romania, Sweden, United States of America, and Canada). It should be noted that some countries only report their data every second year.
2.1.4 Canadian provincial details: The Greenhouse gas information was available from the Government of Canada website and as well annual GHG emission was available for each province of Canada from 2013-2018. This data from the Canada’s National Greenhouse Gas Inventory is prepared and is submit-ted annually to the UNFCCC. “The GHG inventory includes emissions of carbon dioxide (CO2), methane (CH4), nitrous oxide (N2O), perfluorocarbons (PFCs), hydrofluorocarbons (HFCs), sulphur hexafluoride (SF6) and nitrogen trifluoride (NF3)’. The document presents the emissions from these various greenhouse gases by converting it to CO2 equivalents based on the gases’ global-warming potential (GWP). The data are presented as MtCo2. [11] (https://www.canada.ca/
en/environment-climate-change/services/climate-change/greenhouse-gas-emissions/sources-sinks-executive-summary-2020.html#table-s-4).
The deaths and mortality rate from the Statistics Canada website was used to identify age-standar-dized mortality rates for ischemic heart disease (ICD-10 codes I20-I25) for each of the provinces of Canada from 2013-2018. This data is collected from “an administrative survey that collects demographic and medical (cause of death) information annually and monthly from all provincial and territorial vital statistics registries on all deaths in Canada. IHD mortality (https://www150.statcan.gc.ca/t1/tbl1/en/ cv.action?pid=1310080001).
2.1.5 Statistical analysis: The data is presented as the mean+SD. Global GHG emissions were tested to determine whether they were normally distributed by the D’Agostino & Pearson test and the Shapiro-Wilk test. Bivariate correlation models (parametric and non-parametric models) were used and generated respectively Pearson’s r and Spearman’s rho coeffi-cients for the association between IHD mortality and GHG emissions for each respective year for all the countries using the SPSS software (IBM Corp., Armonk, N.Y., USA). Graphical analysis used GraphPad Prism Statistical analyses were performed with GraphPad Prism 7.0 (GraphPad Software, Inc., San Diego, CA, USA).
3. Results
3.1 Global GHG and IHD mortality
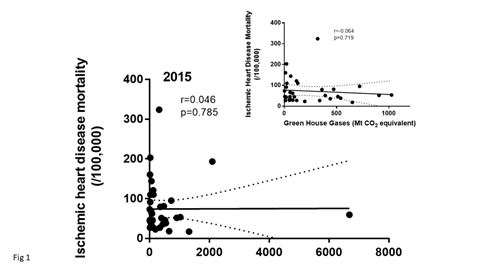
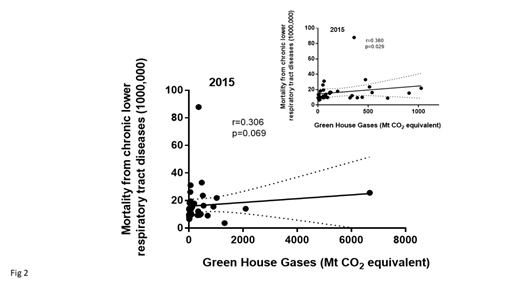
The global GHG data in the 2015 database showed a mean GHG emission of 481.7 ± 1150 with a very wide range between countries. The data were not (p<0.0001) normally distributed indicating the need for non-parametric testing. There was no significant correlation between IHD mortality and GHG, (Spearman’s rho correlation [r=-0.046, p=0.785)], (Figure 1). Because there were a few countries that had very high GHG values that might bias the results, the data were reanalyzed excluding countries that were in the 90th percentile for QWG or >1151 Mt CO2 equivalents. These data were also not normally distributed even after removing three countries that were in the 90th percentile specifically USA, Russia and Japan. Again, there was no significant correlation between GHG and IHD mortality (Figure 1 insert). There was a weak correlation between GHG and mortality from lower respiratory diseases (Spear-man’s rho correlation [r=-0.306, p=0.069)]) (Figure 2). Reanalyzing the data only for countries with GHG values that were not in the upper 90th percentile showed a significant (Spearman rho correlation [r=-0.380, p=0.03]) relationship between GHG and lower Respiratory tract disease mortality (Figure 2 inset).
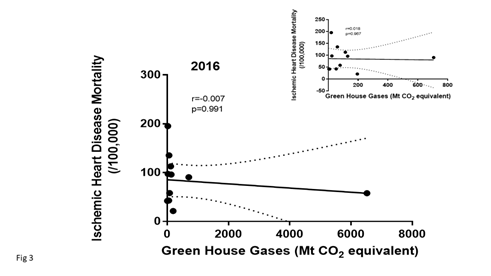
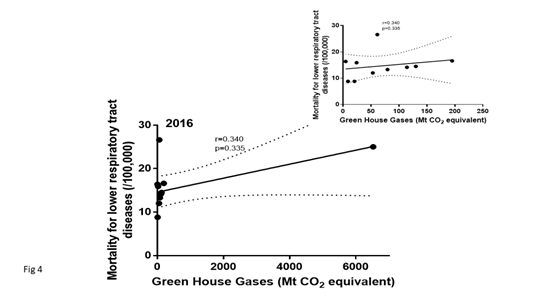
The global GHG data in the 2016 database was not (p<0.0001) normally distributed. In the 2016, data-base, there was no significant relationship between IHD mortality and GHG (Figure 3). The data were also displayed eliminating the USA because of their high GWG emissions might bias the relationship. No significant relationship was identified although a negative trend was noted. There were few countries that reported their mortality rate from chronic lower respiratory tract diseases. In 2106, there was no significant relationship between GHG emissions and mortality from lower respiratory diseases (Spearman rho correlation (Figure 4).
3.2 Canadian provincial GHG and IHD mortality
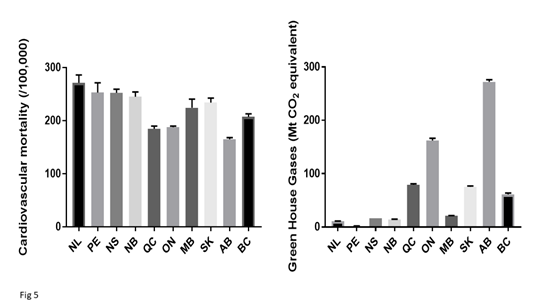
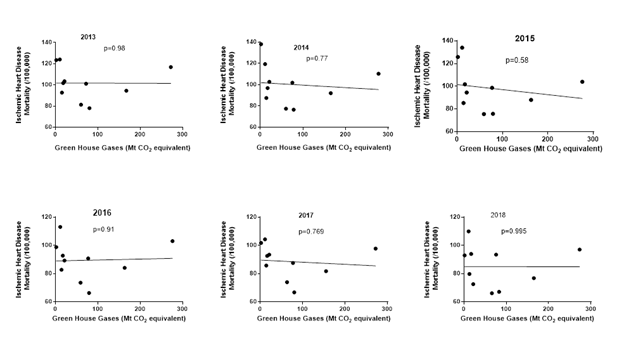
In order to match the GHG emissions globally with Canadian data, emissions over the time frame from 2013 to 2018 were examined. There was considerable variability in GHG emissions across the ten major provinces in Canada (Fig 5). There was also some variability in total cardiovascular and IHD mortality between provinces. We next examined whether there was a correlation between the average GHG emission during the same time frame and IHD mortality. To determine whether the data might have been influenced by 1 or 2 years, the data was examined for each year (Fig 6). Comparing GHG emissions and IHD mortality across the ten Canadian provinces showed that there was no significant correlation.
We next examined whether change in GHG from 2013 to 2018 was associated with any change in age standardized IHD mortality. Examining the data within each province, over the time frame from 2013 to 2018, found that there was no relationship between IHD mortality and GHG emission, for most (seven out of ten) provinces. There was a slight negative non-significant correlation between GHG and IHD mortality for Newfoundland (NL) [r=0.300], Prince Edward Island (PEI) [r=-0.044], Quebec (QUE) [r=0.323] and Saskatchewan (SASK) [r=0.524]. There were significant (p<0.05) negative relationships between GHG and IHD mortality for Manitoba (MB) [r=0.874] and British Columbia (BC) [r=0.868]. There were significant (p<0.05) positive relationships between GHG and IHD mortality for New Brunswick (NB) [r=0.9317] with weaker and nonsignificant positive correlations between GWG and IHD mortality in Nova Scotia (NS) [r=0.808], Ontario (ON) [r=0.472] and Alberta (AB) [r=0.178]. The absence of consistency and a weak negative correlation in some provinces does not support a relationship between IHD mortality and greenhouse gases
Figure 1: Shows the data in 2015 for ischemic heart disease, age-standardized death rates for 37 countries and their reported green house gas emissions All emissions were converted to Mt CO2 equivalent. The inset shows the same data excluding the data from countries in the 90th percentile for GHG (Mt CO2 equivalents).
Figure 2: Shows the data in 2015 for mortality from chronic lower respiratory tract diseases (age-standardized death rates) for 37 countries and their reported green house gas emissions All emissions were converted to Mt CO2 equivalent. The inset shows the same data excluding the data from countries in the 90th percentile for GHG (Mt CO2 equivalents).
Figure 3: Shows the data in 2016 for ischemic heart disease mortality (age-standardized death rates) for 11 countries and their reported green house gas emissions. All emissions were converted to Mt CO2 equivalent. The inset shows the same data excluding the data from the USA which had the highest GHG values so that the data in the lower GHG emission range can be more clearly visible.
Figure 4: Shows the data in 2016 for mortality from chronic lower respiratory tract diseases (age-standardized death rates) for 11 countries and their reported green house gas emissions. All emissions were converted to Mt CO2 equivalent. The inset shows the same data excluding the data from the USA which had the highest GHG values so that the data in the lower GHG emission range can be more clearly visible.
4. Discussion
This is the first study, to our knowledge, to directly compare greenhouse gas emission and IHD mortality across countries and compare it within a single country. Greenhouse gas emissions have been univer-sally accepted as an index of global warming as evidenced by the global commitment to collect these kinds of data. Our analysis suggests that there is no correlation between greenhouse gas emission and IHD mortality across countries globally and within one country with the same health care system. These different data sources provide mutually supportive conclusions. Greenhouse gas emissions are expected to increase annual temperatures and are implicated in the reduction in global snow, glacier and sea ice coverage which can cause increase coastal flooding [12]. In addition to environmental risks, increased greenhouse gas emissions can have an impact on human health. Concerns have been expressed that higher global temperatures may increase the incidence of heat stroke, respiratory and cardiovascular conditions [13]. Our data do not support this suggestion from the perspective of IHD mortality.
In contrast to IHD mortality, there was a suggestion, from our data, of a relationship between GHG and mortality from chronic lower respiratory tract diseases which include chronic bronchitis, emphysema, asthma, bronchiectasis and other chronic obstructive pulmonary disease. The concept has been proposed that GHG worsen air quality and air pollution; may not only trigger asthma but also lower the broncho-constrictive threshold to other respiratory antigens [8]. It has also been suggested that GHG and global warming increase the prevalence of pollen grains or plant-derived paucimicronic components carrying allergens that interact with air pollution (particulate matter and ozone) to produce or aggravate lower respiratory tract diseases [6]. The global GHG data in the 2015 database demonstrate the wide range of GHG between countries from 2.3 in Malta and 4.8 in Iceland to 6,676.4 Mt CO2 equivalents in the USA. The sources of GHG in the United States have been well described [1]. The wide range of GHG should provide a test of the hypothesis whether GHG emissions correlate with its cardiac and respiratory disease mortality. The specific cardiac diseases evaluated included myocardial infarction and respiratory tract diseases (including obstructive lung disease) both of which have been linked to environmental pollution [8, 14].
In order to ensure that countries with the highest GHG emissions did not bias the global analysis, the correlation was examined after removing the high GHG countries which also permitted a clearer picture of the other countries. This could only be reasonably done in the 2015 database which had a large number of countries. Before and after exclusion of high GHG countries, there was no association between GHG and IHD mortality. As most countries included in this study were European (28 in 2015), which on average have lower GHG emission compared to other countries, removing countries in the 90th percentile for GHG removed only 3 countries one Euro-Asian (Russia), one Asian (Japan) and one North American (USA). A range of GHG was still evident, as Europe is diverse in sources of GHG. There was still no correlation found between GHG and IHD mortality. Greenhouse gas emissions in Canada vary between provinces because of the nature of the industries in each province. Alberta has a large oil and gas industry as well a large agriculture industry. The oil and gas industry also accounts for much of the GHG in Saskatchewan [11]. Fossil fuel combustion is one of the major sources of GHG emissions, which has led to monitoring energy consumption, an important contributor to climate change [15]. Provinces, such as Alberta, that rely on fossil fuels for electricity have more GHG emissions than those relying on hydro-electricity, and similarly service-based economies have lower emissions than economies based on resource extraction [11]. The nature of industries in each province likely accounts for the variations in GHG emissions between provinces.
Interestingly, our data suggest that provinces in the eastern part of Canada (Ontario, Quebec, Nova Scotia, Newfoundland), with the exception of Prince Edward Island and New Brunswick show a negative correlation between GHG and ischemic heart disease mortality. Thus, there is no evidence that GHG might account for IHD mortality and suggest that IHD mortality is more closely related to factors other than GHG. It is unlikely that the Canadian data suggesting a negative correlation between IHD mortality and GHG emission represents reverse causality. Cardio-vascular disease, leading to IHD mortality is unlikely to have an effect on GHG emissions which are determined by industrial output. A likely explanation of our finding is that IHD has such a multifactorial etiology that increased GHG (or temperature), within the time frame of the reported data, plays too small a role to be detected. The multifactorial causality for IHD is consistent with each risk factor having its own level of impact on increasing IHD risk [16, 17]. Multinational studies, however, identified a co-rrelation between increasing blood pressure and/or cholesterol levels and the incidence of IHD [18] suggesting that GHG emissions may be a relatively minor risk factor for IHD mortality as compared to some of the more established risk factors.
Our finding that GHG does not increase IHD mortality may also be supported by the observation that heat waves do not necessarily increase IHD mortality, rather there is an increased mortality mainly from respiratory diseases. Cardiovascular mortality is more closely linked with extremes of cold weather [4]. We did not test the hypothesis that factors, such as ozone and high particulate matter, that are linked with increased environmental tem-perature, can increase IHD mortality [19]. Our data, however, are consistent with the proposal that from the perspective of cardiovascular mortality, the majority of the temperature-related mortality is not due to extreme hot weather” [20]. Our data give credence to the proposition that the overall impact on cardiovascular disease due to climate change will depend on other factors, including demographics and patient population [20].
There are several limitations of the study that warrant consideration. First, the study evaluated associations. Correlations are not a proof of causality [18]. Considerably more data of different kinds are necessary to establish the concept that GHW do not increase IHD mortality. However, the data on GHG and human health must utilize association statistics as it is not possible to do a randomized trial of GHG emissions. Second, this study examines global data which can be impacted by differences in health care delivery and cardiovascular disease management between countries so that any potential signal or relationship between GHG and IHD mortality may be obscured. However, our data within one country, Canada with similar health care systems in different provinces, minimizes the likelihood that our finding of the absence of an effect on GHG on CV mortality is obscured by differences in health care delivery for cardiovascular disease management. Third, the reporting countries maybe overrepresented by European countries. However, this is the nature of countries reporting to WHO. There are, however, sufficiently diverse GHG emissions reported by different European countries. The absence of a relationship between GHG and IHD mortality should not be interpreted as the inability of environmental factors to influence IHD mortality. Environmental pollution due to vehicular emissions (defined as black carbon, carbonaceous gases, and ultrafine particulate matter) have been linked to cardiovascular mortality [14]. Air pollution exposure is associated with an increased risk of acute myocardial infarction [20].
In conclusion, our study provides important data on the relationship of GHG and IHD mortality. It is not a challenge to the prevailing movement to address climate change or the concept that ‘health risks will arise from climatic influences on environmental systems and social conditions that affect food yields, water supplies and the stability of infectious disease patterns’ [5]. Rather it suggests that when focusing on specific disease consequences of GHG exposure, there is little impact on ischemic heart disease.
Funding Information
None
Competing Interests
The authors have no competing interests to declare.
Authors' Contributions
IS – data collection and analysis and writing the manuscript
SWR – conceptualization and writing the manuscript
References
- United States Environmental Protection Agency. Inventory of U.S. Greenhouse Gas Emissions and Sinks: 1990-2013 (2015).
- Patz JA, Campbell-Lendrum D, Holloway T, Foley JA. Impact of regional climate change on human health. Nature 438 (2005): 310-317.
- Frumkin H, Haines A. Global Environmental Change and Noncommunicable Disease Risks. Annu Rev Public Health 40 (2019): 261-282.
- Huynen MM, Martens P, Schram D, Weijenberg MP, Kunst AE. The impact of heat waves and cold spells on mortality rates in the Dutch population. Environ Health Perspect 109 (2001): 463-470.
- McMichael AJ. Globalization, climate change, and human health. N Engl J Med 369 (2013): 96.
- D’Amato G, Cecchi L, D’Amato M, Annesi-Maesano I. Climate change and respiratory diseases. Eur Respir Rev 23 (2014): 161 LP-169 LP.
- Singer M. Respiratory health and ecosyndemics in a time of global warming. Heal Sociol Rev 22 (2013): 98-111.
- Bernstein AS, Rice MB. Lungs in a warming world: climate change and respiratory health. Chest 143 (2013): 1455-1459.
- United Nations Climate Change. Greenhouse Gas Inventory Data - Time Series - Annex I (2019).
- World Health Organization. WHO Mortality Database (2021).
- Environment Canada. National inventory Report 1990-2018: Greenhouse Gas sources and sinks in Canada (2020).
- Bush E, Lemmen DS. Canada’s Changing Climate Report (2019).
- Matthies F, Nurse J, Menne B. Public health advice on preventing health effects of heat NEW and UPDATED information for different audiences. World Health Organization (2011).
- Grahame TJ, Schlesinger RB. Cardiovascular health and particulate vehicular emissions: a critical evaluation of the evidence. Air Qual Atmos Health 3 (2010): 3-27.
- Solomon S, Qin D, Manning M, Chen Z, Marquis M, Averyt K, et al. Climate Change 2007: The Physical Science Basis. Contribution of Working Group I to the Fourth Assessment Report of the Intergovernmental Panel on Climate Change. Cambridge University Press (2007).
- Rabkin SW, Mathewson AL, Tate RB. Predicting risk of ischemic heart disease and cerebrovascular disease from systolic and diastolic blood pressures. Ann Intern Med 88 (1978): 342-345.
- Erhardt L, Moller R, Puig JG. Comprehensive cardiovascular risk management - What does it mean in practice? Vasc Health Risk Manag 3 (2007): 587-603.
- Rabkin SW, Sackett DL. Epidemiology of arterial thromboembolism; in Column, Hirsch Marker S (ed): Textbook of Hemostasis and Thrombosis. JB. Lippincott Co (1982): 873-888.
- Analitis A, Michelozzi P, D’Ippoliti D, De’Donato F, Menne B, Matthies F, et al. Effects of heat waves on mortality: effect modification and confounding by air pollutants. Epidemiology 25 (2014): 15-22.
- Claeys MJ, Rajagopalan S, Nawrot TS, Brook RD. Climate and environmental triggers of acute myocardial infarction. Eur Heart J 38 (2017): 955-960.


 Impact Factor: * 5.6
 Acceptance Rate: 74.36%
  Time to first decision: 10.4 days
  Time from article received to acceptance: 2-3 weeks