Identification of Crucial Degs and Hub Genes in Focal Segmental Glomerulosclerosis: A Bioinformatics Study
Bhuvnesh Rai1, Prabhakar Mishra2, Mehar Hasan Asif3 and Swasti Tiwari1,*
1Department of Molecular Medicine & Biotechnology, Sanjay Gandhi Postgraduate Institute of Medical Sciences, Lucknow, India
2Department of Biostatistics & Health, Sanjay Gandhi Postgraduate Institute of Medical Sciences, Lucknow, India
3Genetics and Biotechnology Division, CSIR-National Botanical Research Institute, Lucknow, India
*Corresponding author: Swasti Tiwari, Department of Molecular Medicine and Biotechnology, Sanjay Gandhi Postgraduate Institute of Medical Sciences, Lucknow, 226014, India
Received: 19 November 2021; Accepted: 30 November 2021; Published: 07 December 2021
Article Information
Citation: Bhuvnesh Rai, Prabhakar Mishra, Mehar Hasan Asif and Swasti Tiwari. Identification of Crucial Degs and Hub Genes in Focal Segmental Glomerulosclerosis: A Bioinformatics Study. International Journal of Applied Biology and Pharmaceutical Technology 12 (2021): 420-460.
View / Download Pdf Share at FacebookAbstract
Aims
In individuals with focal segmental glomerulosclerosis, identify the important differentially expressed genes (DEGs) relative to healthy control, in kidney tissue samples (glomeruli and tubulointerstitium tissue) and examine their probable role in the molecular mechanism and pathogenesis process of disease.
Methods
From the Gene Expression Omnibus (GEO) database, raw microarray data generated from kidney tissues from focal segmental glomerulosclerosis patients, and healthy controls patients (GSE121233, GSE125779, GSE129973) were retrieved. Transcription analysis console 4.0 was used to identify DEGs. FUNRICH (Functional enrichment analysis tools) and Enrichr were used to perform functional gene enrichment analysis. Then, Search Tool for Retrieval Interacting Genes (STRING) 10.0 for PPI analysis and cyto scape's for network visualization was used. Further hub genes were identified using the cytohubbaalogorithm plug-in. Then KEGG and REACTOME databases were integrated with Shiny Go and FUNRICH to perform pathway analysis. We used GSEA analysis and associated pathway enrichment by metascape analysis utilizing the molecular complex identification (MCODE) algorithm to discover densely linked network components to further elucidate the likely mechanism of action of related genes in FSGS. The MCODE networks identified for individual gene lists have been gathered. Pathway and process enrichment analysis has been applied to each MCODE component independently, and the three best-scoring terms by p-value have been retained as the functional description of the corresponding components, shown in the tables underneath corresponding network plots further cross validation was done by ORA (over representation analysis) for the commonly (up-regulated) genes including hubgene from all three datasets was done by webgestalt. Finally, we check the raw expression level of all up regulated DEGs, including hub genes
Keywords
<p>FSGS; REACTOME; MCODE</p>
Article Details
1. Introduction
Focal segmental glomerulosclerosis (FSGS) is the most prevalent cause of end stage renal disease (ESRD) in India and the world across. In United States, it has a frequency of 4%, which is the most prevalent primary glomerular condition causing ESRD [1]. It accounts for roughly 20% of cases of nephrotic syndrome in children and 40% of cases in adults [2]. Glomerulosclerosis defines both a lesion and a disease. Glomerulosclerosis is a lesion and disease, whose lesion causes an increase in the extracellular matrix leading to the solidification of glomerular tuft while the sclerosis or scarring is with erradication of the urinary space by collagen with an increase in ECM in capillary tuft. The Global glomerulosclerosis is an irreversible and non treatable which can be seen in normal kidney and it increases with age [3]. While the segmental glomerulosclerosis is frequently focal and it involves nearly 50% of the glomeruli. FSGS as a lesion is observed in nearly all kidney diseases inclusive of the ones caused by diabetes mellitus type II. They primarily involve the glomerulus and the ones with already glomerular change leading to tubulointerstitial damage. Henceforth the targets and the pathways of FSGS are still murky.
With the increasing incidence of the disease [4] better understanding and identification of the crucial genes including hub-genes as the major therapeutic and diagnostic target in kidney disease with diabetes that is not primarily triggered by hyperglycemia, such as, IgA [5], glomerulonephritis [6] etc. The study for kidney disease with diabetes is less discovered due to limitation of the kidney biopsy, an invasive method. In order to combat with the present situation a noninvasive bioinformatic approach needs to be developed to detect the highly expressed mRNAs crucial in FSGS and there linked pathways in renal tissue [7, 8].
In the present study, three original microarray datasets were selected from the Gene Expression Omnibus (GEO) database. After identifying the differentially expressed genes (DEGs) in FSGS patients and control group, we employed the (FUNRICH and enrich R) to identify the functions of the identified DEGs and performed Gene Ontology (GO) and Kyoto Encyclopedia of Genes and Genomes (KEGG) and REACTOME for pathway analyses. The protein-protein interaction (PPI) network was generated using the STRING database, and hub genes and the most significant module among the PPI networks were identified using cyto Hubba and the Molecular Complex Detection (MCODE) plug-in. The present study aimed to identify potential candidate crucial genes including hub genes to diagnose and treat FSGS.
2. Material and Methodology
2.1 Datasets
GEO database was selected for our study. We used the key words (focal segmental glomerulosclerosis + affymetrix) AND "Homo sapiens" [porgn: txid9606]. Next, we screened these data sets according to the following inclusion criteria: (i) kidney tissues; (ii) normal kidney used as controls. The gene expression datasets of GSE121233, GSE125779 and GSE129973 were included. The platform for GSE17586 is [HTA-2_0] Affymetrix Human Transcriptome Array 2.0 [transcript (gene) version], which includes (GSE121233-4 samples as normal control and 4 FSGS samples, GSE125779- 7 as normal control and 8 FSGS samples and GSE129973- 20 as normal control and 20 FSGS samples) of kidney tissue obtained from diabetic subjects. Raw CEL formatted file(s) were downloaded for analysis. Supplementary table S1
2.2 Screening of differentially expressed genes
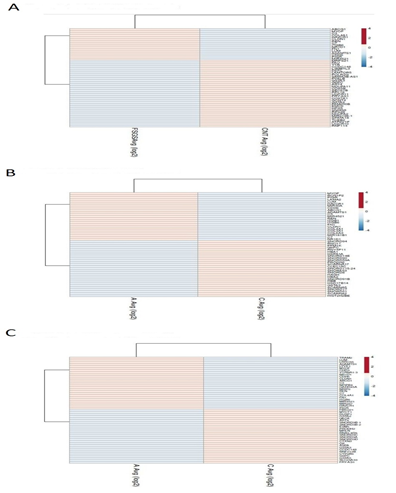
TAC 4.0 software was used for screening of differentially expressed genes by analyzing the CEL files by Annova method - ebayes (limma) [9] R/bio conductor package, differential gene expression analysis in the settings, along with background adjustment, quantile normalization, summarization, and log2 value transformation using RMA+DABG (Robust Multichip Average + Detection Above Background) algorithm [10] On analyzing DN and FSGS relative to T2DM no-CKD control all statistically evaluated genes with an assigned gene symbol were sorted with cut off conditions, statistical evaluation using t-test was done and all statistically evaluated genes with an assigned gene symbol were sorted with cut off conditions, FDR P value <0.05 and Fold change (<-2 &>2) for the differential gene expression study and generation of hierarchical clustering using Euclidean distance metric. Distances between clusters of objects were computed using the complete linkage method. Top 50 genes with highly significant p value < 0.05 in each datasets were shown by heat map made by Clust vis. Venn diagram analysis was performed to integrate the genes from the three GEO datasets using the website Venny (http://bioinfogp.cnb.csic.es/tools/venny/index.html), revealing co-expressed genes in all three datasets. Visualization of significantly top differentially expressed genes was done by web tool Clust Vis (https://biit.cs.ut.ee/clustvis/).
2.3 Boxplot, volcano plot, PCA, volcano plot and Venn diagram
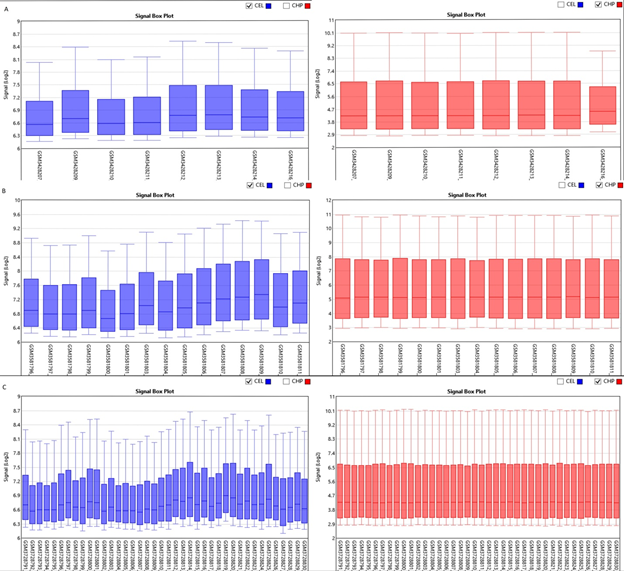
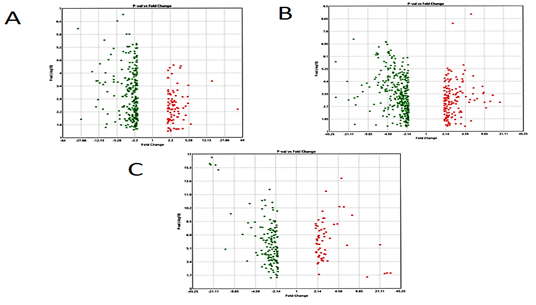
Boxplot displayed the data distribution based on five parameters i.e. (minimum, first quartile (Q1), median, third quartile (Q3), and maximum) stipulating about outliers, symmetry, grouping, and skewing of data Figure 1.2D-PCA was carried out using clustvis, Principal component analysis (PCA) [11] displayed inter and intra group variation among all the two groups (FSGS and control).Volcano plot shows statistical significance (P value) versus (fold change), enabling quick visual identification of the most biologically significant genes with large fold changes. Where green dots show upregulated DEGs in FSGS and red dot shows down regulated DEGs in FSGS. Venn diagram analysis was done by using Bioinformatics & Evolutionary genomics online freely available web tool (http://bioinformatics.psb.ugent.be/webtools/Venn/)...
2.4 Pathway and gene set enrichment analysis
On the basis of the DEGs from the three datasets, gene ontology (GO) and kegg pathway annotations were performed with help of phylogenetic tree using Shiny GO, REACTOME pathways by FUNRICH software and cross validation was done by Enrichr. GO analysis is a widely useful bioinformatics tool to investigate the annotation of gene and proteins. The pathways of REACTOME and KEGG mainly include: metabolism, genetic information processing, environmental information related processes, cell physiological processes. gene ontology database integrated in funrich can perform biological analyses of genes. It is a comprehensive software program for interpretating biological functional annotations. P value of p<0.05 was identified as significant difference. Lastly ora (over representation analysis) method using webgestalt online web tool was used for annotation and Visualization of DEGs.
2.5 Protein-protein Interaction, Metascape, Cytoscape and Cytohubba Analysis
STRING (Search Tool for the Retrieval of Interacting Genes/Proteins) and same open-source tool for network visualization of genes and proteins. Protein-protein interactions (PPI) of the DEGs were constructed from the STRING database and were visualized by cytoscape. Hubgenes are identified using cytohubba algorithm plugin in cystoscope. The Molecular Complex Detection (MCODE) algorithm has been applied to identify densely connected network components. The MCODE networks identified for individual gene lists have been gathered and are shown in Figure. Pathway and process enrichment analysis has been applied to each MCODE component independently, and the three best-scoring terms by p-value have been retained as the functional description of the corresponding components, shown in the tables underneath corresponding network plots
2.6 Whole genome analysis
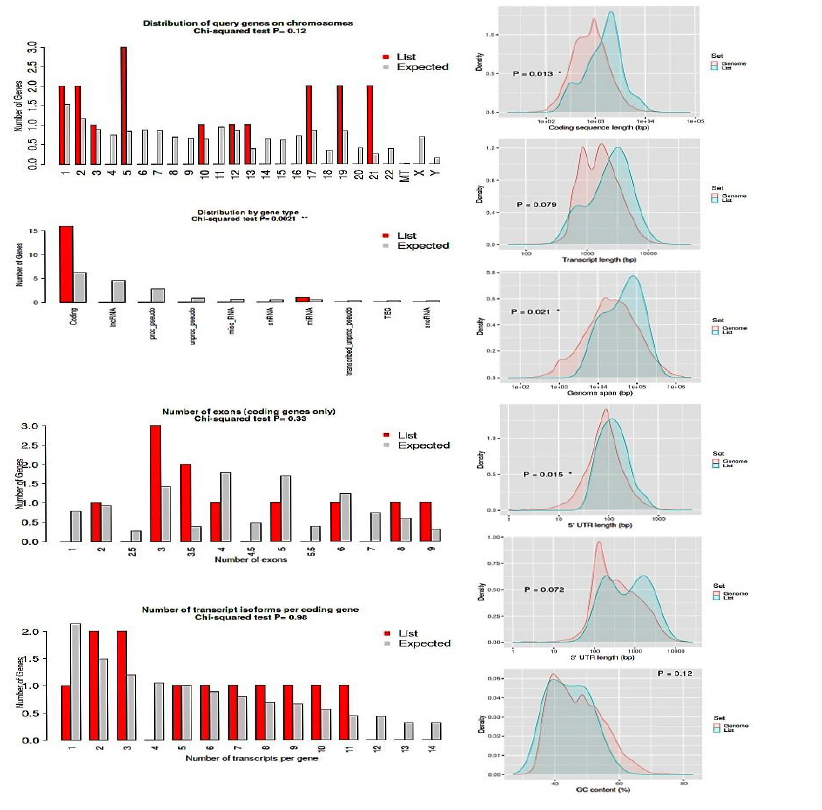
Characteristics of genes are compared with the rest in the genome. Chi-squared and Student's t-tests are run to see if your genes have special characteristics when compared with all the other genes or, if uploaded a customized background by using shiny Go v0.66.
2.7 Kidney specific RNAseq Analysis - (nephroseq)
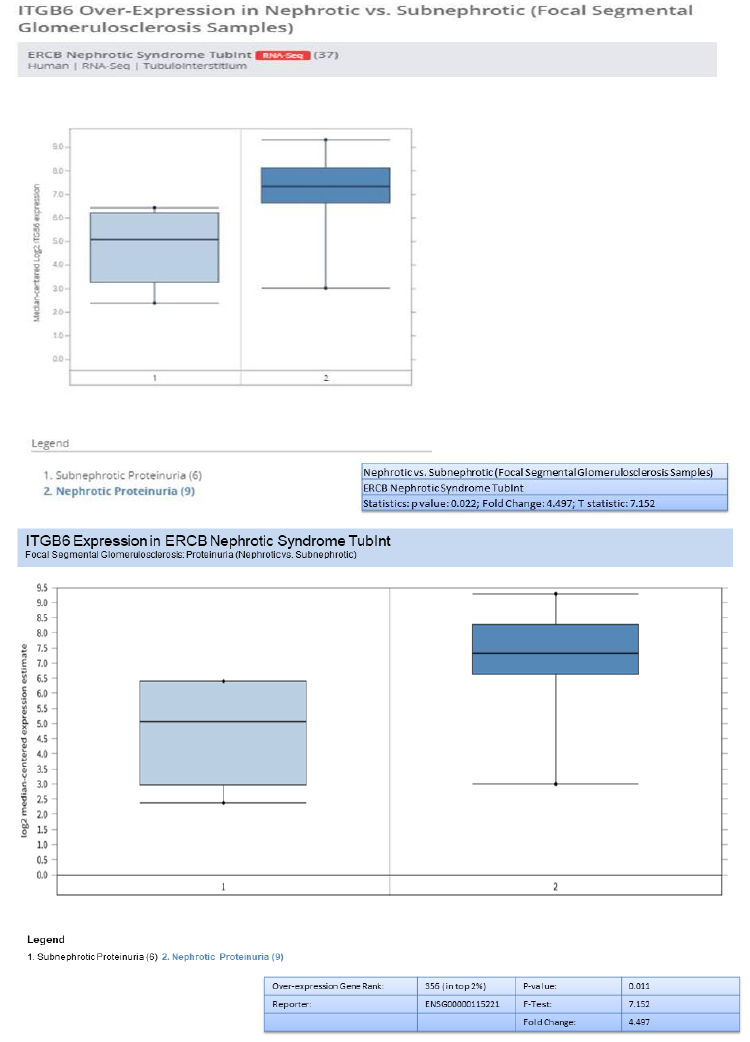
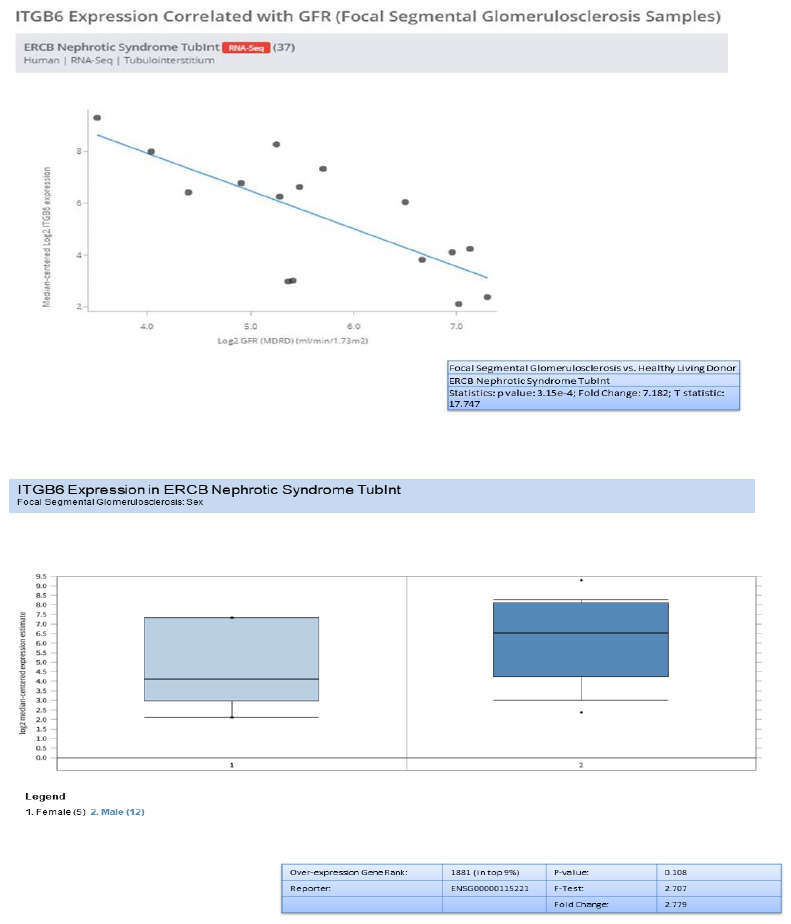
Validated genes (FN1, COL4A1, C3, ITGB6 and HAVCR1) were checked, in nephroseq a kidney specific ERCB RNAseq datasets in database and tested against major demographic parameter of kidney disease. Database contains RNA sequencing data from kidney tissue (glomeruli and tubulointerstitum). Not only mRNA overexpression correlation with eGFR and proteinurea was tested for each mRNA but also the overexpression was tested in other diabetes induced kidney diseases such as lupus nephritis, minimal change disease relative to healthy control. The analysis was focused in-order to validate the mRNA overexpression results found in FSGS relative to control in (microarray datasets).
3. Results
3.1 Identi?cation of degs between FSGS and normal kidney tissues
The three datasets were standardized and the results are shown in Figure 1 (boxplot). Then we deleted duplicated genes and values lacking specific gene symbols. A total of 350 DEGs were obtained in GSE121233. Among these degs, 81genes were up-regulated and 269 genes down-regulated Supplimentary table S2. Additionally, 488 degs were obtained from GSE125779; there were 147 up-regulated genes and 341down-regulated genes. In GSE129973 Supplimentry table S3, 214 degs were obtained. Among them, 58 were up-regulated and 156were down-regulated Supplimentary table S4. The degs from each dataset are shown in figure 2. (volcano plot).we used Euclidean distance and complete linkage method to perform hirerichal clustering. The top50 degs performed by heatmap are shown in 4 (heatmap).
3.2 Integration of DEGs
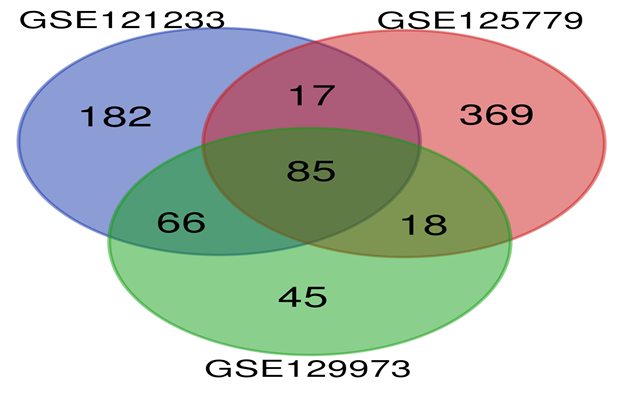
DEGs from the three datasets were subjected for Venndiagram. The intersection of the three datasets is shown in Figure 5 (venn diagram). Table 1 shows the 85 commonly Differentially Expressed Genes (DEGs) in all the three datasets including 16 Up-Regulated Genes and 69 Down-Regulated Genes.
|
DEGs (Differentially expressed genes) |
Gene name |
|
Up-Regulated-16 |
LUM,ABCG1, ADAMTS1, C3, MIR4521, PIGR, FN1, COL4A1, MYOF, ITGB6, CLDN1, REN, CDH6, C7, HAVCR1, NR1D1 |
|
Down-regulated-69 |
RNA5S15, GSTA1, RNA5S17, SNORD14E, TMEM174, RPS5, RNA5S10, SLC12A3, SNORD3B-2, FAM96B, DEFB1, SLC2A12, RNA5S3, SNORD3A, GSTA2, APOH, FOS, JUNB, PPM1K, RNF152, RNA5S1, PVALB, RNA5S13, TMEM52B, MIOX, RNA5S16, GSTA3, SNHG8, GSTM3, EGR1, HBB, KNG1, SNORD3C, HAO2, RNA5S11, RNA5S5, DCXR, EGF, HLA-DRB1, RNA5S14, RNA5S6, BRE-AS1, SNORD3D, CLDN8, CYP2B6, DUSP1, RNA5S4, PCK1, SAT2, GSTA5, G6PC, RNA5S7, ALB, RNA5S2, RNA5S8, ERRFI1, HPGD, KLF9, RNF212B, RNA5S12,TM4SF5, PDK4, APOM, CTGF, PRODH2, SNORD3B-1, MRO, HBA1, ESM1 |
3.3 KEGG, Pathway analysis
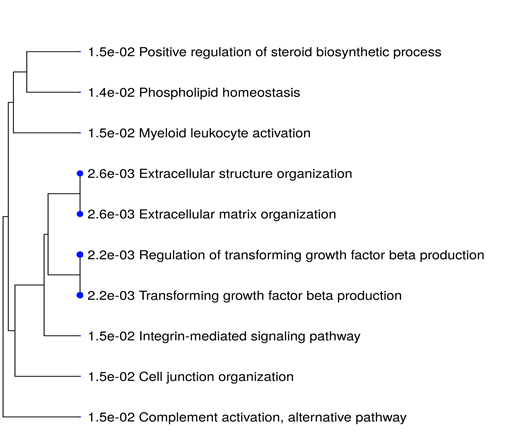
All the 16 commonly upregulated genes from three datasets were analyzed by phylogeny tree analysis using Shiny Go (http://bioinformatics.sdstate.edu/go/), which identified top ten highly enriched significant pathways as shown in supplementary table S5 and figure 6. Major pathways regulated by the DEGs. Were Extracellular matrix organizational pathway (ADAMTS1 COL4A1 LUM ITGB6 FN1), Integrin-mediated signaling pathway (ITGB6 FN1 ADAMTS1), Complement activation pathway and alternative pathway (C3&C7).
3.4 PPI Network Integration and Hubgenes Analysis
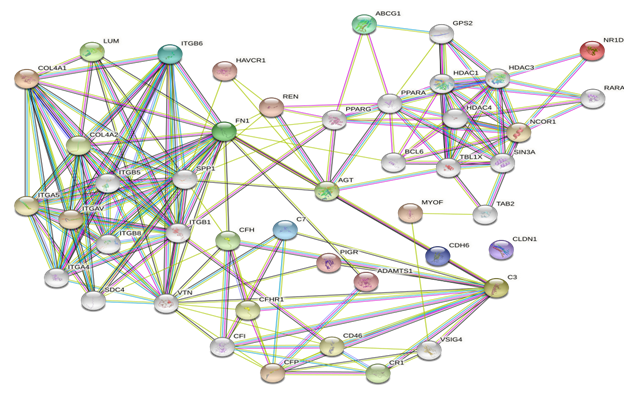
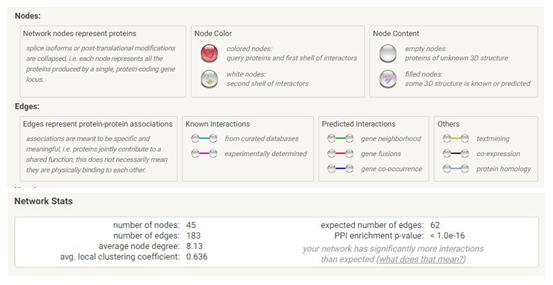
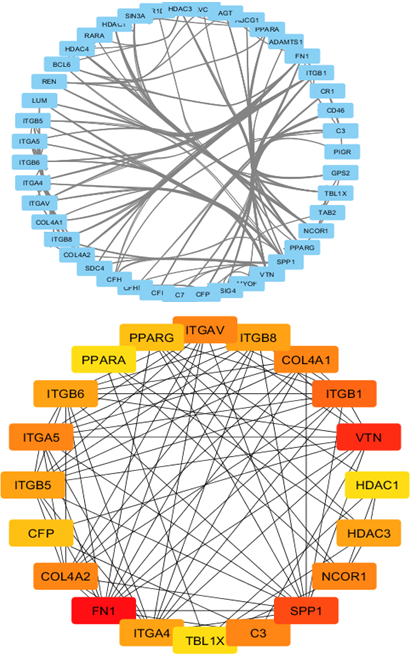
We used the STRING database (https://string-db.org) to investigate PPI networks for all 16 (LUM, ABCG1, ADAMTS1, C3, MIR4521, PIGR, FN1, COL4A1, MYOF, ITGB6, CLDN1, REN, CDH6, C7, HAVCR1, NR1D1) up-regulated genes in fsgs, we identified a significant gene network with number of nodes is 45 supplementary table S6 and number of edges is 183 supplementary table S6, following with PPI enrichment score P value<0.0001, shown in Figure 7. Network is visualized by cytoscape software further, we identified 11(HAVCR1, COL4A1, ABCG1, C3, ITGB6, LUM, MYOF, PIGR, C7, FN1, ADAMTS1) genes with higher interaction within gene network including four hub genes (Fibronectin-1(FN1), Complement C3 & collagen, type IV alpha 1 (COL4A1), Integrin β6 (ITGB6)) with greater degree of interaction from 20 hubgene network shown in figure 9 supplementary table S7. The Hubgenes identified were with node degree of greater than 10which were identified using cytohubba alogorithm plugin in cytoscape.
3.5 Pathway enrichment analysis and Functional gene enrichment ()
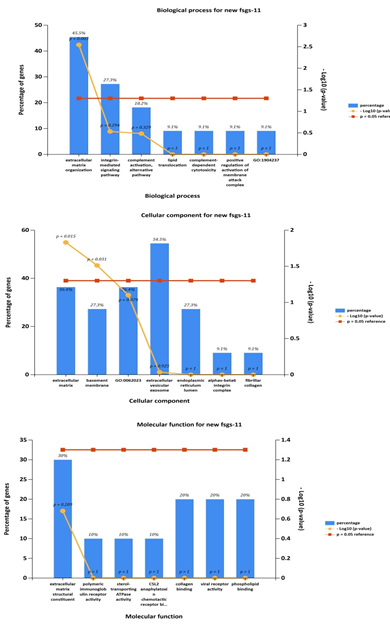
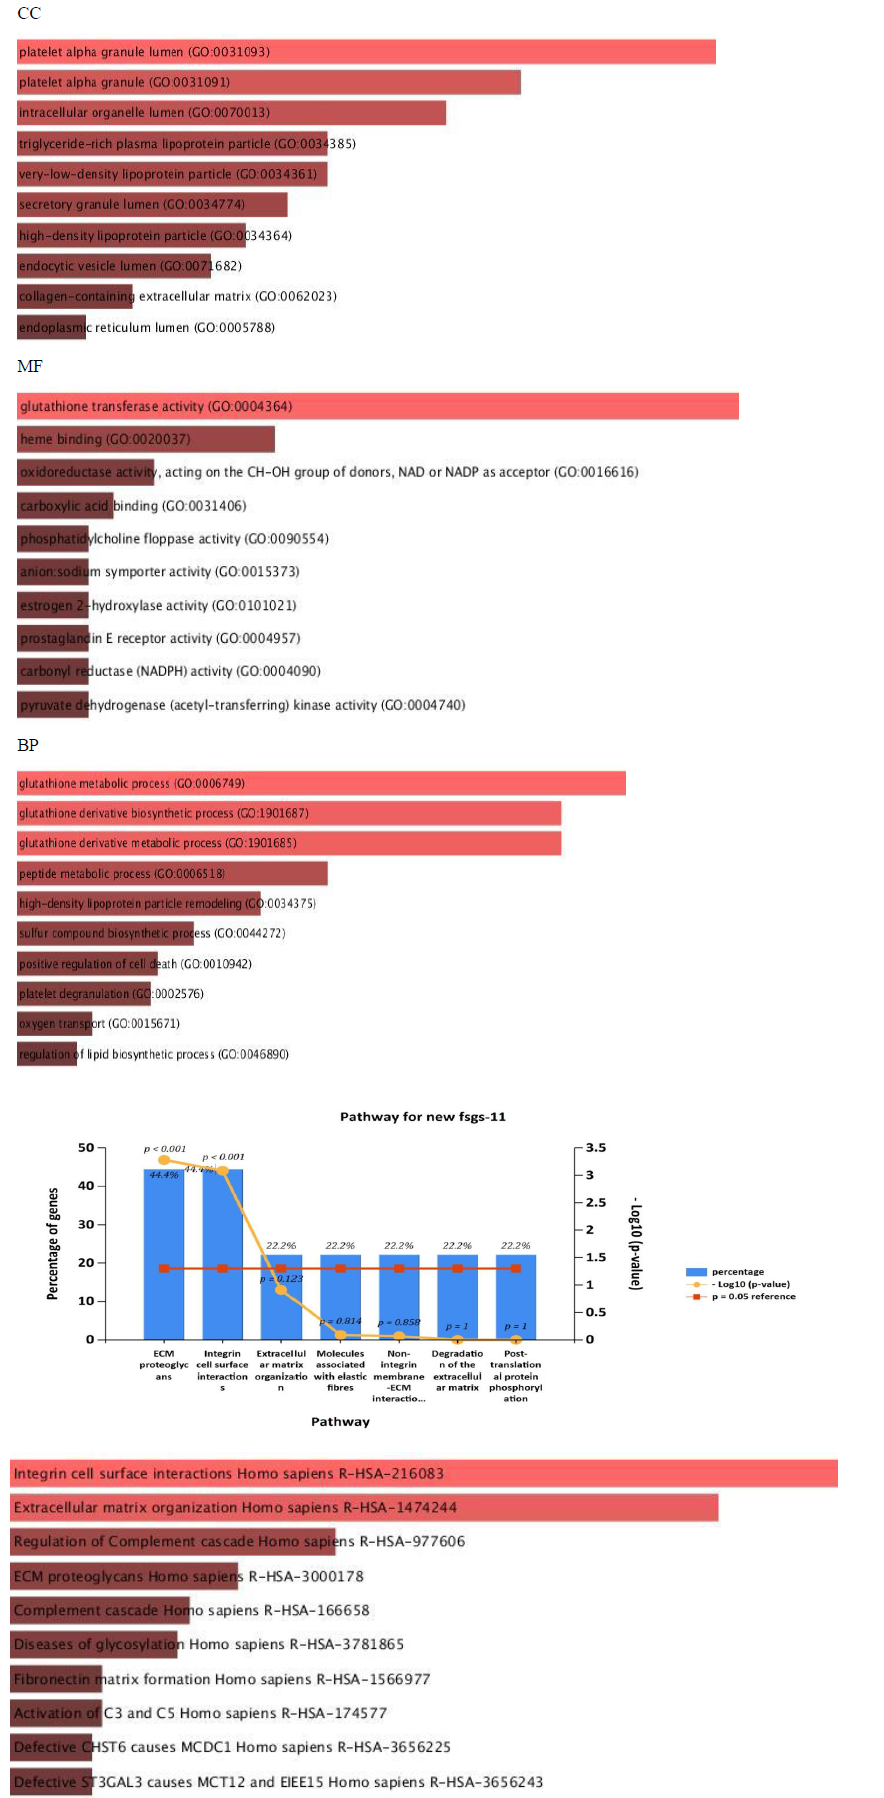
Gene ontology analyses of genes include molecular function, biological processes and cell composition. In our study, GO analysis was used to identify the functional process of the 11 commonly expressed in all three datasets (upregulated genes including four hubgenes) were carried out by the FUNRICH integrated with REACTOME and GENEONTOLOGY databases. The cellular component of DEGs. Shows enrichment of genes in extracellular matrix, molecular fuctions of the genes were majorly involved in extracellular matrix structure constituent and biological process was found mostly in extracellular matrix organization and integrin mediated signaling pathways, shown in Figure 8. The results suggested that DEGs were mostly involved in ECM proteoglycans and integrin mediated cell surface interactions pathway.
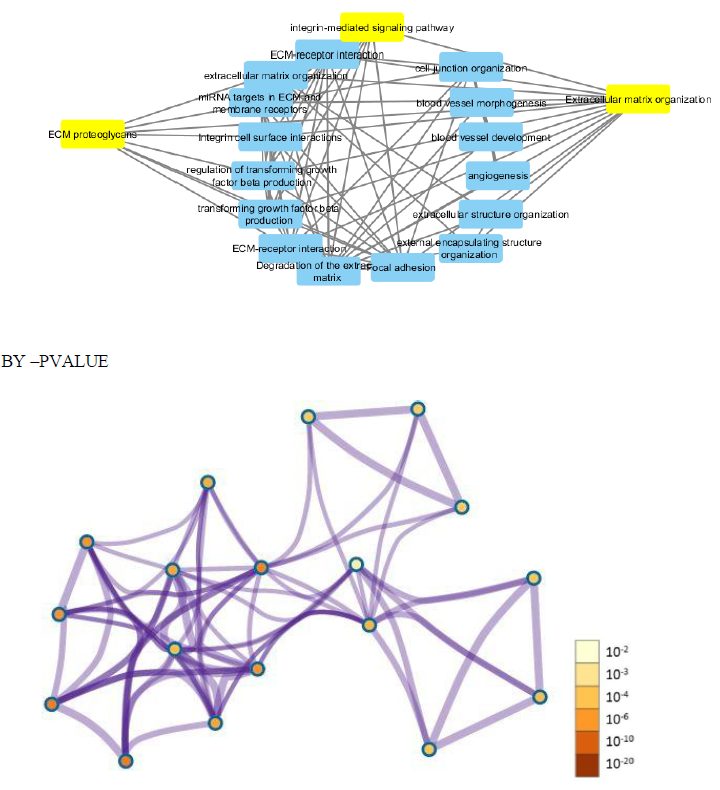
Further cross validation of the above results using enrichrwas done and we found the same results for gene ontology and pathways with more significant p value for each parameter P<0.01.figure 10 supplimentary table S8. The molecular complex detection (MCODE) algorithm has been applied to identify densely connected network components (biological process, molecular function, cellular components and biological pathways) .These parameters suggests major involvement of the genes in extracellular matrix organization, with specifically involved gene cluster as (COL4A1, FN1, ITGB6, LUM, ADAMTS1). Results shows regulation of ECM proteoglycans by genes (COL4A1, FN1, ITGB6, LUM) and integrin mediated signaling pathways are seen to be regulated by genes (COL4A1, FN1, ITGB6, LUM) with enrichment score 134 and 120 with p value p<0.01 and z score 21 and 14 moreover results suggests high significance. Shown in figure 11 and supplementary table S9.
3.6 ORA and GSEA analysis by using web gestalt
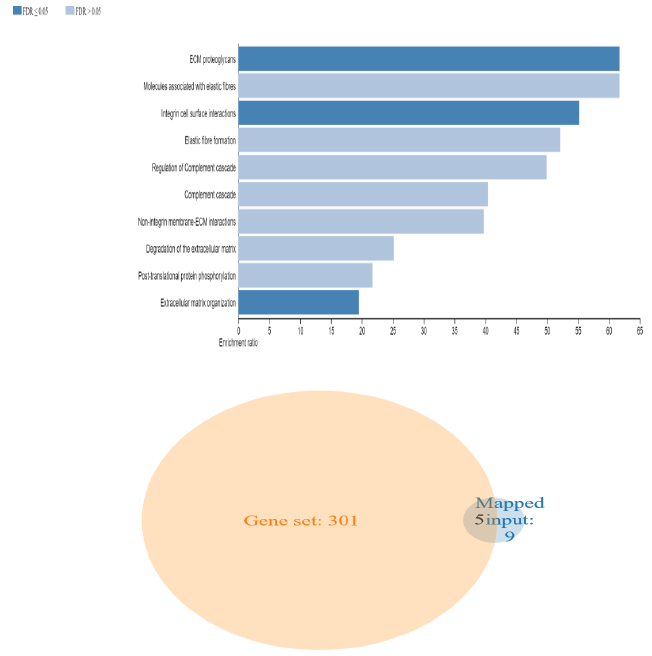
To further clarify the possible mechanism of action of related genes in diabetes, we performed GSEA analysis on genes up regualted in fsgs (HAVCR1, COL4A1, ABCG1, C3, ITGB6, LUM, MYOF, PIGR, C7, FN1, ADAMTS1).GSEA suggested higher expression of these genes in the resulted pathways.ECM proteoglycans was known to beregulated by genes (COL4A1, FN1, ITGB6, LUM) and integrin mediated signaling pathways was regulated by genes (COL4A1, FN1, ITGB6, LUM, ADAMTS1) in all three datasets) shown in supplementary figure 1. Over representation analysis suggested FN1, C3, ITGB6, COL4A1, C7 and LUM genes are enriched in above stated pathways identified with enrichment ratio more than 50% with p value P<0.0001. Shown in figure 12 and supplementary table S10
3.7 Genes Validation
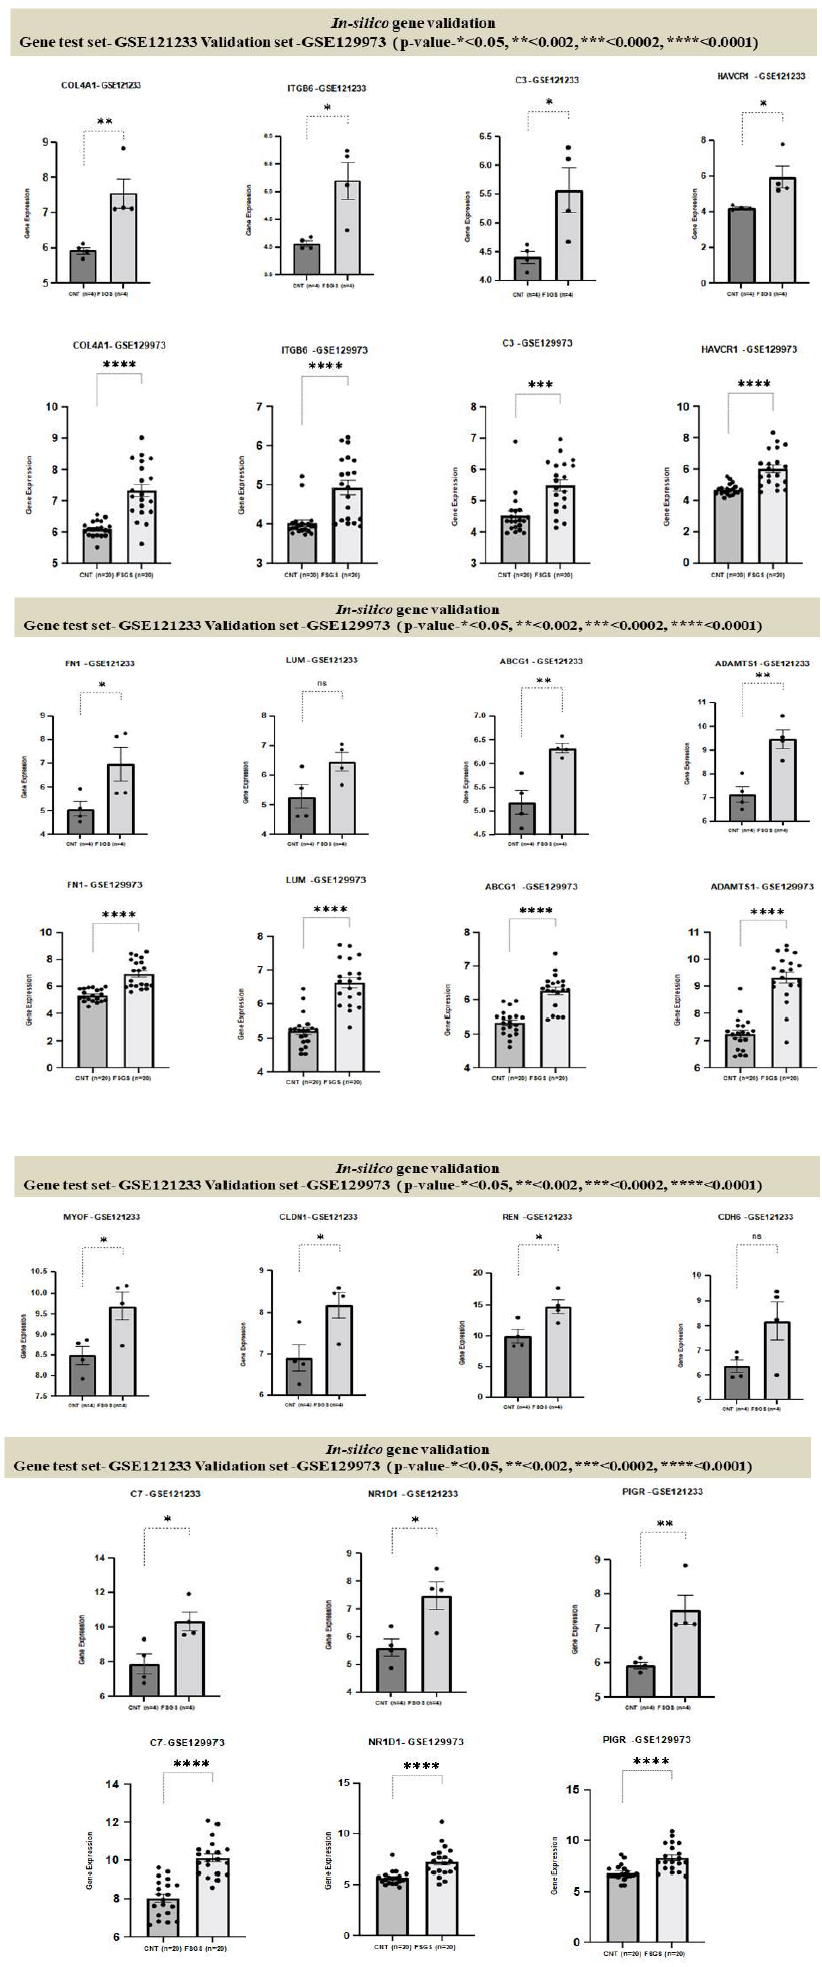
In our study five genes HAVCR1, COL4A1, C3, ITGB6, FN1 were validated by showing the same expression trends by comparing raw gene expression signals from each samples of the two datasets GSE121233 and GSE129973, results are shown in box plot figure 13.
3.8 Genome analysis
All the 16 (LUM,ABCG1, ADAMTS1, C3, MIR4521, PIGR, FN1, COL4A1, MYOF, ITGB6, CLDN1, REN, CDH6, C7, HAVCR1, NR1D1)commonly up regulated genes in all three datasets were tested against whole genome (human), All input gene were found to be enriched in coding region analyzed by using distribution by t test Chi-squared test with significant p value P < 0.0021. Coding sequence length (bp) showed p value P<0.013 and genome span relative to Density showed P<0.02 and all the 16 gene were identified significantly 5’UTR length (bp) relative to density. GC content lie between 40-60% for all input genes. Shown in figure xx. The characteristics of genes are compared with the rest in the genome. Chi-squared and Student's t-tests are run to see if our genes have special characteristics when compared with all the other genes.
3.9 Nephroseq analysis - (RNASeq)
In addition to validation of the five genes (HAVCR1, COL4A1, C3, ITGB6, and FN1) , we investigated the genes overexpression in RNA-seq data from European renal cDNA bank (ERCB:nephroseq.org) and confirmed that all the five genes have overexpression in FSGS relative to healthy control with significant fold change >1.5 and p value <0.05 shown in supplementary figure 1. We also checked the log2 GFR ml/min/1.73m2 (MDRD analysis) and proteinuria at baseline (g/24h) for each gene and found the correlation such as all the five gene expression indicates negatively correlation with GFR, FN1 with minimum Statistics: p value: 0.008; r value: -0.639; r2 value: 0.409, COL4A1 with minimum Statistics: p value: 0.015; r value: -0.595; r2 value: 0.354 , C3 with minimum Statistics: p value: 0.001; r value: -0.738; r2 value: 0.544 , ITGB6 with minimum statistics: p value: <0.01; r value: -0.639; r2 value: 0.409 and HAVCR1 with minimum Statistics: p value: 4.91e-4; r value: -0.770; r2 value: 0.592 and positively correlated to proteinuria confirmed by ERCB sub nephrotic relative to nephritic datasets RNA-seq samples in FSGS and found all the five genes were upregulated and out of which C3 and ITGB6 have fold change >4 and p value <0.05 where as other three found with fold change >1.5 which confirms the positive correlation of proteinuria. With gene over expression in FSGS. Further, in FSGS sample, with respect to sex (female relative to male) each gene expression is checked and output as a result found is gene FN1 and C3 is significantly upregulated in male with p value p<0.05 and fold change >2.5 whereas HAVCR1, COL4A1 and ITGB6 is upregulated with fold change >2 but p value is not significant shown in box plot supplementary figure 2.
4. Discussion
Although many studies related to FSGS have been performed, its cause and early diagnosis remains poorly understood. For effective early diagnosis and treatment, it is vital to illustrate the molecular mechanism of FSGS extensively. Transcriptome analysis results of all the three datasets when compared byvenn diagram analysis revealed 16 (LUM, ABCG1, ADAMTS1, C3, MIR4521, PIGR, FN1, COL4A1, MYOF, ITGB6, CLDN1, REN, CDH6, C7, HAVCR1, NR1D1) commonly upregulated genes. The GO term analysis of these DEGs showed that these genes were mainly enriched in extracellular matrix organization, integrin mediated signaling (as biological processes), extracellular vesicular exosomes, collagen containing extra cellular matrix(as cellular component) and extracellular matrix structural constituents (as major molecular function).
On analyzing the PPI network of these 16 DEGs we identified 11 (HAVCR1, COL4A1, ABCG1, C3, ITGB6, LUM, MYOF, PIGR, C7, FN1, ADAMTS1) genes with higher interaction within the network out of which using multiple algorithms of the cyto Hubba, 4 hub genes were identified i.e.,(Fibronectin-1(FN1), Complement C3& collagen, type IV alpha 1 (COL4A1), Integrin β6 (ITGB6) which are found to play an important role in the occurrence and development of FSGS.
Complement component C3 and C4 are frequently detected in the glomeruli of patients with idiopathic nephritic syndrome, including patients with minimal change disease and idiopathic FSGS along with glomerular IgM deposition [12, 13]. This complement component C3 plays a central role in the activation of complement system. Its activation is required for both classical and alternative complement activation pathways. It has been shown before that the complement system promotes inflammation and contributes to FSGS progression and is activated in patients with FSGS [14-16] and that mesangial deposition of C4D is associated with poor renal survival in patients with primary FSGS [17], following a similar pattern our analysis also showed over expression of this C3 compliment component in FSGS kidneys. The COL4A1 gene codes for the α1 chain of type IV collagen (α1(IV)), a major ubiquitous component of basement membrane. Col4a1 G498V mutations are known to result in delayed glomerulogenesis and podocyte differentiation without reduction of nephron number, causing albuminuria and hematuria in newborns, revealing a developmental role for the α1α1α2 collagen IV molecule in the embryonic glomerular basement membrane, affecting podocyte differentiation [18]. Defects in Col4a1 gene expression are also known to show defects in glomerular basement membrane leading to anterior segment dysgenesis and glomerulopathy [19, 20].
Our analysis reveals up regulation of COL4a gene in FSGS kidneys.ITGB6 is a member of the integrin superfamily. Members of this family are adhesion receptors that function in signaling from the extracellular matrix to the cell. The level of ITGB6is well studied to be increased in the tubulointerstitial tissues of the FSGS patients14. Similarly, our data also showed up regulation ofITGB6 in the FSGS kidneys. Fibronectin (FN1) an important extra cellular matrix protein is known to be involved in cell adhesion and migration processes including embryogenesis, wound healing, blood coagulation, host defense, and metastasis although its association in various glomerular diseases like fibronectin glomerulopathy [20, 21, 23], Iga glomerulonephritis [24] is well known. Our study revealed up regulation of this fibronectin1 gene in FSGS. Further the pathway analysis by REACTOME and KEGG showed that the 16 DEGs were mainly enriched in ECM proteoglycans and integrin cell surface interaction pathways and any alterations in these pathways may be responsible for the occurrence, development and progression of FSGS.
Histopathologic findings common to all variants of FSGS is focal and segmental deposition of new extracellular matrix (ECM) that obliterates glomerular capillaries. ECM is a complex molecular structure that provides a physical scaffold for all tissues and regulates cell and tissue physiology. ECM composition is tissue specific and undergoes continuous remodeling [25-27]. Proteomic studies identified about 250 proteins that comprise the normal glomerular ECM. Although alterations in glomerular ECM components is known to occur in FSGS [28-30]. In extracellular matrix organization the glomerular basement membrane (GBM) and extra-cellular matrix (ECM) are essential to maintain a functional interaction between the glomerular podocytes and the fenestrated endothelial cells in the formation of the slit diaphragm for the filtration of blood [31]. Dysregulation of this ECM homeostasis causes Focal segmental glomerulosclerosis (FSGS).The genes within the ECM organization category encode proteins with diverse functions including structural proteins such as collagen and cartilage components, proteins involved in cell-to-cell and cell-to-matrix interactions and enzymes involved in ECM remodeling. Certain proteomic Analysis Identifies Distinct Glomerular Extracellular Matrix in Focal Segmental Glomerulosclerosis as compared to other kidney diseases [32].
Podocytes are the major target of injury in many glomerular diseases as they're a component of the glomerular filtration barrier, and changes in their phenotype, such as foot process effacement and detachment from the glomerular basement membrane (GBM), are seen in almost all proteinuric diseases [33]. Podocytesmainly reflect its functions in glomerulus, including permeability barrier, stabilization of glomerular architecture and biosynthesis, lying outside the glomerular capillary with the body hanging freely in the urinary space connected via progressive cytoplasmic branches to the foot processes that are anchored to the GBM. Foot processes are extended cytoplasmic processes that connect with other foot processes from adjoining podocytes to completely cover the glomerular capillaries' exterior surface [34, 35]. This anchorage to the GBM is mediated by an integrin complex present in the focal contacts at the sole of the foot processes linked to a contractile structure containing actin, myosin, actinin, talin and vinculin [36]. As blocking these glomerular integrins causes podocyte separation, this integrin complex appears to be critical for the glomerular filtration barrier. A recent study using an integrin knockout mouse model provided evidence regarding the importance of this integrin in normal renal function [37] Integrins, despite their lack of intrinsic enzymatic activity, can activate a wide range of intracellular signaling pathways. Current theories propose that integrin cytoplasmic tails connect to signaling molecules such as kinases, which subsequently activate signaling cascades after integrin ligation. Biochemical studies have identified several cytoskeletal and potential regulatory molecules that interact directly with integrinsubunits. Direct binding is reported in vitro for talin, actinin, tensin, focal adhesion kinase (FAK) and integrin- linked kinase (ILK) with the integrins [38]. ILK has been implicated in cellular control of integrin-mediated cell-matrix interactions and cell proliferation. Its overexpression in epithelial cells resulted in a disorganization of cell-cell adhesion, probably caused by inhibition in the expression of E-cadherin. Recently is has been reported that there is involvement of ILK in the pathogenesis of some proteinuric kidney diseases [39]. As mentioned, the principal characteristic of those diseases is alteration in podocyte phenotype and genotype. Studies showed ILK activation in primary focal segmental glomerulosclerosis (FSGS) could alternatively activate the Wnt signaling pathway in podocytes in clinical studies and in vivo experimental models and this activation could be responsible for phenotype changes and contribute to events leading to the failure of the filtration barrier in focal segmental glomerular sclerosis by overexpression of (COL4A1, FN1, ITGB6, LUM) genes.
In addition, for validation of these highly interacting 11 genes we checked for their expression in RNAseq data base (Nephroseq) along with clinical parameters of FSGS i.e., decreased eGFR and increased proteinuria [40]. The magnitude of proteinuria at disease onset and during treatment has prognostic implications for renal survival as well as associated cardiovascular morbidity and mortality. Nephroseq database confirmed the overexpression of (FN1, COL4A1, C3, ITGB6 and HAVCR1) in FSGS. Genes were found to be highly significantly up regulated in FSGS as well as in other kidney diseases such as MCD and Lupus Nephritis. We found that these overexpressed genes have positive correlation with proteinuria and negative correlation with eGFR indicating that these genes could be as biomarker of the FSGS as they plays major role in pathogenesis of FSGS.
5. Conclusion
By combining three sets of human diabetes induced FSGS datasets from GEO for the first time, we were able to collect 16 upregulated genes in FSGS. Our insilico research by using microarray and rna-seq datasets discovered that ECM organization, extracellular matrix proteoglycans and integrins cell surface interface operate jointly and play significantly in pathogenesis of FSGS. We also discovered four hub genes with the highest degree of interaction in ppi gene network i.e. FN1, C3, ITGB6, and COL4A1by cytohubba algorithm, with their prominent pathways involved in major mechanism of FSGS. The findings of this study will be valuable in further research into the pathophysiology of FSGS in type 2 diabetes. More in vitro and in vivo research are needed in the future to confirm the relevance of these screened genes and pathways in the evolution of FSGS in type 2 diabetes.
Competing Interests
The authors declare that there are no competing interests associated with the manuscript.
Funding:
Author Contribution
Abbreviations
T2DM-Type 2 diabetes mellitus
CKD- Chronic kidney disease
DEGs- Differentially expressed genes
FSGS-Focal segmental glomerulosclerosis
References
- Annual Data Report. USRDS https://www.usrds.org/annual-data-report/
- Kitiyakara C, Kopp JB & Eggers P. Trends in the epidemiology of focal segmental glomerulosclerosis. Semin Nephrol 23 (2003): 172-182.
- Fundamentals of Renal Pathology | Agnes Fogo | Springer.
- Haas M, Meehan SM, Karrison TG & Spargo BH. Changing etiologies of unexplained adult nephrotic syndrome: a comparison of renal biopsy findings from 1976-1979 and 1995-1997. Am J Kidney Dis 30 (1997): 621-631.
- Bioinformatics analysis reveals novel hub gene pathways associated with IgA nephropathy | European Journal of Medical Research | Full Text.
- Identification of Lumican and Fibromodulin as Hub Genes Associated with Accumulation of Extracellular Matrix in Diabetic Nephropathy - Abstract - Kidney and Blood Pressure Research 46 (2021): 3.
- Rood IM, Deegens JKJ & Wetzels JFM. Genetic causes of focal segmental glomerulosclerosis: implications for clinical practice. Nephrol Dial Transplant 27 (2012): 882-890.
- Deleersnijder D, Craenenbroeck AHV & Sprangers B. Deconvolution of Focal Segmental Glomerulosclerosis Pathophysiology Using Transcriptomics Techniques. GDZ 1 (2021): 265-276.
- Ritchie ME et al. limma powers differential expression analyses for RNA-sequencing and microarray studies. Nucleic Acids Research 43 (2015): e47-e47.
- Whistler T, Chiang C-F, Lin J-M, Lonergan W & Reeves WC. The comparison of different pre- and post-analysis filters for determination of exon-level alternative splicing events using Affymetrix arrays. J Biomol Tech 21 (2010): 44-53.
- Raychaudhuri S, Stuart JM & Altman RB. Principal components analysis to summarize microarray experiments: application to sporulation time series. Pac Symp Biocomput (2000): 455-466.
- Gephardt GN, Tubbs RR, Popowniak KL & McMahon JT. Focal and segmental glomerulosclerosis. Immunohistologic study of 20 renal biopsy specimens. Arch Pathol Lab Med 110 (1986): 902-905.
- Habib R. et al. Immuno pathological findings in idiopathic nephrosis: clinical significance of glomerular ‘immune deposits’. Pediatr Nephrol 2 (1988): 402-408.
- Han R et al. C3a and suPAR drive versican V1 expression in tubular cells of focal segmental glomerulosclerosis. JCI Insight 4 (2019).
- IgM contributes to glomerular injury in FSGS - PubMed.
- Complement Activation in Patients with Focal Segmental Glomerulosclerosis.
- Mesangial C4d deposition is independently associated with poor renal survival in patients with primary focal segmental glomerulosclerosis - PubMed.
- HANAC Syndrome Col4a1 Mutation Causes Neonate Glomerular Hyper permeability and Adult Glomerulocystic Kidney Disease - PubMed.
- Dominant mutations of Col4a1 result in basement membrane defects which lead to anterior segment dysgenesis and glomerulopathy | Human Molecular Genetics | Oxford Academic.
- ER stress and basement membrane defects combine to cause glomerular and tubular renal disease resulting from Col4a1 mutations in mice | Disease Models & Mechanisms | The Company of Biologists.
- Fibronectin Conformation and Assembly: Analysis of Fibronectin Deletion Mutants and Fibronectin Glomerulopathy (GFND) Mutants | Biochemistry.
- Identification of mutations in FN1 leading to glomerulopathy with fibronectin deposits. - Abstract- Europe PMC.
- Castelletti, F et al. Mutations in FN1 cause glomerulopathy with fibronectin deposits. Proc Natl Acad Sci USA 105 (2008): 2538-2543.
- Jennette JC, Wieslander J, Tuttle R & Falk RJ. Serum IgA-fibronectin aggregates in patients with IgA nephropathy and Henoch-Schönlein purpura: diagnostic value and pathogenic implications. The Glomerular Disease Collaborative Network. Am J Kidney Dis 18 (1991): 466-471.
- Theocharis AD, Skandalis SS, Gialeli C & Karamanos NK. Extracellular matrix structure. Adv Drug Deliv Rev 97 (2016): 4-27.
- Menou A, Duitman J & Crestani B. The impaired proteases and anti-proteases balance in Idiopathic Pulmonary Fibrosis. Matrix Biol 68-69 (2018): 382-403.
- Vizovišek M, Fonovi? M & Turk B. Cysteine cathepsins in extracellular matrix remodeling: Extracellular matrix degradation and beyond. Matrix Biol 75-76 (2019): 141-159.
- Common histological patterns in glomerular epithelial cells in secondary focal segmental glomerulosclerosis - PubMed.
- The parietal epithelial cell is crucially involved in human idiopathic focal segmental glomerulosclerosis - PubMed.
- Differential expression of parietal epithelial cell and podocyte extracellular matrix proteins in focal segmental glomerulosclerosis and diabetic nephropathy - PubMed.
- IJMS | Free Full-Text | ECM Characterization Reveals a Massive Activation of Acute Phase Response during FSGS.
- Proteomic Analysis Identifies Distinct Glomerular Extracellular Matrix in Collapsing Focal Segmental Glomerulosclerosis - PubMed.
- Shankland SJ. The podocyte’s response to injury: role in proteinuria and glomerulosclerosis. Kidney Int 69 (2006): 2131-2147.
- Faul C, Asanuma K, Yanagida-Asanuma E, Kim K & Mundel P. Actin up: regulation of podocyte structure and function by components of the actin cytoskeleton. Trends Cell Biol 17 (2007): 428-437.
- The role of podocyte injury in the pathogenesis of focal segmental glomerulosclerosis - PubMed.
- Kreidberg J A. Functions of alpha3beta1 integrin. Curr Opin Cell Biol 12 (2000): 548-553.
- Kreidberg JA et al. Alpha 3 beta 1 integrin has a crucial role in kidney and lung organogenesis. Development 122 (1996): 3537-3547.
- Regulation of cell adhesion and anchorage-dependent growth by a new beta 1-integrin-linked protein kinase - PubMed.
- Kretzler M et al. Integrin-linked kinase as a candidate downstream effector in proteinuria. FASEB J 15 (2001): 1843-1845.
- Molecular Mechanisms of Proteinuria in Focal Segmental Glomerulosclerosis - PubMed.




 Impact Factor: * 3.0
 Acceptance Rate: 76.32%
  Time to first decision: 10.4 days
  Time from article received to acceptance: 2-3 weeks
