Methods of applying QSAR to predict In vivo and In vitro activity Relationship Paradigm
Bhuvnesh Rai*, Medha Srivastava, Dharmendra Kumar Chaudhary*
Department of Molecular Medicine and Biotechnology, Sanjay Gandhi Postgradutae Institute of Medical Sciences, Lucknow, 226014, India
*Corresponding Author (s): Bhuvnesh Rai, Dharmendra Kumar Chaudhary, Department of Molecular Medicine and Biotechnology, Sanjay Gandhi Postgradutae Institute of Medical Sciences, Lucknow, 226014, India
Received: 17 July 2020; Accepted: 24 July 2020; Published: 27 July 2020
Article Information
Citation: Bhuvnesh Rai, Medha Srivastava, Dharmendra Kumar Chaudhary. Methods of applying QSAR to predict In vivo and In vitro activity Relationship Paradigm. International Journal of Applied Biology and Pharmaceutical Technology 11 (2020): 160-169.
View / Download Pdf Share at FacebookAbstract
Abstract
The Chemical structure is correlated by QSAR with an activity relationship using many statistical approaches. It is the model used for the various purposes as a prediction of activities in in-vivo and in-vitro activities of molecules which are not being tested chemically. These efforts have been simulated by scientists for a there wider range of applications as toxicology, etc. Algorithms available for generating Quantitative Structure-Activity Relationship (QSAR) are single biological activity based on multiple regressions with molecular descriptors of a data set. Such an analysis is providing correlation only with a specific biological activity either in vitro or in vivo or specific target thus limiting their use in only one environmental condition. If one would like to use an integrated approach for comparison of activity measured in vitro with that of in vivo, the current methods have limitations. “The objective of my work is to identify the potential descriptors set explaining activities in vitro and in vivo. PLS regression was employed to predict the in vitro and in vivo activity using the set of potential descriptors. This procedure yielded improved predictability of biological activity from potential molecular descriptors. QSAR models are scientifically given credibility as the tool for prediction and classification of activities of untested molecules biologically and chemically.
Keywords
<p>QSAR; PLS; <em>In vivo</em>; <em>In Vitro</em></p>
Article Details
Introduction
A new drug molecule to be discovered requires a lot of syntheses, time, and money. To be identified out of billions of molecules only a few such as one or two reach the clinical trials. This causes a problem in the treatment of various diseases. The QSAR approach is highly effective in solving the above problem [1,2]. QSAR approach identifies and quantifies the drugs physiochemical property and checks weather that property has an observable effect on the biological activity of the ‘drug’. QSAR includes all methods by which we statistically relate the activities with physiochemical properties [3]. With the help of QSAR models, the biological activity of a new or untested molecule can be obtained from the structure of similar compounds whose activities are known before. In 1865, Crum-Brown and Fraser established a relation between the “physiological action” (Φ) and chemical structure C where Φ was expressed as a function of C. This is deemed to be the first articulation of a QSAR [4].

In 1893, Richet correlated the toxicities of simple organic molecules with their corresponding solubility in water [5]. At the beginning of the 20th century, Meyer and Overton independently suggested that the narcotic activity of a group of organic compounds was linearly related to their respective lipophilicity [6,7]. In the 1930’s, Taft found a way for separating resonance, steric, polar effects and introducing the first steric parameter, ES [8]. The work of Hammett and Taft prepared the foundation for the development of the QSAR by Hansch and Fujita. The first method published by Hansch and Fujita for calculating log P from the structure was a procedure which involved 'substitution' and was developed with substituent pi constants for aromatic rings [9]. The parameter π which is the relative hydrophobicity of a substituent was defined. π was expressed as the difference between log PX and log PH where PX is the partition coefficient of a compound where X is the substituent and PH is that of the parent compound. They combined hydrophobic constants with Hammett’s electronic constants to yield the linear Hansch equation [10]. In the later years, the necessity to solve new and complex problems, together with the contributions of many other investigators who had worked in the same field, generated many variations of the Hansch approach to the building of a QSAR, as well as approaches that are completely new [11]. QSAR involves a standardized procedure with many steps which include preparation of the dataset containing an accurately simulated molecular model with biological activity, selection of molecular descriptors, selection of a good model, validation and training the model using a training set and testing the model with the help of a testing dataset. During the preparation of the dataset, the quality of the data which is used to develop the QSAR has to be done with utmost care. Data used should be taken from the same assay and it is recommended to use the data which has been obtained from a single source to keep away from inconsistency in data. The number of molecules in the dataset should be large enough to satisfy the statistical stability of the QSAR and the biological activity should be in value in a good distribution. Then the descriptors of the molecules in the dataset are generated and selected. Many descriptors are present but only a few shows a significant correlation with biological activity. Hence, the selection of the right descriptors, which best represent the difference in structure and information plays a major role to obtain a good QSAR. Many mechanisms such as machine learning techniques can be used for the selection of descriptors. Molecular descriptors are generated for all the molecules in the dataset. Then a suitable statistical or mathematical model is decided to find a relationship between the descriptors and activities. MLR, PLS and approaches such as Neural Network or Support Vector Machine can be used for correlating the descriptors with biological activities. The training set consists of a random set of molecules chosen from the known dataset. The remaining molecules are then considered as a part of the test set. After the model is chosen it is being trained using the training set. During the training of the model, validation methods are performed to ensure the stability and predictability of the QSAR. The model is trained until the achievement of a satisfactory result. The model is then tested and the biological activity values of the test set molecules are predicted. The closer the predicted values are to the actual values the better the model.
Methods and Materials
Two datasets were used for the study.
3.a. Dataset 1 [12] comprises of 23 pyridine derivatives which target HIV-1 replication (In Vivo Target) as well as the Topoisomerase II β Kinase activity (In Vitro Target). Topoisomerase II β Kinase is an enzyme present in the HIV-1 virus particles and hence acts as an ideal target for control of HIV-1 replication.
3.b. Dataset 2 [13] contains 26 bisphosphonates which target Farnesyl Diphosphate Synthase (In Vitro Target ) as well as P. Falciparum (In Vivo Target). Farnesyl Diphosphate Synthase acts as an ideal target for the P. Falciparum cell growth.
3.c. ChemSketch was developed by the ACD/Labs and is used for drawing chemical structures of molecules, schematic diagrams [14]. ChemSketch was used for drawing the chemical structures of the molecules present in the datasets 1 and 2.
3.d. ALOGPS 2.1 is an online program used for calculating the hydrophobicity (log P) and solubility (logS) of the molecules using the Associative Neural Network Method [15]. This program was used for calculating the solubility (log S) in the study.
3.e. R is an open source originally developed by Ross Ihaka and Robert Gentleman (Ihaka and Gentleman). It is an open source machine learning/programming language designed for computational analysis. It can be extended by standardized collections of code called “packages” [16]. R programming language was used to build the QSAR for predicting the in vitro and in vivo activities. Packages used rcdk package it is bodywork for chemoinformatics. The user can access functionality in the CDK with the help of this package. The user can calculate molecular descriptors, load molecules from the dataset and evaluate fingerprints. The structures of the molecules can also be viewed in 2D [17]. The 1-rcdk package was used for loading the molecules and calculating the molecular descriptors. 2-Caret Package contains a group of functions that helps in creating models to be predicted. The models are tuned by the tools contained by caret package, splitting of the data, pre-processing the data and selection of features [18]. The caret package was used for performing PLS and tuning the model with K-fold cross validation. 3- lattice package, it is a very effective data visualization package. It mostly gives emphasis to multivariate data [19]. The lattice package was used to plot xy plots. 4-latticeExtra package this package was built on the foundation laid down by the lattice package. This package provides several new high-level functions and methods [20]. The lattice Extra package was used for adding an extra layer of points on top of xy plots.
The descriptors used for predicting the in vitro and in vivo activity are-1-Hybrid descriptors BCUT - It is an Eigen value-based descriptor. This descriptor is used extensively in the analysis of diversity. 2-Constitutional descriptors, A-Largest Pi system detector-This descriptor gives us the number of atoms in the largest Pi system. B-Molecular weight-This descriptor gives us the Molecular weight of the molecule. 3-Electronic descriptors, A-H-bond donor count-This descriptor gives us the number of hydrogen bond donors present. B-H-bond acceptor count-hydrogen bond acceptors present. C- Bpol descriptor-calculates sum of the absolute value of the difference between atomic polarizabilities of all bonded atoms in the molecule (including implicit hydrogens). 4-TPSA descriptor-This descriptor calculates the Topological polar surface area based on the contribution of fragments.
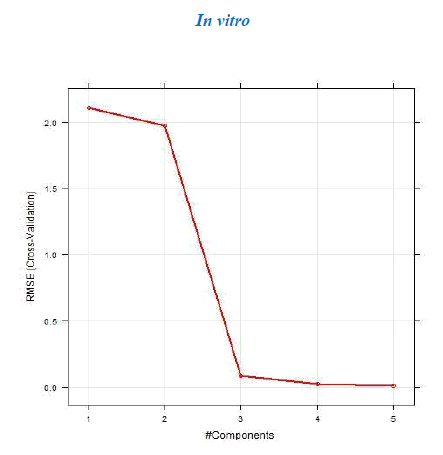
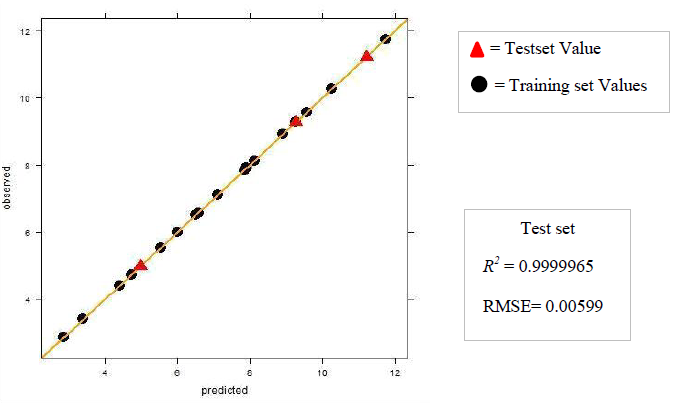
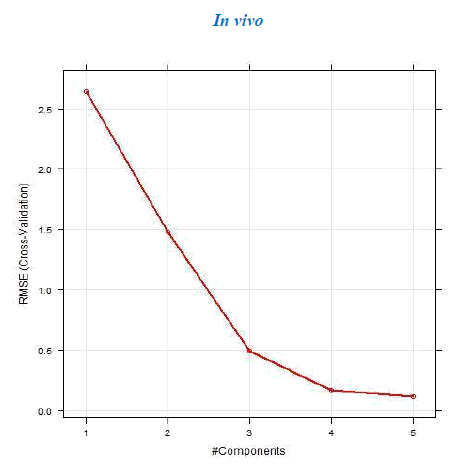
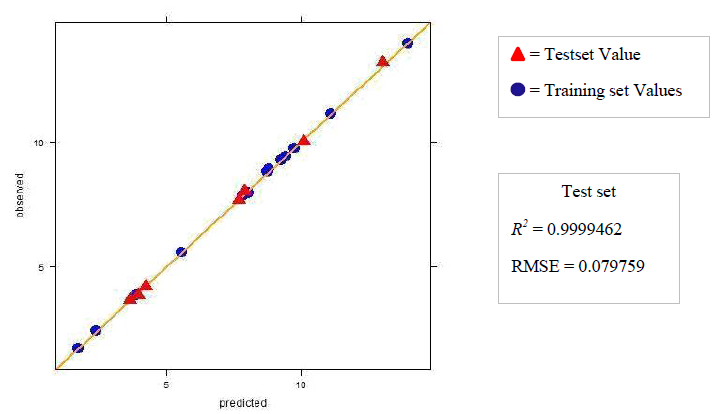
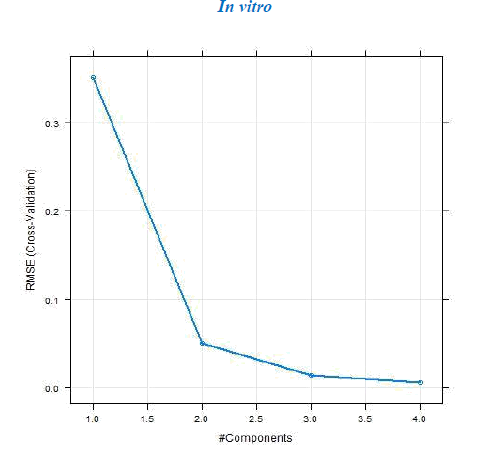
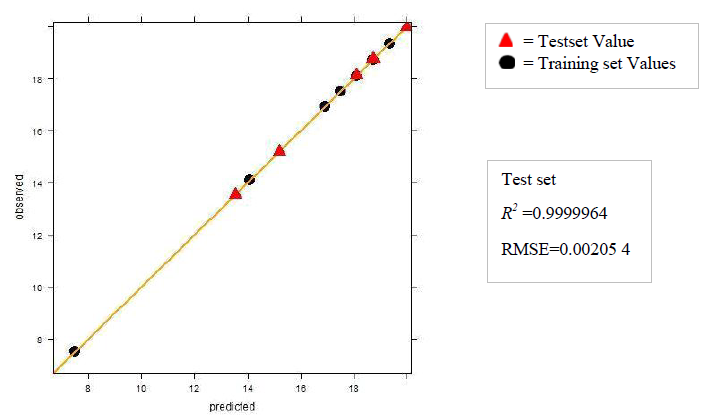
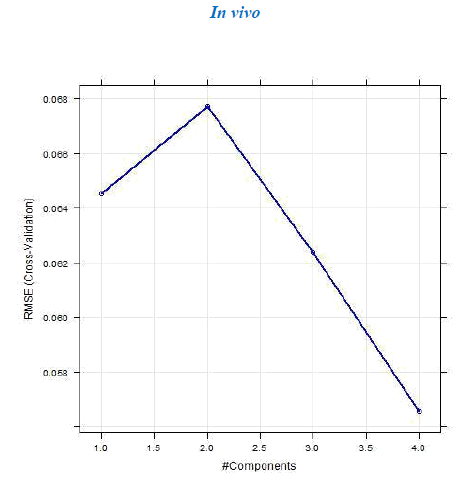
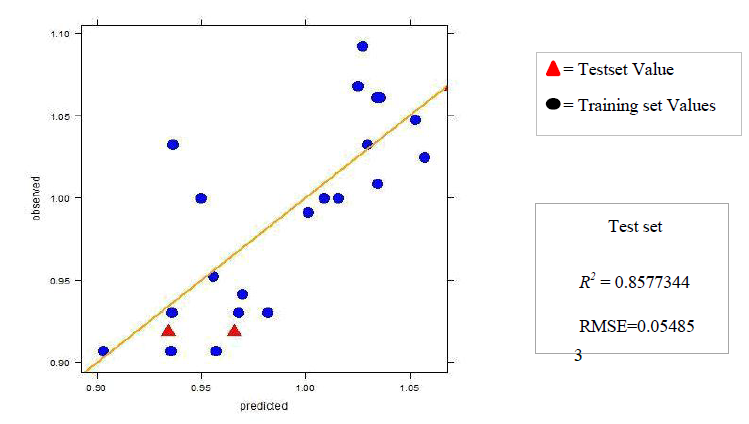
The dataset was prepared by sketching the molecules in chemsketch. Based on whether the in vivo or in vitro activity has to be determined the corresponding set of descriptors was calculated using the rcdk package. The data were then pre-processed and normalized using the Box-cox normalization technique. The data is then divided into training and test set and Partial Least Square regression was performed. If the R2 obtained was less than 0.5 then the data was refined by removing the outliers. The model was then tuned with k-fold cross-validation to determine the number of components for which the RMSE is the least. The tuning of the model was done with the help of caret package. The test and training set values are then predicted and the R2 and RMSE are then computed. The value of the R2 and RMSE obtained gives us an overview of the predictability of the model. The regression plots for both the sets training and test are then plotted and the activity of any new molecule can be determined with the help of the developed model.
Results
a. Dataset 1
4.b. Dataset 2
Discussion
The R2 (cross-validated) obtained by our model for dataset 1 and dataset 2 was better than the one reported. The R2 reported for dataset 1 was 0.642 for in vitro and 0.358 for in vivo and the error estimate was 0.076 while our model gave R2 of 0.9999462 and 0.9999965 for in vivo and in vitro respectively and an error of 0.079759 in vivo and 0.00599 in vitro. The R2 reported was 0.74 for in vivo while our model gave R2 of 0.8577344. The in vitro model was not reported for dataset 2.
Conclusion
QSAR means that the biological activity modifications of a sequence of chemicals aimed at a specific mode of action are associated with shifts in behavioral, physical and chemical properties. As these structurally connected properties of a chemical can probably be calculated far more efficiently using in vitro and in vivo approaches by experimental or computational means than by its biological activity. In our study the predictive ability of the model as seen by the regression plots was better than the reported model.
References
- Perkins R, Fang H, Tong W, et al. Quantitative structure?activity relationship methods: Perspectives on drug discovery and toxicology. Environmental Toxicology and Chemistry: An International Journal 22 (2003): 1666-1679.
- Salum LB, Andricopulo AD. Fragment-based QSAR: perspectives in drug design. Molecular Diversity 13 (2009): 277-285.
- Esposito EX, Hopfinger AJ, Madura JD. Methods for applying the quantitative structure-activity relationship paradigm. InChemoinformatics (2004) : pp 131-213.
- Brown AC, Fraser TR. On the connection between chemical constitution and physiological action; with special reference to the physiological action of the salts of the ammonium bases derived from strychnia, brucia, thebaia, codeia, morphia, and nicotia. Journal of Anatomy and Physiology 2 (1868): 224.
- Kubinyi H, editor. 3D QSAR in drug design: volume 1: theory methods and applications. Springer Science & Business Media (1993).
- QSAR: Hansch Analysis and Related Approaches - Google Books. https://books.google.co.in/books?id=3uUxtRfYYXgC&pg=PA183&dq=Meyer,+H.,+Arch.+Exp.+Path.+Pharm.+42,+109-118+(1899)&hl=en&sa=X&ved=0ahUKEwiFprOx75DpAhVWfH0KHZoqC0UQ6AEIJzAA#v=onepage& q=Meyer%2C%20H.%2C%20Arch.%20Exp.%20Path.%20Pharm.%2042%2C%20109-118%20 (1899)&f=false.
- Bultinck P, De Winter H, Langenaeker W, et al. Computational medicinal chemistry for drug discovery. CRC Press (2003).
- Hammett LP. Some relations between reaction rates and equilibrium constants. Chemical Reviews 17 (1935): 125-136.
- Taft Jr RW. Polar and steric substituent constants for aliphatic and o-Benzoate groups from rates of esterification and hydrolysis of esters1. Journal of the American Chemical Society 74 (1952): 3120-3128.
- Fujita T, Iwasa J, Hansch C. A new substituent constant, π, derived from partition coefficients. Journal of the American Chemical Society 86 (1964): 5175-5180.
- Hansch C, Dunn III WJ. Linear relationships between lipophilic character and biological activity of drugs. Journal of Pharmaceutical Sciences 61 (1972): 1-9.
- HIV-1 associated Topoisomerase IIβ kinase: a potential pharmacological target for viral replication. http://www.ndsl.kr/ndsl/search/detail/article/articleSearchResultDetail.do?cn=NART66480262.
- Mukkamala D, No JH, Cass LM, et al. Bisphosphonate inhibition of a Plasmodium farnesyl diphosphate synthase and a general method for predicting cell-based activity from enzyme data. Journal of Medicinal Chemistry 51 (2008): 7827-7833.
- Moser A, Wheeler P, Hayward S. Dereplication of Natural Products by NMR: A Three-Stage Approach ACD/Structure Elucidator Suite and ACD/Labs’ Content Databases.
- Tetko IV, Gasteiger J, Todeschini R, et al. Virtual computational chemistry laboratory–design and description. Journal of Computer-aided Molecular Design 19 (2005): 453-463.
- R Development Core Team. a language and environment for statistical computing: reference index. R Foundation for Statistical Computing (2010).
- Guha R. Chemical informatics functionality in R. J Stat Softw 18 (2007): 1-6.
- Caret: Classification and Regression Training version 6.0-86 from CRAN. https://rdrr.io/cran/caret/.
- Sarkar D. Lattice: multivariate data visualization with R. Springer Science & Business Media (2008).
- Sarkar D, Andrews F. lattice Extra: Extra Graphical Utilities Based on Lattice (2019).


 Impact Factor: * 3.0
 Acceptance Rate: 76.32%
  Time to first decision: 10.4 days
  Time from article received to acceptance: 2-3 weeks
