The Relationship of Cell Cycle Phases and Embryonic Development of Bothrops Snakes
Corrêa PG1,2, Maria DA1,3
1Departamento de Cirurgia, Faculdade de Medicina Veterinária e Zootecnia da Universidade de São Paulo, 05508-270, São Paulo, Brazil
2Laboratório de Ecologia e Evolução, Instituto Butantan, 05503-900, São Paulo, Brazil
3Laboratório de Biologia Molecular- Divisão de Desenvolvimento e Inovação, Instituto Butantan, 05503-900, São Paulo, Brazil
*Corresponding Author: Corrêa PG, Departamento de Cirurgia, Faculdade de Medicina Veterinária e Zootecnia da Universidade de São Paulo, 05508-270, São Paulo, Brazil & Laboratório de Ecologia e Evolução, Instituto Butantan, 05503-900, São Paulo, Brazil & Laboratório de Biologia Molecular- Divisão de Desenvolvimento e Inovação, Instituto Butantan, 05503-900, São Paulo, Brazil.
Received: 17 December 2019; Accepted: 26 December 2019; Published: 03 January 2020
Article Information
Citation: Correa PG, Maria DA. The Relationship of Cell Cycle Phases and Embryonic Development of Bothrops Snakes. Arch Biochem Mol Biol 10 (2020): 001-016.
View / Download Pdf Share at FacebookAbstract
Squamatas are the only strain of reptiles with species that give birth to free- living neonates (viviparity), capable of living independently of extraembryonic tissues. In many Viperidae species reproduction is seasonal, but not all females reproduce in a given year. Intra and interspecific variations also occur in relation to mating and follicular activity, thus allowing hormonal changes responsible for physiological events. The routine deposit of infertile and abnormal eggs in both oviparous and viviparous Squamata species is routinely reported. Follicular atresia is a hormonally controlled degenerative process by which ovarian follicles, at various stages of development and growth, of mammalian and non- mammalian vertebrates lose their integrity and are eliminated before ovulation. Apoptosis, a fundamental mechanism for germinal cell removal, a highly regulated and highly efficient cell death program. In order to monitor and investigate the high number of atretic eggs released by captive Bothrops snakes, we investigated possible apoptotic cell death studing cell cycle as a molecular approaches. Different cell cycle phases were identified in the embryos of captive Bothrops snakes. In Gate-1 the cells were mostly in division (Mitosis) than Gate-2. In both gates the cells are in phase S, synthesizing proteins and DNA to divide. The atretic eggs showed different stages of development, differentiation and maturation, and that cells were involved in the organogenesis of these snake species. The hypothesis from: "Is atretic egg fertilized?" to atretic egg. In this study was confirmed by the identification of germinal disks in different stages of organogenesis, which expressed different stages of growth kinetics and cell differentiation. Oxidative stress can modulate cell development in cell division leading to cell fragmentation and cell death.
Keywords
<p>Cell Cycle; Embryonic Development</p>
Article Details
1. Introduction
1.1 The cell cycle
Where a cell arises, there was a cell previously. Just as animals can only come from animals, plants can come from plants. This cellular doctrine proposed by the german pathologist Rudolf Virchow in 1858 carries with it a message for the continuity of life (Alberts et al., 2011).
The cycle of duplication and division, known as the cell cycle, is the main cellular mechanism by which all living beings reproduce (Nurse, 2000). Cell proliferation is an extremely coordinated mechanism in which progression through the phases of the cycle is very precisely regulated by a very complex biochemical network that signals the progress and passages between G0/G1, S, G2/M (Schaffer, 1998). The cycle of cell division is coordinated and regulated by events in which cells duplicate their genetic material (DNA) and are divided into two daughter cells (Hirata et al., 2011).
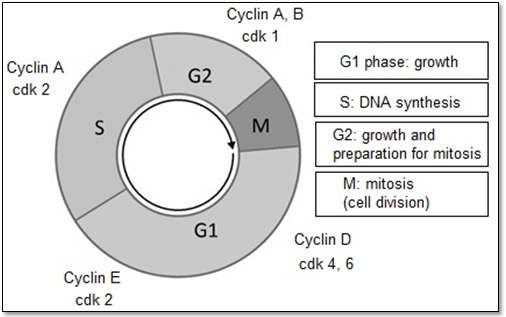
The activation of nuclear division and the separation process of daughter cells occur in mitosis (M phase). The period between one mitosis and another one is called interphase. The process of nuclear DNA replication occurs in the S (synthesis) phase where chromosomal DNA is replicated (Alberts et al., 2011). The gap phases are the interval between the end of mitosis and the beginning of DNA synthesis, called G-1 phase, and the interval between the end of synthesis and the beginning of mitosis is the G-2 phase. These phases provide additional time for cell growth (Alberts et al., 2011; Hirata et al., 2011; Schaffer, 1998). This process is fundamental for maintaining the proliferation rate, to ensure the correct replication of genetic material. Proteins such as cyclins and CDKs (cyclin-dependent kinases) are translated at these intervals G-1 and G-2, which can be activated and thus positively controlling the cell cycle (Figure 2). In these phases the checkpoints occur for the cell to continue dividing, senescence or apoptosis.
The process of replicating DNA and dividing a cell can be described as a series of coordinated events that compose a “cell division cycle”. At least two types of cell cycle control mechanisms are recognized: a cascade of protein phosphorylations that relay a cell from one stage to the next and a set of checkpoints that monitor completion of critical events and delay progression to the next stage if necessary. The first type of control involves a highly regulated kinase family (Morgan, 1995; 1997).
Kinase activation generally requires association with a second subunit that is transiently expressed at the appropriate period of the cell cycle; the periodic “cyclin” subunit associates with its partner “cyclin-dependent kinase” (CDK) to create an active complex with unique substrate specificity. Regulatory phosphorylation and dephosphorylation fine-tune the activity of CDK–cyclin complexes, ensuring well-delineated transitions between cell cycle stages. In the future, additional molecular definition of the cell cycle may lead to a more intricate progression (NASA; Kettenbach, 2018).
Proteins such as cyclins and CDKs (cyclin-dependent kinases) are translated at these G-1 and G-2 intervals and can be activated and positively control the cell cycle (Figure 1). At these stages, checkpoints occur for the cell to continue dividing, become senescent or apoptotic (Alberts et al., 2011; NASA; Kettenbach, 2018) (Figure 1).
Checkpoints with activators or inhibitors. Cyclins, cyclin-dependent kinase protein (CDKs) and kinase inhibitor proteins (KIP).
1.2 Programmed cell deathDuring the evolution of vertebrates several genes have evolved to develop functions of systemic nutrient carriers. Embryonic development is complex and influenced by several factors, being entirely dependent on an adequate balance between proliferation (cell cycle), differentiation and cell death (Nurse, 2000).
For a long time, cell death was considered a passive degenerative process that occurs in situations of cell damage, infection and absence of growth factors. As a consequence, the cell alters the integrity of the plasma membrane, increases its volume and loses its metabolic functions (Choi, 2019). However, not all cell death events are passive processes. Multicellular organisms are capable of inducing programmed death in response to intra- and extracellular stimuli (Hengartner, 2000).
Apoptosis, a regulated form of cell death, is an essential physiological process for embryonic development, adult tissue homeostasis, and regulator of the immune system (Kyrylkova et al., 2012).
In the developing embryo, disseminated apoptosis actively sculpts body shape during organogenesis (Xiao; Tsutsui, 2013). In adult tissues it is also common, and its occurrence varies with tissue turnover. In the nervous system, heart, liver and kidney, where proliferation rate is low, reduced apoptosis is observed under physiological conditions (Bennedetti et al., 1988; Xiao; Tsutsui, 2013).
1.3 AtresiaFollicular atresia is a hormonally controlled degenerative process whereby ovarian follicles from vertebrates recruited for development do not complete maturity, lose their integrity and are eliminated before ovulation (Morais et al., 2012).
In mammals, more than 99% of ovarian follicles suffer atresia during development and are resorbed by the ovary before maturing (Hughes; Gorospe, 1991; Kaipia; Hsueh, 1997; Jiang et al, 2003).
Several studies suggest that apoptosis is the fundamental molecular mechanism for the removal of germinal and somatic cells in the ovary of mammals and birds (Tilly et al., 1991; Hussein, 2005).
Numerous authors report that controlling litter production (the number and size of eggs) involves two physiological mechanisms, follicular resorption or atresia (Lack, 1947; 1954; Jones, 1978; Duellman; Trueb, 1986; Godfray et al., 1991). Embryo resorption allows females to manipulate sex ratios in mammals, and factors such as stress caused by poor body conditions or disease can induce termination of pregnancy (Bonnet et al., 2008).
Follicular atresia is a hormonally controlled degenerative process by which ovarian follicles, at various stages of development and growth, of mammalian and non-mammalian vertebrates lose their integrity and are eliminated before ovulation (Guraya, 1973). In mammals, most ovarian follicles suffer atresia during development and are reabsorbed into the ovary before maturing (Hughes; Gorospe, 1999).
Several studies suggest that apoptosis is the fundamental molecular mechanism for the removal of germinal and somatic cells in the ovary of mammals and birds (Tilly et al., 1991; Hussein, 2005).
Apoptosis is a highly regulated and highly efficient cell death program characterized by a series of typical morphological events such as cell shrinkage, fragmentation in membrane-bound apoptotic bodies and rapid phagocytosis by neighboring cells. The morphological changes observed are a consequence of a cascade of specific and genetically regulated molecular and biochemical events (Saraste; Polkki, 2000; Galluzzi et al., 2018).
Animals were chosen from a related group (family Viperidae, subfamily Crotalinae, genus Bothrops), whose incidence of deposition of atretic follicles in captivity has been more frequent and abundant throughout the year in our laboratory (in the animals of the research group), relative to other species.
The species under study have presented high deposition rates of captive atretic follicles for long years of observation and in several species of Squamatas, viviparous and oviparous, with no data published so far on the investigation of this phenomenon from the molecular point of view.
2.3 Objective
The present work aims to investigate, with biochemical and molecular tools, processes involved in the high number of atretic eggs released in captivity by different species of viviparous snakes, genus Bothrops. We investigated cell cycle and DNA fragmentation that indicate cell death or cell proliferation of these species under study.
To realize the investigation and highlight possible processes of apoptotic cell death with molecular approaches, the following specific objectives were proposed:
- Collection and isolation of embryonic stem cells from atretic egg with germinal discs;
- Analysis, with flow cytometry, of the phases or period of the cell cycle that cells are in (G0/G1, S or G2/M) and monitoring of DNA
3. Methods
3.1 Keeping animals in captivity
We monitored the snakes from our vivarium in the lab: one female of the species B. moojeni, three animals of the species B. jararaca and 10 females of B. insularis. From the Biological Museum we monitored two females in captivity from the species B. erythromelas and B. leucurus.
The animals were kept individually in transparent plastic boxes (56.4 x 38.5 x 37.1cm) with perforated lid and sides lined with corrugated cardboard. In the room where the boxes containing these animals were kept the natural conditions of photo-period (latitude 23ºS), temperature and humidity, which are often monitored and noted. They were fed with mice (Mus musculus) from the Bioterium at regular intervals of 30 days, respecting the proportion of 10 to 20% of the individual's weight. Fresh water ad libitum was provided.
The eggs released in the boxes at the time of parturition were harvested and frozen for cell processing.
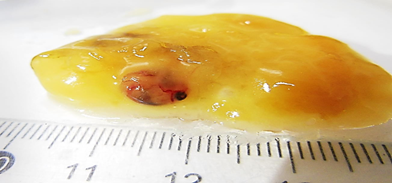
After morphometry, fragments of atretic frozen eggs were dissected on an ice bath (Petri dish with dry ice) and had the germinal disc, embryo or yolk sac cut out when present (Figure 2).
Fertilized atretic egg from Bothrops insularis specie, with embryo to purify stem cells to analize the cell cycle phases.
3.2 Cell cycles phases>The determination of the cell cycle was performed on FACScalibur flow cytometry (BD) using the methodology of propidium iodide. Samples of embryos or germinal disks were removed from the cryopreservation in dry ice and were macerated with the plunger of a 20 ml syringe and washed in PBS solution. Then the cell suspensions were incubated with 0.1 mg /l ribonuclease A (Sigma Chemical Co. - USA) and centrifuged at 2000 g, to 4 ° C for 15 minutes. The cells were incubated with 18 g / ml propidium iodide (Sigma Chemical Co. - USA) for 15 minutes at room temperature protected from light, followed by acquisition and analysis in flow cytometry. The analysis was performed with the identification of the cell population in "gate" or quadrant defined homogeneous cell population acquired by the acquisition of image "Cell Quest," making it in the flow cytometer FACScalibur (BD). The DNA histograms were analyzed by a computer program MOD-FIT (BD). The method allowed to evaluate, by detecting changes in DNA, the ploidy it was in the cell during the cell cycle. The results were expressed as mean percentage of cells in different phases of the cell cycle: apoptosis, G0/G1, S, G2 / M and aneuploidy.
3.3 Statistical Analysis
Statistical analysis was performed by Student's t method in Graph Pad Prism v5 software. Values are expressed as mean ± standard deviation, considering as significant the p values <0.05.
4. Results
4.1 Follicles released in captivity
The amount of atretic follicles with respective number of eggs by species was:
- erythromelas four eggs with germinal disc;
- jararaca five eggs with germinal disc;
- insularis two eggs with germinal disc;
- leucurus two eggs with germinal disc and
- moojeni, five eggs with germinal disc.
4.2 Cell cycle phase analysis
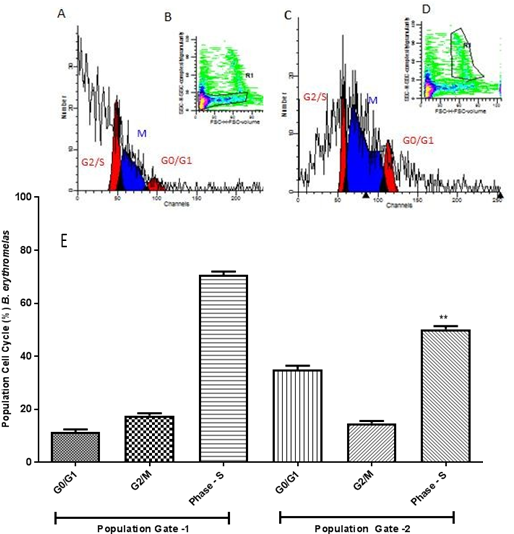
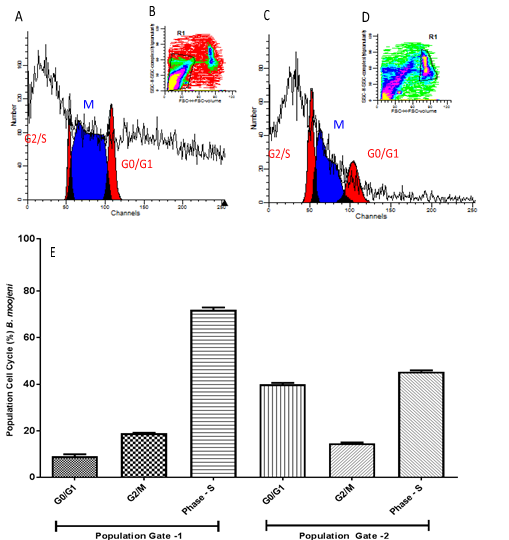
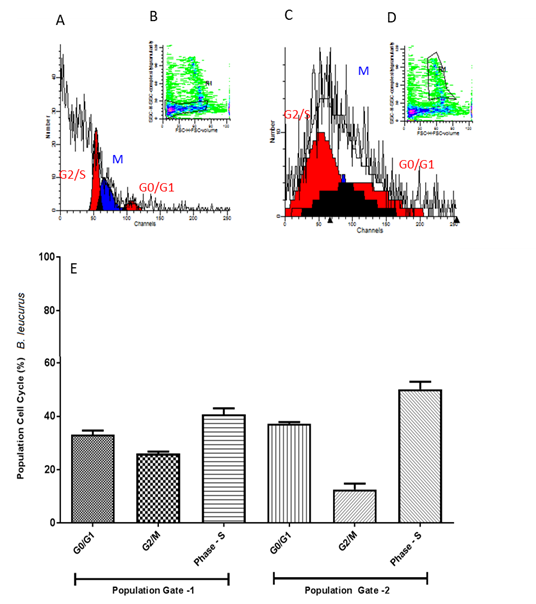
Cell cycle phase analyzes (sub-G1 / fragmented DNA, G0 / G1, S and G2 / M) of the embryo sample cell populations of different species were presented in histograms of DNA content distribution per cell, and in bar graphs representing the mean ± sd. In addition, the different populations were separated and analyzed in Gates called Gate 1 and Gate 2 and for each analyzed their cell cycle (Figures 3 to 8).
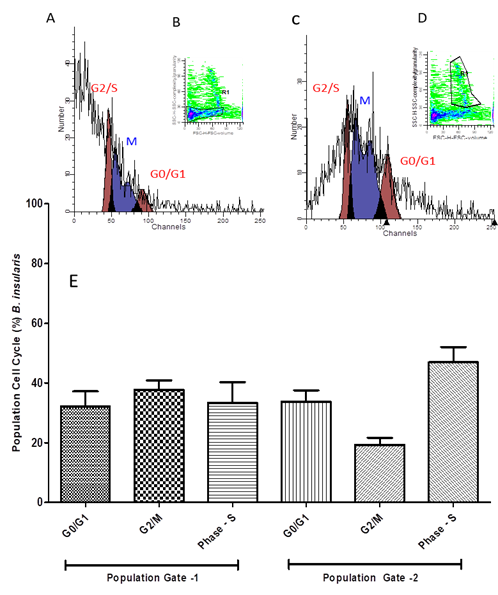
In B. insularis samples, the cell populations obtained in Gate 1 and Gate 2 showed significant differences, the cells are increased in S phase and significantly decreased in G2 / M phase in Gate 2, as shown in Figure 3, demonstrating their difference in proliferative potential.
(A) Dotplot graph expressing germinal disk atretic egg cells in phases of the cell cycle. Analyzed on FACS Calibur cytometer with fluorochrome propidium iodide marker for cell population 1 (Gate 1) in dotplot graph (B). In (C) histogram for population 2 (Gate 2) of cells in dotplot graph (D). In (E) Average per cell population ± standard deviation of cell cycle percentage of cells. One way ANOVA statistical calculations generated in GraphPrism v5 software.
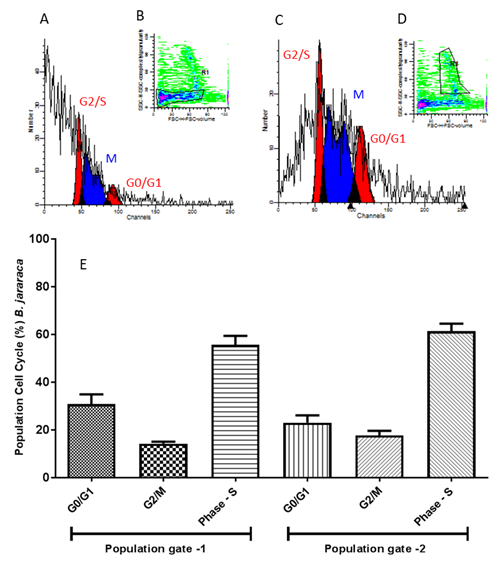
In B. jararaca samples Gates 1 and 2 had no significant differences, as well as in the distribution of cells in the different phases of the cell cycle.
(A) Dotplot graph expressing germinal disk atretic egg cells in phases of the cell cycle. Analyzed on FACS Calibur cytometer with fluorochrome propidium iodide marker for cell population 1 (Gate 1) (B). In (C) histogram for cell population 2 (Gate 2) (D). In (E) Average per cell population ± standard deviation of cell cycle percentage of cells. One way ANOVA statistical calculations generated in GraphPrism v5 software.
In B. erythromelas samples the cell populations obtained in Gate 1 and Gate 2 showed significant differences, the cells are decreased in S phase and significantly increased in G0 / G1 phase in Gate 2, as shown in Figure 5, demonstrating their difference in proliferative potential.
(A) Histogram model of germinal disk atretic egg sample analyzed by FACS Calibur cytometer with fluorochrome propidium iodide marker for cell population 1 (Gate 1) (B). In (C) histogram for cell population 2 (Gate 2) (D). In (E) graph with mean of all B. erythromelas eggs and one-way ANOVA statistical calculations generated in GraphPrism v5 software. ** p <0.01.
In B. moojeni samples the cell populations obtained in Gate 1 and Gate 2 showed significant differences, the cells are decreased in phase S and significantly increased in phase G0 / G1 in gate 2, as shown in figure 14, demonstrating their difference in proliferative potential.
- Histogram model of germinal disc atretic egg sample analyzed by FACS Calibur cytometer with fluorochrome propidium iodide marker for cell population 1 (Gate 1) (B). In (C) histogram for cell population 2 (Gate 2) (D). In (E) graph with average of all eggs of species B. moojeni and one-way ANOVA statistical calculations generated in GraphPrism v5 software. Ns = not
In B. leucurus samples the cell populations obtained in Gate 1 and Gate 2 showed no significant differences, the cells are decreased in G2 / M phase and significantly increased in S phase in Gate 2, as shown in Figure 7, demonstrating their difference. in the proliferative potential.
(A) Histogram model of germinal disk atretic egg sample analyzed by FACS Calibur cytometer with fluorochrome propidium iodide marker for cell population 1 (Gate 1) (B). In (C) histogram for cell population 2 (Gate 2) (D). In (E) graph with average of all eggs of the species B. leucurus and one-way ANOVA statistical calculations generated in GraphPrism v5 software. Ns = not significant.
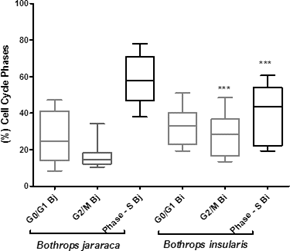
When comparing all species summing the Gates 1 and 2 of each species, there were only significant differences between B. jararaca and B. insularis species in the G2 / M and S phases of the cell cycle, according to the mean ± sd graph in figure 8.
Significant differences between the cells of B. insularis and B. jararaca. ***= p <0.001 between G2 / M phase and S phase (DNA and protein synthesis).
4.3 Fragmented DNA
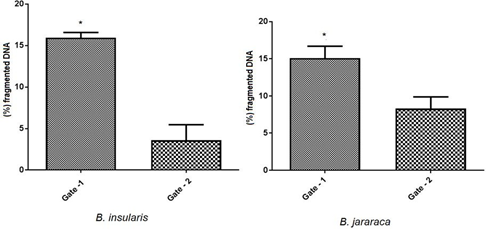
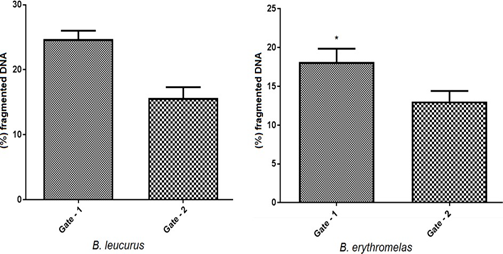
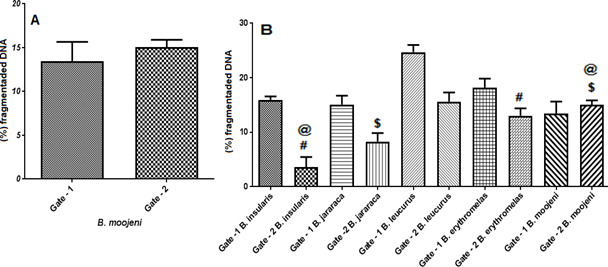
The percentage of fragmented DNA was obtained during the cell cycle experiment. The cells in Gate 1 had higher percentage of fragmented DNA indicating cell death. Statistically there were significant differences in Gate1 of B. insularis and B. jaracaca species when compared to Gate-2 (Figure 9).
Mann Whitney t-test: fragmented DNA, comparison by cell population (Gate 1 and 2), by species. Graph Pad Prism v7. * p <0.05.
Mann Whitney t-test: fragmented DNA, comparison by cell population (Gate 1 and 2), by species. Graph Pad Prism v7. * p <0.05.
(A) By t-Mann Whitney test: percentage of fragmented DNA between Gate 1 and 2 in B. moojeni with Graph Pad Prism v7.
(B) ANOVA test after Tukey test (multiple comparisons): significant differences in Gate 2 between B. insularis and B. erythromelas (#); B.jararaca and B. moojeni ($): p<0.05. Between B. insularis and B. moojeni (@): p <0.01.
5.4 Cell cycle and DNA fragmentationThe formation of many cells from a single fertilized egg involves a series of complex and highly coordinated processes including cell proliferation, quiescence, apoptosis and latent cells. Under normal conditions, the quiescent cell without cell division is in G-0. Some continue to divide as needed, and apoptosis ensures that there is no excessive accumulation of cells in the tissues. Thus, many checker proteins are required to induce or cease cell proliferation, maintaining or preventing cycles of cell division, initiating or inhibiting apoptosis. As is the case with cyclins, cyclin-dependent kinases (CDKs), mitosis promoting factor, which act as positive and fundamental cell cycle controllers.
Both populations of B. insularis cells showed significant differences in percentage of fragmented DNA, being higher in population 1 (Mann Whitney test, p value <0.05). However, both populations (gates 1 and 2) presented higher percentage of cells in the check phases, G-1 and G-2 when compared with other species.
Oxidative stress is one of the factors that can alter or inhibit proteins at cell cycle checkpoints. The most important phases in whether or not cells are proliferating is by checking the checkpoint phases, G-1 and G-2.
In general, cyclin synthesis and consequent activation of CDKs result in the phosphorylation of specific proteins that promote cell cycle progression. The changes in the cellular microenvironment lead to internal damage that generates intracellular signals that influence the cell cycle precisely because they exert control over cyclin-coupled CDK complexes. The high percentage values of S- phase cells may only indicate protein expression, not necessarily DNA. Just as we can have high percentages of cells in phases G1 and G2 but by defect of expression or in the verification itself, the cells do not divide, so they do not suffer mitosis.
Conclusions
In this study, we conclude:
Different cell cycle phases were identified in the embryos of captive Bothrops snakes. In Gate-1, the cells were mostly in division (Mitosis) than Gate-2. In both gates, the cells are in phase S, synthesizing proteins and DNA to divide.
The atretic eggs showed different stages of development, differentiation and maturation, that cells were involved in the organogenesis of these snake species.
The hypothesis: "Is atretic egg fertilized?" In this study was confirmed by the identification of germinal disks in different stages of organogenesis, which expressed different stages of growth kinetics and cell differentiation.
Oxidative stress can modulate cell development in cell division leading to cell fragmentation and death.
References
- Alberts B, Bray D, Hopkin K. Et Al. Fundamentos De Biologia Celular. Porto Alegre: Artmed 2011: 843.
- Benedetti A, Jezequel AM, Orlandi F. A Quantitative Evaluation Of Apoptotic Bodies In Rat Liver. Liver 8 (1988): 172–177.
- Bonnet, X., Akoka, S., Shine, R., Pourcelot, L. Disappearance Of Eggs During Gestation In A Viviparous Snake (Vipera Aspis) Detected Using Non- Invasive Techniques. Acta Herpetol 3 (2008): 129–137.
- Choi CQ. Cell Death Processes Are Reversible. The Scientist February 9, 2019.
- Collins K, Jacks T, Pavletich Np. The Cell Cycle And Cancer. Proc Natl Acad Sci 94 (1997) :2776–2778.
- Duellman WE, Trueb L. Biology Of Amphibians. John Hopkins University Press, Baltimore. 1986.
- Galluzzi L, Vitale I, Aaronson S. Et Al. Molecular Mechanisms Of Cell Death: Recommendations Of The Nomenclature Committee On Cell Death 2018. Cell Death Differ 25 (2018): 486–541.
- Godfray HCJ, Partridge L, Harvey PH. Clutch Size. Ann Rev Ecol 22 (1991): 409-429.
- Guraya SS. Follicular Atresia. Proceedings Of The Golden Jubilee Symposium On Perspectives In Reproductive Physiology Of The Female, Proc. Indian Natl. Sci. Acad., Delhi University 3 (1973): 311-332.
- Hengartner M. The Biochemistry Of Apoptosis. Nature 407 (2000): 770-776.
- Hirata H, Hinoda Y, Nakajima K. Et Al. Wnt Antagonist Dkk1 Acts As A Tumor Suppressor Gene That Induces Apoptosis And Inhibits Proliferation In Human Renal Cell Carcinoma. International Journal Of Cancer 128 (2011): 1793-1803.
- Hughes FM, Gorospe WC. Biochemical Identification Of Apoptosis (Programmed Cell Death) In Granulosa Cells: Evidence For A Potential Mechanism Underlying Follicular Atresia. Endocrinology 129 (1999): 2415–2422.
- Hussein, M.R. Apoptosis In The Ovary: Molecular Mechanisms. Hum Reprod Update 11 (2005): 162–177.
- Jiang JY, Cheung CK, Wang Y & Tsang BK. Regulation Of Cell Death And Cell Survival Gene Expression During Ovarian Follicular Development And Atresia. Front Biosci 8 (2003): 222-237.
- Jones RE. Control Of Follicular Selection. In: The Vertebrate Ovary: Comparative Biology And Evolution, P. 827-840. Jones, R.E., Ed, Plenum Press, New York. 1978.
- Kaipa A. Hsueh AJW. Regulation Of Ovarian Follicular Atresia. Annu Rev Physiol 59 (1997): 349-363.
- Kyrylkova, K., Kyryachenko, S., Leid, M., Kioussi, C. Detection Of Apoptosis By Tunel Assay. In: Kioussi C. (Eds) Odontogenesis. Methods In Molecular Biology (Methods And Protocols), Humana Press. 887 (2012): 41-47.
- Lack D. The Significance Of Clutch Size. Ibis 89 (1947): 309-352.
- Lack D. The Natural Regulation Of Animal Numbers. Clarendon, Oxford. 1954.
- Morgan DO. Principles Of Cdk Regulation. Nature 374 (1995): 131–134.
- Morgan DO. Principles Of Cdk Regulation. Nature (London) 374 (1995): 131–134.
- Schaffer KA. The Cell Cycle: A Review Vet Pathol 35 (1998): 461-478.
- Collins K, Jacks T, Pavletich The Cell Cycle And Cancer. Pnas 94 (1997): 2776-2778.
- Nasa I, Kettenbach AN. Coordination Of Protein Kinase And Phosphoprotein Phosphatase Activities In Mitosis. Front Cell Dev Biol 6 (2018): 30.
- Nurse P. A Long Twentieth Century Of The Cell Cycle And Beyond. Cell 100 (2000): 71-78.
- Saraste A, Polkki K. Morphologic And Biochemical Hallmarks Of Apoptosis. Cardiovascular Research 45 (2000): 528–537.
- Schaffer KA. The Cell Cycle: A Review Vet Pathol 35 (1998): 461-478.
- Tilly JL, Kowalski KI, Johnson AL, Hsueh AJ. Involvement Of Apoptosis In Ovarian Follicular Atresia And Postovulatory Regression. Endocrinology. 129 (1991): 2799-801.
- Xiao L, Tsutsui T. Cell Death And Cavitation: The Beginning Of Organogenesis. J Tissue Sci Eng 4 (2013) :E122.


 Impact Factor: * 3.0
 Acceptance Rate: 76.32%
  Time to first decision: 10.4 days
  Time from article received to acceptance: 2-3 weeks
