Crop Raiding Pattern by Elephant in Nepal: A Case Study of Khata Corridor
PAHARI Sagar1,3*, PAUDEL Umesh2, K.C. Rabin Bahadur2
1Southern Cross University, Military Rd, East Lismore NSW 2480, Australia
2 National Trust for Nature Conservation, Bardiya Conservation Program, Bardiya, Nepal
3 VicForests, Noojee, Victoria, Australia
*Corresponding Author: PAHARI Sagar, Southern Cross University, Military Rd, East Lismore NSW 2480, Australia.
Received: 28 November 2023; Accepted: 07 December 2023; Published: 13 December 2023
Article Information
Citation: PAHARI Sagar, PAUDEL Umesh, K.C. Rabin Bahadur. Crop Raiding Pattern by Elephant in Nepal: A Case Study of Khata Corridor. International Journal of Plant, Animal and Environmental Sciences. 13 (2023): 126-142.
View / Download Pdf Share at FacebookAbstract
Human - Elephant Conflict (HEC) causes the socio-economic distress in the settlement around Bardiya National Park (BNP). The transboundary migration of Asian elephant from Katarniyaghat Wildlife Sanctuary (KWS) in India to BNP and vice versa through Khata corridor exposes the vulnerable settlement in the corridor to frequent elephant encounters. The distance to conflict sites from features such as the forest frontage, the river edge, and the boundary of protected areas influences the severity of the crop damage. Municipalities within Khata corridor i.e., Thakurbaba and Madhuban were the study area that were further divided into three sample clusters i.e., MB, MBBZ and TBBZ. Hundred sample households (HHs) were surveyed and the annual stored crop damage and the crop damage on the agricultural field were quantified. ArcGis and R – studio were used to map and analyse the raid pattern. The result showed that small to medium landholding was possessed by most samples HHs and paddy was the most grown crop. Paddy was also the most depredated crop. The most severe crop damage in the agricultural field was sustained by MB cluster whereas the most severe stored crop damage was experienced by MBBZ cluster. A moderately strong correlation between the crop damage and the distance to BNP, the distance to KWS, and the number of elephants in a raiding herd was identified. The crop raid from larger herds was suffered by settlements closer to KWS. However, more study on the question raised regarding the elephant behaviour on transboundary movement through Khata corridor is required.
Keywords
<p>Bardiya; Katarniyaghat; Crop damage; Elephant movement; HEC</p>
Article Details
1. Introduction
The history of people’s reliance on forest is as long as the human history itself. A higher reliance on the forest for a direct livelihood support such as collecting fodder, firewood and other NTFP [1] and the intrusion into the wildlife habitat is found to be higher among landless and underprivileged people [2,3]. The intensive dependence on the forest, the impact of climatic change, and the wildlife movement around their settlement pose threat to their vulnerable livelihood and ignites the Human – Wildlife Conflict [4]. In the region around Fashiakhali Forest Reserve in Bangladesh, more than 45% of the elephant habitat was changed to other land cover (agricultural land or grassland) [5]. Such change in the land cover due to the human exploitation of the land resource in the proximity of the forest for residential and agricultural purposes invites frequent elephant interactions [5,6] either in the settlement or in the agricultural field [7]. Such ‘Human – Elephant Conflict’ leading interactions are therefore higher in the villages that are either enclaved or are peripheral to the forest [1].
Studies show that the elephant migration is dependent on the availability of different feeding vegetation and the water on different season around a year [8,9]. The elephant uses a defined traditional route for their migration, however, the movement of the elephant can vary depending on the variability in the home range [10,11]. For instance, the locomotion speed outside the protected area is significantly higher than within the protected area [10]. A study in Waza National Park shows that depending on the extent of change in habitat features, the elephant’s movement varies not only on the speed but also on the distance covered from the edge of the protected area or the forest frontage. The distance can limit up to 31 km or can extend up to 100 km from the edge [12].
In the ecological diagram, the habitat extends beyond the boundary of the protected area. The residential and agricultural exploitation of the land around the protected area fragments the natural habitat and migratory route [5]. The possibility of the conflict is therefore significantly higher in the exploited habitat that has suffered fragmentation [13]. HEC mitigating measures such as an electric fence not only stops elephants from getting into the settlement [14,15] and but also deviates the elephant from their traditional migratory routes. The veterinary fences also had similar effect on the elephant’s movement along the corridor in north east Botswana [16]. Such disruptions on the elephant movement causes habitat fragmentation [2], restricts the elephant to a limited space, and eventually shifts the aggregated and aggravated conflict elsewhere [17].
There are several factors (determinant variables) that influence the occurrence of the HEC [18]. The distance to the road is the most significant determinant variable that influences the potentiality of the occurrence and increases the intensity of the conflict [13]. The distance to the protected area boundary from the settlement is another important determinant variable that influences HEC [17]. The practice of growing crops close to the National Park boundary makes it easier and comparatively safer for the elephant to come outside the protected area and raid crops, therefore, in Gorongosa National Park, crop raid is the highest in the agricultural field close to the park boundary [19]. Settlements closer to the Chitwan National Park and Parsa National Park boundary in Central Nepal also experience significantly more elephant interactions [20]. In Jhapa, settlements in proximity to the forest frontage suffer greater extent of the crop and the property damage than the settlement farther from the forest frontage, making distance to forest frontage another significant determinant variable of HEC [14,15]. In addition to the distance to spatial features, environmental variables such as area of the permanent and the seasonal water, the area of the open forest, the mean annual rainfall and the altitude are also significant predictors of the HEC [17,21].
Oryza sativa (Paddy) is the most common crop to be mutilated by Elephas maximus (Asian Elephant) [3,22-24]. In addition, the Asian Elephant has shown preference on Zea mays (Maize), Triticum spp. (Wheat), and Saccharum officinarum (Sugarcane) [25]. Many studies have concluded that the season where paddy is ripen and is ready to harvest, generally between October and January, is the season when Human – Elephant Conflict (HEC) peaks [18,22-24,26].
Asian Elephant is one of the most involved wildlife in frequent and severe attacks in Nepal [27]. The elephant conservation is therefore a complicated conservation effort because of the impact of Human – Elephant interaction in the elephant habitat, the settlement, and the elephant migratory route [28]. The trend of the HEC is noted to be increasing in the Western Terai region of Nepal [29]. Bardiya, situated in Western Terai, is identified as one of the four prominent Asian Elephant habitat in Nepal – India transboundary region (with more than >100 elephants concentrated in Bardiya) [21,30]. Bardiya is also one of the most productive districts with the average paddy yield of 5.76 ton per ha per harvest in the spring of 2019/20 and the average aggregated crop yield (paddy, maize and wheat) of 4.15 ton per ha [31]. Bardiya, that suffers the highest extent of the crop damage due to the HEC and experiences the second highest occurrence of HEC events in total from 2001 – 2020, is therefore, one of the most significant HEC hotspots in Nepal [21]. The environmental, climatic, socio-economic, biological, and spatial features of the conflict site can trigger the HEC and govern the damage. The main objective of the study is to identify the statistical relationship between the severity of the crop damage and spatial features in and around Khata corridor.
Therefore, herein this paper we aim to assess the patterns of crop raiding by the elephant in Khata corridor in the settlements around Bardiya National Park in Nepal.
2. Methodology
Study Area:
Bardiya National Park (BNP), a home to a diverse ecosystem, covers the largest area of 968 sq. km among National Parks in Terai region (lowland of South) of Nepal [32]. BNP is known for its wide range of habitat types that are home for various endangered species. Broad leaved mixed forest of Sal (Shorea robusta) is the prime vegetation composition of Bardiya National Park. BNP also portrays a diverse ecosystem through the open grassland and savannah, a suitable habitat for megafauna such as Royal Bengal Tiger (Panthera tigris tigris) and one-horned Rhino (Rhinoceros unicornis). In addition to these, a riverine forest and floodplain on the bank of Babai and Karnali river provide a habitat for gharial (Gavialis gangeticus), crocodile (Crocodylus palustris), Gangetic dolphin (Platanista gangetica) and various fish species [32,33]. Bardiya National Park along with Banke National Park forms a habitat complex for around 113 Asian Elephants (Elephas maximus) which is the largest population within a habitat complex in Nepal [34]. BNP is connected to Katarniaghat Wildlife Sanctuary (KWS) in India by Bardiya-Katarniaghat Corridor, also called Khata corridor. Similar to BNP, Khata corridor gives diverse habitat types of Sal forest, Riverine forest and Tallgrass floodplains to species including Tiger (Panthera tigris), Rhino (Rhinoceros unicornis, Spotted deer (Axis axis), Hog deer (Axis porcinus), Barking deer (Muntiacus muntjac), Wild boar (Sus scrofa), and Nilgai (Boselaphus tragocamelus) [35,36]. Khata corridor also has high avifaunal species richness and is a home to 141 different bird species including the most endangered (Appendix 1) Great Hornbill (Buceros bicornis) [37]. It facilitates the transboundary movement and the seasonal migration of species such as Royal Bengal Tiger and Asian Elephant in between BNP and KWS and hence plays an integral role in habitat connectivity [38].
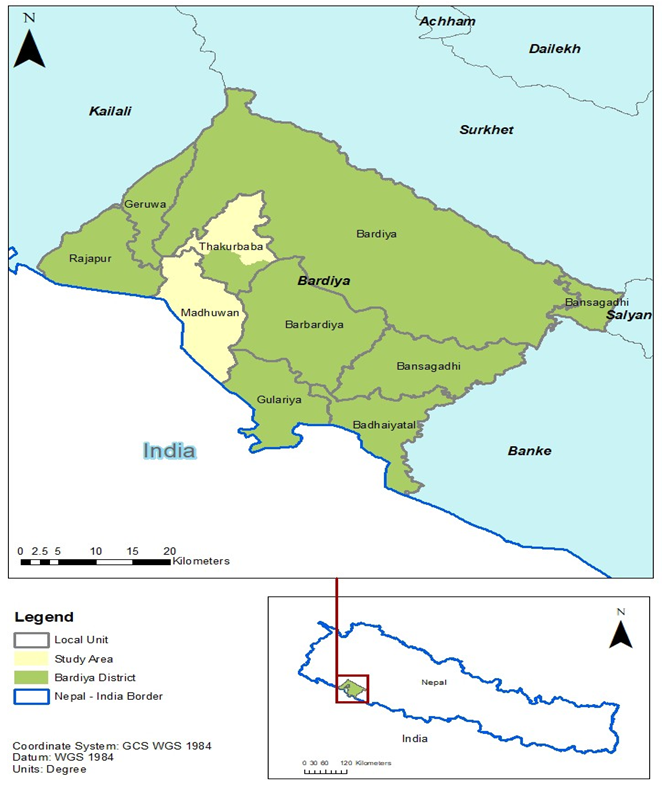
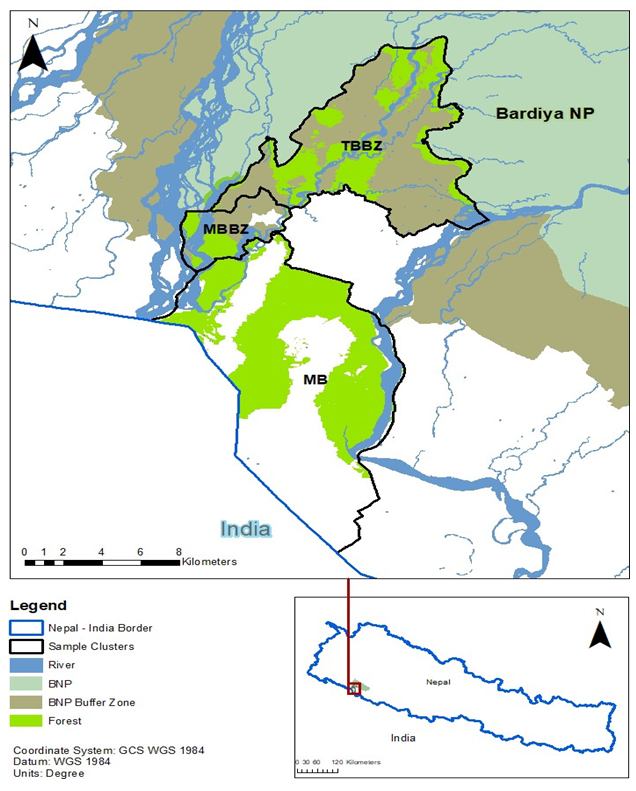
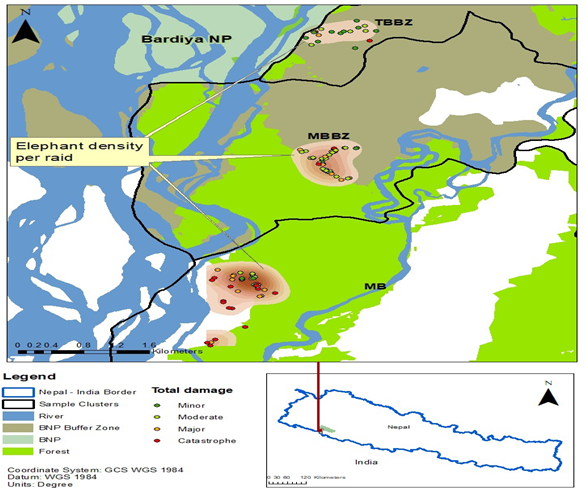
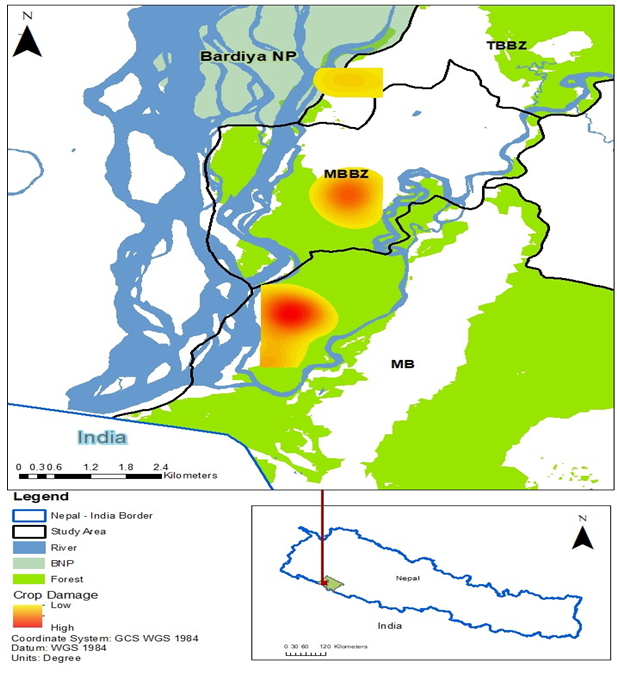
Bardiya district has 9 local administrative divisions as shown in Figure 1. Two municipalities, Thakurbaba and Madhuban municipalities within the Khata corridor, were selected as our study area and their distinctive spatial features were identified. The study area was further divided into three sample clusters depending on their location with respect to BNP and its buffer zone as shown in Figure 2. The sample clusters were Madhuban outside buffer zone (MB), Madhuban inside buffer zone (MBBZ) and Thakurbaba inside buffer zone (TBBZ). MB cluster is comparatively less densely populated and farther from town service compared to MBBZ and TBBZ clusters. The MB cluster shares border with KWS in India whereas TBBZ shares border with BNP. The MBBZ cluster lies in between them.
Data collection:
Damage data
All the damage data were collected through the household survey. Hundred sample households (HH) were randomly selected using ‘Simple Random Sampling’. Out of 100 samples HHs selected, 58 HHs were inside the buffer zone and 42 HHs were outside the buffer zone. They were interviewed following a structured pattern of the questionnaire. The information recorded from sample HHs through the questionnaire survey included but not limited to the area of landholding, the type and quantity of annual production of crops, the type and quantity of the annual damage of crops, and the number of elephants in raiding herds. Methods used to survey sample HHs included the face-to-face interview, the email, and the phone interview. The consent of respondents was taken through a consent letter and a consent form before the survey.
Spatial data
The spatial data collected for the study included layers and shapefiles of features such as Nepal waterways, land use land cover, local administrative division, National Park, and satellite imagery. The spatial data were downloaded from websites listed in Table 1. The coordinate location of conflict sites was collected during the damage data collection.
Situational information:
The situational information regarding the extent of damage and the recent history of the elephant encounter were collected through ‘key informant’s survey’. The key informants i.e., conservation officials from BNP and National Trust for Nature Conservation – Bardiya Conservation Program, local experts, senior citizens, and tourist guides were surveyed. The data collected from key informants were subjective data. The data were also used to validate the pattern and extent of damage identified during the damage data collection.
Data analysis:
ArcMap 10.7.1 was used to clean, reclassify, analyse, and produce spatial information of conflict determinants and conflict sites from the spatial layers. Proximity tools were used to derive the distance to features (river edge, forest frontage, road to forest, boundary of protected area (BNP) and international border) from conflict sites. R studio 2023.03.0 was used to identify the statistical relationship between the determinant variables and severity of damage [39]. The packages used in R included ‘dplyr’, ‘devtools’, and ‘ggpubr’. Functions used for analysis in R studio were Welch Two Sample t-test, one way ANOVA, Tukey’s ‘honest significance difference’, and Pearson’s product – moment correlation [40,41].
|
Features |
Source |
URL |
|
Minute river and streamline |
HDX |
https:/data.humdata.org/dataset/nepal-watercourses-rivers/resource/c49ef799-201f-45a0-a8ee-f9c35bdafa01 |
|
Waterways |
OpenStreetMaps |
https:/mapcruzin.com/nepal-shapefiles/waterways.zip |
|
Water Extent and flooding |
unosat |
https:/unosat.org/static/unosat_filesystem/3447/FL20221117NPL_SHP.zip |
|
Landuse |
OpenStreetMaps |
https:/mapcruzin.com/nepal-shapefiles/landuse.zip |
|
Land cover 2019 |
ICIMOD |
https:/download.hermes.com.np/land-cover-map-nepal-2019/?wpdmdl=1729&refresh=641f40e2252551679769826 |
|
Land cover 2010 |
ICIMOD |
https:/download.hermes.com.np/land-cover-map-of-nepal-2010/?wpdmdl=1575&refresh=641f407107ab91679769713 |
|
Local units |
Open Data Nepal |
https:/opendatanepal.com/dataset/new-political-and-administrative-boundaries-shapefile-of-nepal |
|
Bardiya NP |
NTNC |
http:/geoportal.ntnc.org.np/layers/ntnc:Bardiya_National_Park/#/ |
|
Base map imagery |
ESRI |
ArcMap (ESRI World Imagery) |
Table 1: Source of spatial data.
3. Results
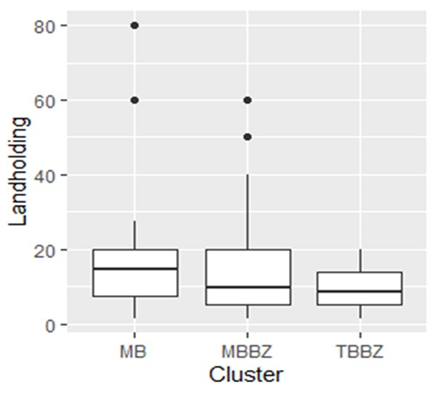
The average landholding of sample HH was 14.12 kattha (SD = 13.28, 79.09 kattha = 1 ha). The sample HH in MB, MBBZ and TBBZ had an average landholding of 16.18 kattha, 14.55 kattha and 9.36 kattha respectively. The differences of average landholding of the sample HH between 3 clusters, as shown in Figure 3, was not significant (p= 0.19). The average landholding of sample HH within buffer zone and outside buffer zone, 12.94 kattha and 16.18 kattha respectively, were also not significantly different (p= 0.24).
|
Cluster |
MB |
MBBZ |
TBBZ |
Significance |
|
ANOVA |
df |
F - value |
P - value |
|
|
Average Landholding (kattha) |
16.179 |
14.55 |
9.361 |
1 ha = 79.0882 kattha |
|
ANOVA |
2.000 |
1.696 |
0.189 |
|
|
TukeyHSD |
ns |
ns |
ns |
|
|
Average annual production per HH (kg) |
897.911 |
1011.001 |
531.059 |
|
|
ANOVA |
2.000 |
1.575 |
0.212 |
|
|
TukeyHSD |
ns |
ns |
ns |
|
|
Average annual crop damage on field per HH (kg) |
325.144 |
22.973 |
93.069 |
|
|
ANOVA |
2.000 |
19.500 |
7.60E-08 |
* |
|
TukeyHSD |
MBBZ, TBBZ |
MB |
MB |
|
|
Average annual stored crop damage per HH (kg) |
80.934 |
165.789 |
38.235 |
|
|
ANOVA |
2.000 |
4.765 |
0.011 |
* |
|
TukeyHSD |
ns |
TBBZ |
MBBZ |
|
|
Total annual crop damage per HH (kg) |
404.151 |
188.763 |
129.181 |
|
|
ANOVA |
2.000 |
9.292 |
0.000 |
* |
|
TukeyHSD |
MBBZ, TBBZ |
MB |
MB |
|
|
Average annual crop damage on field (ton per ha) |
1.590 |
0.120 |
0.79 |
|
|
ANOVA |
2.000 |
37.150 |
1.05E-12 |
* |
|
TukeyHSD |
ALL |
ALL |
ALL |
|
|
Percentage total crop damage of total production (%) |
45.010 |
18.671 |
24.325 |
|
|
ANOVA |
2.000 |
5.534 |
0.005 |
* |
|
TukeyHSD |
MBBZ, TBBZ |
MB |
MB |
|
|
Percentage crop damage on field of total damage (%) |
80.451 |
12.170 |
72.046 |
|
|
ANOVA |
2.000 |
55.900 |
2.00E-16 |
* |
|
TukeyHSD |
ALL |
ALL |
ALL |
|
|
Average nearest distance to river edge (m) |
494.044 |
657.478 |
443.965 |
|
|
ANOVA |
2.000 |
15.150 |
1.88E-06 |
* |
|
TukeyHSD |
MBBZ |
MB, TBBZ |
MBBZ |
|
|
Average nearest distance to forest front (m) |
145.190 |
196.233 |
505.180 |
|
|
ANOVA |
2.000 |
37.610 |
8.11E-13 |
* |
|
TukeyHSD |
TBBZ |
TBBZ |
MB, MBBZ |
|
|
Average nearest distance to BNP boundary (m) |
4437.000 |
1914.345 |
293.190 |
|
|
ANOVA |
2.000 |
1128.000 |
2.00E-16 |
* |
|
TukeyHSD |
ALL |
ALL |
ALL |
|
|
Average nearest distance to India Border (m) |
2814.890 |
5736.360 |
8379.900 |
|
|
ANOVA |
2.000 |
1824.000 |
2.00E-16 |
* |
|
TukeyHSD |
ALL |
ALL |
ALL |
|
|
Average number of elephant in raiding herd |
4.000 |
2.000 |
2.000 |
|
|
ANOVA |
2.000 |
74.280 |
2.00E-16 |
* |
|
TukeyHSD |
TBBZ, MBBZ |
MB |
MB |
* − statistically significant
Table 2: ANOVA Table and comparison of mean among 3 clusters.
|
df |
t - value |
p - value |
significance |
|
|
Average Landholding (Katha) |
82.554 |
-1.186 |
0.239 |
|
|
Average annual production per HH (kg) |
80.938 |
-1.203 |
0.233 |
|
|
Average annual crop damage on field per HH (kg) |
49.249 |
-5.430 |
1.72E-06 |
* |
|
Average annual stored crop damage per HH (kg) |
94.463 |
1.423 |
0.158 |
|
|
Total annual crop damage per HH (kg) |
60.337 |
-3.915 |
0.0002323 |
* |
|
Average annual crop damage on field (ton per ha) |
81.475 |
-7.802 |
1.78E-11 |
* |
|
Percentage total crop damage of total production (%) |
95.263 |
-3.369 |
0.00109 |
* |
|
Percentage crop damage on field of total damage (%) |
97.979 |
-9.036 |
1.50E-14 |
* |
|
Average nearest distance to river edge (m) |
89.108 |
7.355 |
8.93E-11 |
* |
|
Average nearest distance to forest front (m) |
88.588 |
4.295 |
4.46E-05 |
* |
|
Average nearest distance to BNP boundary (m) |
94.307 |
-24.234 |
2.20E-16 |
* |
|
Average nearest distance to India Border (m) |
77.665 |
20.838 |
2.20E-16 |
* |
|
*− statistically significant |
||||
Table 3: T – test table and comparison of mean between sample HHs inside and outside of BZ.
|
Attributes |
Statistics |
Average annual crop damage on field per HH |
Average annual stored crop damage per HH |
Average nearest distance to BNP boundary |
Average nearest distance to India Border |
|
Average number of elephant in raiding herd |
t - value |
7.3743 |
-1.25E + 00 |
10.985 |
-10.131 |
|
p |
5.35E-11 |
0.2131 |
2.20E-16 |
2.20E-16 |
|
|
df |
98 |
96 |
98 |
98 |
|
|
cor |
0.5973869 (c) |
-0.1269 |
0.7428666 (c) |
-0.71523 (c) |
|
|
Average nearest distance to BNP boundary |
t - value |
5.553 |
-0.29083 |
- |
- |
|
p |
2.41E-07 |
0.7718 |
- |
- |
|
|
df |
98 |
96 |
- |
- |
|
|
cor |
0.4892262 (c) |
-0.0296698 |
- |
- |
|
|
Average nearest distance to India Border |
t - value |
-5.032 |
-0.00579 |
- |
- |
|
p |
2.20E-06 |
0.9954 |
- |
- |
|
|
df |
98 |
96 |
- |
- |
|
|
cor |
-0.4531478 (c) |
-0.000590479 |
- |
- |
|
|
Average nearest distance to forest front |
t - value |
-1.1803 |
0.5142 |
- |
- |
|
p |
2.41E-01 |
0.6083 |
- |
- |
|
|
df |
98 |
96 |
- |
- |
|
|
cor |
-0.1184 |
0.05241 |
- |
- |
|
|
Average nearest distance to river edge |
t - value |
-1.9009 |
1.2318 |
- |
- |
|
p |
0.06025 |
0.211 |
- |
- |
|
|
df |
98 |
96 |
- |
- |
|
|
cor |
-0.1885789 |
0.1247423 |
- |
- |
|
|
(c) – significantly correlated |
|||||
Table 4: Correlation table between damage and determinant variables.
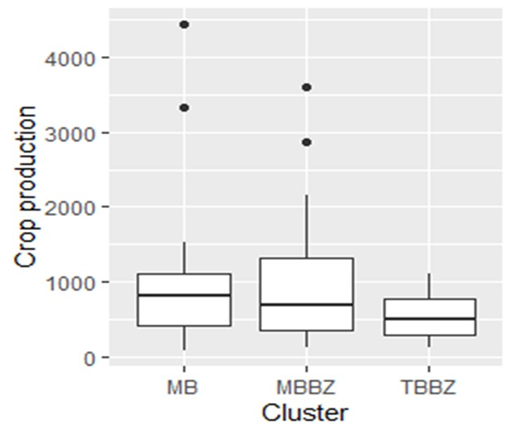
The annual crop production was calculated from the average of last three years’ crop harvest. The sum of the crop production gave a calculated aggregated crop yield of 4.85 ton per ha. The calculated aggregated crop yield within study area was significantly higher than the annual aggregated crop yield in Bardiya district in 2019/20 (4.15 ton per ha) [31]. The average annual crop production per HH in MB, MBBZ, and TBBZ clusters were 897.91 kg, 1011.00 kg, and 531.06 kg with an average annual yield of 4.39 ton/ha, 5.50 ton/ha and 4.49 ton/ha respectively. The average annual crop production per household within buffer zone was 862.052 kg and outside buffer zone was 897.91 kg with an average annual yield of 5.26 ton/ha and 4.39 ton/ha respectively. There was no significant difference in average annual yield per HH between HHs within three clusters (as shown in Figure 4). Likewise, difference in the average landholding and the average annual yield in HHs inside and outside the buffer zone also wasn’t significant.
The major crops were paddy, maize, wheat, potato, and vegetables and paddy was the major crop for 96% of sample HHs. Paddy also was the most depredated crop from the elephant raid. Thirty percent of sample HHs experienced the crop damage on the field only, more than one third of sample HHs experienced the stored crop damage only, 6% experienced no damage whereas, and more than a quarter experienced both types of damages.
In MB, MBBZ, and TBBZ clusters, the total annual crop damage was 45.01%, 18.67% and 24.33% of the average annual production per HH. The highest total annual crop damage of 404.15 kg per HH was suffered by HHs in MB cluster, followed by MBBZ (188.76 kg/HH), and TBBZ (129.18 kg/HH) clusters. Out of the total annual crop damage in MB cluster, 80.45% was on the field which was significantly higher than MBBZ (12.17%) and TBBZ (72.05%).
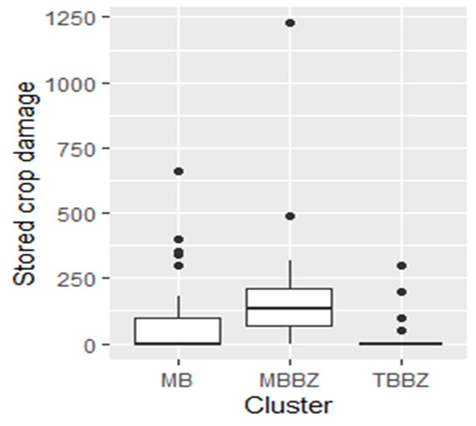
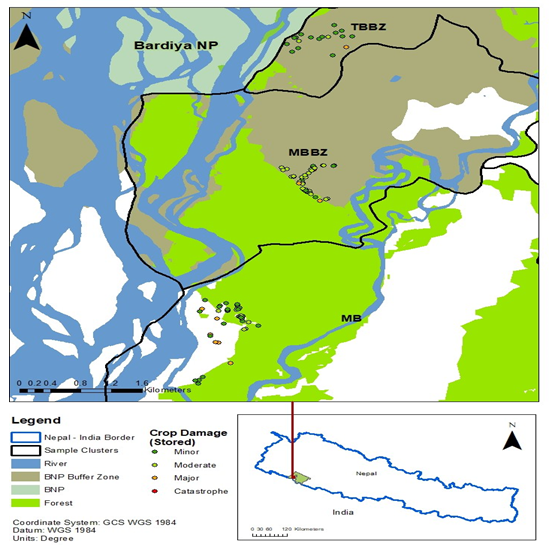
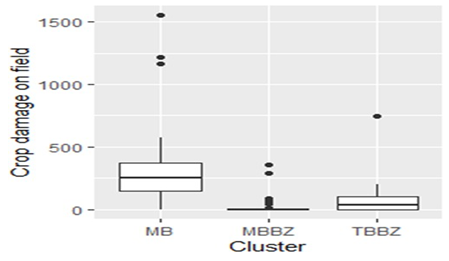
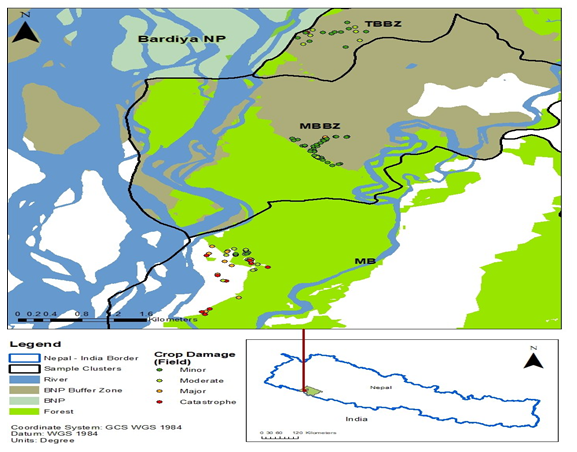
The highest stored crop damage, as shown in Figure 5, was suffered by HHs in MBBZ cluster (165.79 kg/HH) followed by MB (80.093kg/HH) and TBBZ (38.24 kg/HH) clusters (Figure 6). Similarly, the average annual crop damage on the field was highest in MB (325.14 kg/HH), as shown in Figure 7, followed by TBBZ (93.07 kg/HH), and MBBZ (22.97 kg/HH) clusters (Figure 8). The annual crop damage on the field in MB cluster was 1.59 ton/ha that was significantly higher than the stored crop damage (p < 0.05).
The differences observed in average crop damages between different clusters and locations with respect to buffer zones were statistically significant. HHs outside buffer zone suffered significantly higher crop damage on field (325.144 kg) than HHs inside buffer zone (p < 0.05). Even though the stored crop damage in MBBZ cluster was significantly higher than in TBBZ cluster, the difference in the stored crop damage between HHs inside buffer zone and outside buffer zone was not significant (p = 0.16).
The major spatial characteristics of sample clusters were defined by the location with respect to the buffer zone and the distance from spatial features i.e., the BNP boundary, the KWS boundary, the forest frontage, and the river edge. All the sample clusters were spatially located between the BNP boundary and the KWS boundary as shown in Figure 2. Conflict sites, agricultural fields or houses that were attacked by elephants, were either adjacent to or within 50 m from the respective sample HH. Conflict sites within the buffer zone were significantly closer to the BNP boundary with an average distance of 1411.20 m and significantly farther from the KWS boundary with an average distance of 6556.76m than conflict sites outside the buffer zone (4437.00m from the BNP boundary and 2814.89m from the KWS boundary). Conflict sites outside the buffer zone were significantly closer to the forest frontage (145.19m average nearest distance) and the river edge (494.48m average nearest distance) than those inside the buffer zone.
MB cluster:
Sample HHs and conflict sites were located in between Geruwa river and Ganesh Sisinuya Community Forest (CF). The average closest distance from the conflict site to the river edge of Geruwa river was 494.04m and to the forest frontage of Ganesh Sisinuya CF was 145.19m. The average closest distance from the conflict site to the KWS boundary (India) was 2814.89m and was the closest cluster to the KWS boundary (India), whereas it was 4437.00m to the BNP boundary.
MBBZ cluster:
Lying in between MB and TBBZ clusters and in the proximity of Durga CF, two prominent river systems; Geruwa river and Aurahi river flows from either side of the MBBZ cluster. The average closest distance from the conflict site to the river edge of Geruwa river was 1073.55m, to Aurahi river was 657.48m, and to the forest frontage of Durga CF was 196.23m. Likewise, the average closest distance from the conflict site to the KWS boundary (India) was 5736.36m and to the BNP boundary was 1914.35m.
TBBZ cluster:
Sample HHs and conflict sites in TBBZ cluster were the closest among three clusters to the river edge. The average closest distance from the conflict site to the river edge of Geruwa river was 443.97m and to the nearest forest frontage was 505.18m. Likewise, the average distance from the conflict site to the KWS boundary (India) was 8379.90m, whereas to the BNP boundary was 293.19m.
Conflict sites in TBBZ cluster were significantly farthest among 3 clusters from the forest frontage whereas conflict sites in MBBZ cluster were significantly the farthest among 3 from the river edge.
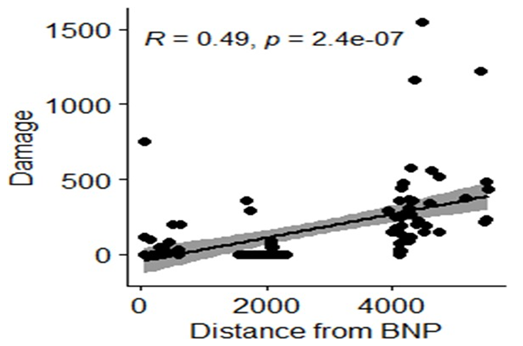
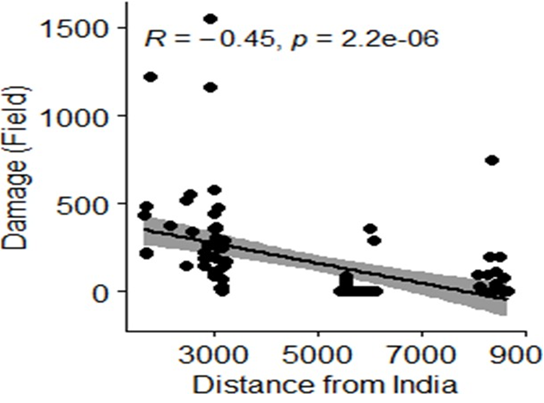
The contrasting effect was shown by the distance to the spatial features on the quantified damage suffered by the respective HH. The moderate positive correlation (p < 0.01, cor = 0.49) was shown by the distance to the BNP boundary (Figure 9) whereas, the moderate negative correlation (p < 0.01, cor = -0.45) was shown by the distance to the KWS boundary (India) with the field damage suffered by the respective HH (Figure 10).
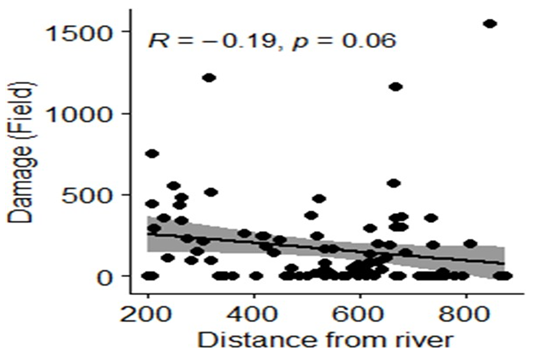
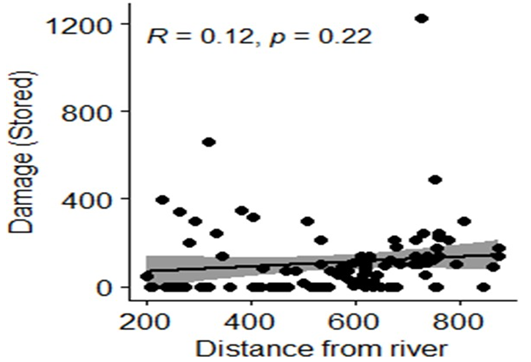
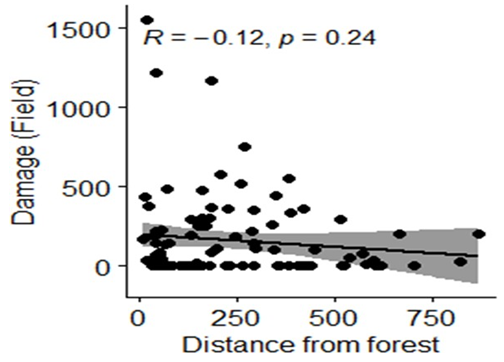
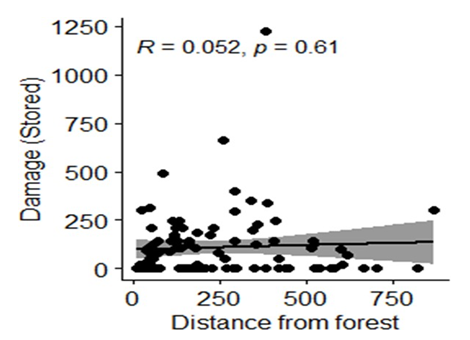
The negligible negative correlation was shown by the distance to the river edge with the crop damage on the field (Figure 11) and the negligible positive correlation with the stored crop damage (Figure 12). Similarly, negligible significant correlation was identified in between the distance to the forest frontage with both types of crop damages suffered by the respective HH as shown in Figure 13 and 14 (n = 100). However, within the MB cluster, the stored crop damage was moderately correlated to the distance to the forest frontage (cor = 0.40, n = 42).
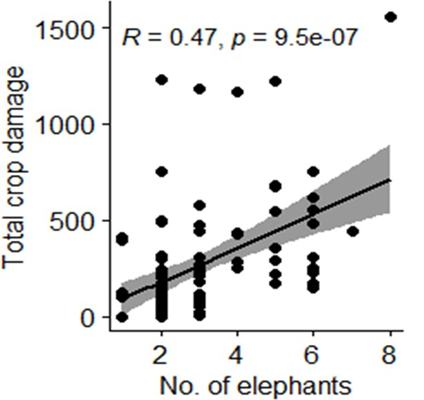
The number of elephants per raid ranged from 1 to 8 individuals (mean = 3, SD = 1.53). The number of elephants per raid significantly varied between clusters. MB cluster generally was raided by the herd of 3 to 8 elephants (average of 4 individuals) whereas the MBBZ and TBBZ clusters were raided by 1–3 elephants (average of 2 individuals). The average number of elephants per raid in MB cluster was significantly higher than the average number of elephants per raid in MBBZ and TBBZ clusters. The number of elephants per raid was significantly correlated to the distance to the BNP boundary and to the KWS boundary (India). A strong positive correlation in between the number of elephants per raid with the distance to the BNP boundary (p < 0.001, cor = 0.74) was seen. Contrastingly, a strong negative correlation with the distance to the KWS boundary (India) (p < 0.01, cor = -0.72) was seen. The total annual crop damage was positively correlated to the number of elephants per raid (p < 0.01, cor = 0.47) (Figure 15). The number of elephants per raid and the total annual crop damage was on a decreasing trend along the Khata Corridor from the Nepal – India border towards the BNP boundary as shown in Figure 16.
A moderately strong correlation was noted in between the number of elephants per raid and the severity of damage on the field. However, no significant correlation was exhibited by the number of elephants per raid with the severity of stored crop damage.
4. Discussion
Bardiya was identified as one of the four major sites in the Chure Terai Madesh Landscape (CTML) for experiencing high incidences of HEC [21]. Our study shows that annually every household loses 18– 45% of their total crop production on an average to elephant raids. Koirala et al. [6] has also concluded that each household around Bardiya National Park loses at least 25% of their total income from agricultural yield every year to the elephant raid. The crop damage is more detrimental from the socio-economic perspective because most HHs depend on subsistence farming for their livelihoods. Prins et al. [42] also found that more than 80% of farmers around BNP couldn’t produce surplus yield to trade in the market. Losing around one third of production each year has massive cumulative economic impact on families with medium sized landholding. Neupane et al. [43] also had similar conclusion on the economic burden faced by rural farmers in the elephant affected households.
Previous studies have proved the positive influence of the proximity of water source to the elephant encounter [42,44,45]. The migratory route of travelling elephant is also in a proximity of permanent water source [46]. Therefore, the distance to the river edge was used as one of the determinant variables to test the variable – damage relationship. However, the distance to the river edge (< 900m from all conflict sites) didn’t show any significant variable – damage correlation. We also couldn’t determine that there isn’t any variable – damage correlation because there are various factors that affect the correlation. For instance, the elephant behaviour on preference towards the proximity of water source could vary between dry and wet season [47]. Therefore, the range of data i.e., temporal (only wet season) and spatial distance (range = 677.63m) wasn’t statistically comprehensive to authenticate the correlation.
We used distance to forest frontage as another determinant variable to test the variable – damage relationship. The severity of the crop damage in the agricultural field tends to decrease marginally as we move away from the forest frontage which is rather parallel to the result from HEC study in Chure Terai Madhesh Landscape [22]. Gubbi [18] and Chakraborty and Mondal [48] also noticed that the distance to forest is one of the driving factors of HEC. When elephant enter the agricultural field from the forest, they raid the closest field and move further in towards the inner agricultural field and settlement [42]. However, our result is not statistically significant to conclude the variable – distance correlation and requires an extensive study.
MB cluster (sampled conflict site) is segregated from the larger settlement by the circumjacent river and forest that consequently increases the perimeter of direct exposure of MB cluster to HEC influencing features. In contrast, the perimeter of MBBZ and TBBZ clusters directly exposed to influencing features are comparatively small. The greater exposure to the HEC influencing features and the resulting susceptibility of elephant raid and the extensive crop damage in MB cluster is parallel to the HEC conflict result in Nagarahole National Park which concluded that the settlement exposed to longer protected area frontage receives frequent elephant visit [18]. This result also supports the observation of study in southern India where effective perimeter length of village is primary determinant of area of conflict [49].
Settlements in Khata corridor are sandwiched in between two protected areas i.e., BNP and KWS. The distance to two PAs, another determinant variable, has inconsistent relationship to the severity of the crop damage. The severity of the crop damage decreases as we move away from the KWS boundary, as shown in Figure 17. The HEC studies in CTML have similar conclusion that the potential occurrence of conflict decreases with increasing distance from the protected area [22,42]. Contrastingly, the severity of the crop damage increases as we move away from the BNP boundary which is conflicting with previous studies. Khata corridor is a traditional migration route for elephants, therefore, settlements between the PAs in the Khata corridor always possess high HEC potential as elephants tend to follow same route to migrate and even to feed on agricultural crops every year [17,38,50-52]. Furthermore, Chakraborty and Mondal [48] noted that elephants often use same migratory route to get it and to leave a habitat during their seasonal migration. It supplements the explanation of the concentrated severity of the crop damage in MB cluster.
When elephants enter Nepal and move towards BNP, MB cluster, being the closest settlement from KWS, receives the initial descent of migrating elephants. MBBZ cluster is three kilometres away from the MB cluster, so the agricultural field of MB cluster triggers an early warning and acts as a temporary buffer for the agricultural field of MBBZ and TBBZ clusters from the raid of same migrating herd. Early warnings and phone communications were effectively used to initiate the early response and was significant in mitigation of crop depredation by elephants in Kenya that justifies the lesser severity of crop damage in MBBZ and TBBZ cluster [2,53].
There are studies that show the elephant herd tends to avoid higher density settlement during their migration to avoid anthropogenic risks more than a solitary elephant. They sit parallel to the finding of our study where MB cluster with comparatively lower settlement density have significantly higher number of elephants per raid [8,10,52,54]. The locomotive behaviour study in Rajaji National Park identified that the speed of elephant is slow when they are feeding and when they are in a herd. In addition, a herd tends to cover shorter distances in comparison to the individual elephant [8]. The movement of larger herd through the agricultural field of MB cluster, hence, explains the higher severity of the crop damage in MB cluster. The higher severity of damage, the higher number of elephants per raid, and the proximity of MB cluster to the KWS boundary suggests that the crop damage suffered by MB cluster is from migrating elephants and that suffered by MBBZ and TBBZ clusters are from resident elephants. However, because of the lack of the sufficient evidence data and supporting literatures, a robust conclusion couldn’t be drawn.
5. Conclusion
The crop damage caused by raiding elephants is the result of the spatial location of the agricultural field or the human settlement with respect to conflict determinant variables. The distance to the protected area (KWS) is the strongest determinant variable of Human – Elephant Conflict in Khata corridor. The anomalous effect of distance to BNP boundary on the severity of the crop damage could be because of the varying effect of tourism, habitat management actions, and conflict management interventions on different settlements. For instance, Thakurbaba municipality, being close to the Army and the National Park Headquarter, are better prepared to cope with the elephant encounter whereas, Madhuban municipality (especially MB cluster) being a small, isolated settlement far from Thakurbaba and close to Katarniyaghat Wildlife Sanctuary suffers severe raiding. People from settlements far from Thakurbaba feel the lack of Park’s presence, especially during the elephant encounter, and hence are exposed to more risk of a severe damage every year.
Recommendation:
The research has tried to answer questions about determinant variables of the Human – Elephant Conflict in Khata Corridor. However, it has raised more questions such as the effect of distance to the forest frontage and the river edge on HEC, a quantification of the influence of Park and tourism in conflict management, and a quantification of people’s awareness and Park – People relationship in HEC management. There is also a gap in information on the influence of varied elephant behaviour, feeding habit and movement pattern within PAs and in between PAs. The research has limitations such as the range of data, the number of determinant variables, and the unbiased quantification of crop production and damage. A further study with improvements in limitations as far as practicable is highly recommended.
Declarations:
Acknowledgement:
I’m extremely lucky to have my supervisor in Ross Goldingay. His indispensable supervision and support during the entire time of my research were invaluable. I cannot put my indebtedness into words for my field assistants; Gobinda Tharu, Bir Bahadur Chaudhary, Manju Mahatara and Ramesh Dhakal who conducted household survey during the COVID outbreak with utmost caution and safety. This endeavour would not have been possible without the constructive feedback and GIS support from Manish Maharjan. I would like to show my sincere appreciation to my friends and colleagues; Dipesh Basnet, Janak Raj Poudel, and Kim Honan for their insightful comments, software and computing help, and moral support.
I hereby declare that this is an original report of my research. It has been composed by me with the joint effort of the mentioned co-authors and that the work has not been published and is not under consideration for any other publications. I confirm that the work submitted is my own. My contribution and those of the co-authors to this work have been acknowledged. I confirm that appropriate credit has been given within this report where reference has been made to the work of others.
Funding:
I also confirm that there have been no any financial or non – financial interests that are directly or indirectly related to the research.
Competing Interest:
I declare that there is no competing or conflicting interest associated with this research.
Author contributions:
S.P is the main author of the report. S.P designed the research methodology, analysed the data, prepared the map and figures, and wrote the report. U.P conducted the survey and arranged the collected data. S.P and U.P conducted the spatial analysis in GIS. S.P wrote the main manuscript text. RBK assisted in proofreading and reviewing the manuscript. All authors reviewed the manuscript before finalizing for submission.
Data Availability:
The spatial data were derived from sources that are openly available in the public domain. Details of sources and URLs are mentioned within the manuscript (Table 1). The data from the questionnaire survey that are collected during the household survey of this study are available from the corresponding author, [S.P.], upon reasonable request.
Consent to participate:
Before recording the information of a respondent, an informed consent was obtained during the questionnaire survey. The respondent is kept anonymous and none of the personal information is used for the research purpose.
References
- Nad C, Roy R, Roy TB. Human Elephant Conflict in Changing Land-Use Land-Cover Scenario in and Adjoining Region of Buxa Tiger Reserve, India. Environmental Challenges 7 (2022): 100384.
- Shaffer LJ, Khadka KK, Van Den Hoek J, et al. Human-Elephant Conflict: A Review of Current Management Strategies and Future Directions. Frontiers in Ecology and Evolution 6 (2019): 235.
- Thant ZM, May R, Røskaft E. Pattern and Distribution of Human-Elephant Conflicts in Three Conflict-Prone Landscapes in Myanmar. Global Ecology and Conservation 25 (2021): e01411.
- Mosimane AW, McCool S, Brown P, et al. Using Mental Models in the Analysis of Human–Wildlife Conflict from the Perspective of a Social–Ecological System in Namibia. Oryx 48 (2014): 64-70.
- Billah MM, Rahman MM, Abedin J, et al. Land Cover Change and Its Impact on Human–Elephant Conflict: A Case from Fashiakhali Forest Reserve in Bangladesh. SN Applied Sciences 3 (2021): 649.
- Koirala R, Ji W, Aryal A, et al. Dispersal and Ranging Patterns of the Asian Elephant (Elephas Maximus) in Relation to Their Interactions with Humans in Nepal. Ethology Ecology and Evolution 28 (2016): 221-231.
- Joshi G, Neupane B, Dahal D, et al. Assessment of Human-Wildlife Conflict in Kailali District of Nepal. Journal of Animal Diversity 2 (2020): 24-36.
- Joshi R. Asian Elephant’s (Elephas Maximus) Behaviour in the Rajaji National Park, North-West India: Eight Years with Asian Elephants. Nature and Science 7 (2009): 49-77.
- Chatterjee ND. Man-Elephant Conflict: A Case Study from Forests in West Bengal, India: Springer (2016).
- Douglas-Hamilton I, Krink T , Vollrath F. Movements and Corridors of African Elephants in Relation to Protected Areas. Naturwissenschaften 92 (2005): 158-163.
- Wilson G, Gray RJ, Sofyan H. Identifying the Variation in Utilization Density Estimators and Home Ranges of Elephant Clans in Aceh, Sumatra, Indonesia. European Journal of Wildlife Research 66 (2020): 88.
- Foguekem D, Tchamba MN, LeBreton M, et al. Changes in Elephant Movement and Home Ranges in the Waza Region, Cameroon. Scientific Research and Essays 4 (2009): 1423-1431.
- Sharma P, Chettri N, Uddin K, et al. Mapping Human?Wildlife Conflict Hotspots in a Transboundary Landscape, Eastern Himalaya. Global Ecology and Conservation 24 (2020): e01284.
- Neupane B, Budhathoki S, Khatiwoda B. Human-Elephant Conflict and Mitigation Measures in Jhapa District, Nepal. Journal of Forest and Livelihood 16 (2018): 103-112.
- Neupane B, Khatiwoda B, Budhathoki S. Effectiveness of Solar-Powered Fence in Reducing Human-Wild Elephant Conflict (Hec) in Northeast Jhapa District, Nepal. Forestry: Journal of Institute of Forestry, Nepal 15 (2018): 13-27.
- Cushman SA, Chase M, Griffin C. Mapping Landscape Resistance to Identify Corridors and Barriers for Elephant Movement in Southern Africa. Spatial complexity, informatics, and wildlife conservation (2010): 349-367.
- Naha D, Sathyakumar S, Dash S, et al. Assessment and Prediction of Spatial Patterns of Human-Elephant Conflicts in Changing Land Cover Scenarios of a Human- Dominated Landscape in North Bengal. PloS one 14 (2019): e0210580.
- Gubbi S. Patterns and Correlates of Human–Elephant Conflict around a South Indian Reserve. Biological Conservation 148 (2012): 88-95.
- Branco PS, Merkle JA, Pringle RM, et al. Determinants of Elephant Foraging Behaviour in a Coupled Human-Natural System: Is Brown the New Green? Journal of Animal Ecology 88 (2019): 780-792.
- Pant G, Dhakal M, Pradhan N, et al. Nature and Extent of Human–Elephant Elephas Maximus Conflict in Central Nepal. Oryx 1 (2015): 1-8.
- Ram AK, Yadav NK, Subedi N, et al. Landscape Predictors of Human Elephant Conflicts in Chure Terai Madhesh Landscape of Nepal. Environmental Challenges 7 (2022): 100458.
- Yadav BR. Human-Elephant Relationships and Conflicts in Eastern Nepal. The Initiation 1 (2007): 93- 99.
- Yadav B, Dutta C, Chalise M, et al. Human-Asian Wild Elephant (Elephas Maximus) Conflicts and Its Socio-Economic Consequences in and around the Protected Areas of Central Terai, Nepal. Banko Janakari 24 (2014): 47-54.
- Koirala RK, Weihong J, Timilsina YP, et al. Patterns, Perceptions, and Spatial Distribution of Human-Elephant (Elephas Maximus) Incidents in Nepal. Journal of Threatened Taxa 13 (2021): 18441-18452.
- Joshi R, Singh R. Feeding Behaviour of Wild Asian Elephants (Elephas Maximus) in the Rajaji National Park. The Journal of American Science 4 (2008): 34-48.
- Bal P, Nath CD, Nanaya KM, et al. Elephants Also Like Coffee: Trends and Drivers of Human–Elephant Conflicts in Coffee Agroforestry Landscapes of Kodagu, Western Ghats, India. Environmental Management 47 (2011): 789-801.
- Acharya KP, Paudel PK, Neupane PR, et al. Human-Wildlife Conflicts in Nepal: Patterns of Human Fatalities and Injuries Caused by Large Mammals. PLOS ONE 11 (2016): e0161717.
- Shrestha S, Shrestha J. Asian Elephants and Their Status in Nepal: A Review. Journal of Agriculture and Natural Resources 4 (2021): 227-237.
- Pradhan NM, Williams AC, Dhakal M. Current Status of Asian Elephants in Nepal. Gajah 35 (2011): 87-92.
- Neupane D, Baral S, Risch TS, et al. Broad Scale Functional Connectivity for Asian Elephants in the Nepal-India Transboundary Region. Journal of Environmental Management 321 (2022): 115921.
- Statistical Information on Nepalesse Agriculture 2076-77 (2020) (2019-20). Singhdurbar, Kathmandu, Nepal: Ministry of Agriculture and Livestock Development. Retrieved from https://moald.gov.np/wp-content/uploads/2022/04/STATISTICAL-INFORMATION-ON-NEPALESE-AGRICULTURE-2076-77-2019-20.pdf
- Bardiya National Park (2020). Retrieved 23/02/2023, from https://dnpwc.gov.np/en/conservation-area-detail/80/
- Dinerstein E. An Ecological Survey of the Royal Karnali-Bardia Wildlife Reserve, Nepal. Part I: Vegetation, Modifying Factors, and Successional Relationships. Biological Conservation 15 (1979): 127-150.
- Ram AK. Landscape Level Modeling of Asian Elephant (Elephas Maximus) Habitat, Its Population and Interaction with Humans in Nepal thesis). Saurashtra University Rajkot (2021).
- Yadav S. Status and Distribution Pattern of Endangered Large Predators (Tiger Panthera Tigris and Forest Leopard Panthera Pardus) in Bardia-Katarniaghat Corridor thesis). B. Sc Thesis. School of Environmental Science and management, Pokhara University (2011).
- Nagarkoti A. A Comparative Study of Abundance of Tiger Prey Base in Bardia-Katarniaghat (Khata) Corridor and South-West Corner of Bardia National Park, Nepal thesis). Norwegian University of Life Sciences (2012).
- Chaudhari UK, Kafle G, Baral HS. Avifaunal Diversity of Khata Corridor Forest. Journal of Wetlands Ecology 48-56 (2009).
- Wegge P, Yadav SK, Lamichhane BR. Are Corridors Good for Tigers Panthera Tigris but Bad for People? An Assessment of the Khata Corridor in Lowland Nepal. Oryx 52 (2018): 35-45.
- Team RC. A Language and Environment for Statistical Computing. R Foundation for Statistical Computing. Vienna, Austria (2023).
- Kassambara A. Comparing Groups: Numerical Variables. Datanovia 192 (2019).
- Bruce P, Bruce A, Gedeck P. Practical Statistics for Data Scientists: 50+ Essential Concepts Using R and Python: O'Reilly Media (2020).
- Prins HH, Liefting Y, de Jong JF. Marginal Farmers Carry the Burden of Damage Caused by Asian Elephants Elephas Maximus in Bardiya National Park, Nepal. Oryx 56 (2022): 73-81.
- Neupane D, Johnson RL, Risch TS. How Do Land-Use Practices Affect Human— Elephant Conflict in Nepal? Wildlife Biology 2017 (2017).
- Desai AA, Baskaran N. Impact of Human Activities on the Ranging Behaviour of Elephants in the Nilgiri Biosphere Reserve. South India. Journal of the Bombay Natural History Society 93 (1996): 559-569.
- Thant ZM, Leimgruber P, Williams AC, et al. Factors Influencing the Habitat Suitability of Wild Asian Elephants and Their Implications for Human– Elephant Conflict in Myanmar. Global Ecology and Conservation 43 (2023): e02468.
- Rowe M, Bakken G, Ratliff J, et al. Heat Storage in Asian Elephants During Submaximal Exercise: Behavioral Regulation of Thermoregulatory Constraints on Activity in Endothermic Gigantotherms. Journal of Experimental Biology 216 (2013): 1774-1785.
- Wittemyer G, Getz W, Vollrath F, et al. Social Dominance, Seasonal Movements, and Spatial Segregation in African Elephants: A Contribution to Conservation Behavior. Behavioral Ecology and Sociobiology 61 (2007): 1919-1931.
- Chakraborty K, Mondal J. Perceptions and Patterns of Human–Elephant Conflict at Barjora Block of Bankura District in West Bengal, India: Insights for Mitigation and Management. Environment, Development and Sustainability 15 (2013): 547-565.
- Mohanarangan A, Chinnaiyan S, Kaliyaperumal S, et al. Determinants of Human-Elephant Conflict in Mudumalai Tiger Reserve, Southern India (2021).
- Graham MD, Douglas-Hamilton I, Adams WM, et al. The Movement of African Elephants in a Human-Dominated Land-Use Mosaic. Animal conservation 12 (2009): 445-455.
- Guha M, Guha A. Migration Ethology of Dalma Herd and Analysis of the Rationale Behind. The Beats of Natural Sciences 1 (2014): 1-8.
- Khanal B. Using Machine Learning to Predict the Risk of Human-Elephant Conflict in the Nepal-India Transboundary Region thesis). University of Twente (2022).
- Graham MD, Adams WM, Kahiro GN. Mobile Phone Communication in Effective Human Elephant–Conflict Management in Laikipia County, Kenya. Oryx 46 (2012): 137-144.
- Songhurst A, McCulloch G, Coulson T. Finding Pathways to Human–Elephant Coexistence: A Risky Business. Oryx 50 (2016): 713-720.


 Impact Factor: * 4.1
 Acceptance Rate: 75.32%
  Time to first decision: 10.4 days
  Time from article received to acceptance: 2-3 weeks