Integrated Treatment of Paint Wastewater Using Helix Pometia Shell Coagulant and Sludge Conversion to Biogas: Process Thermodynamics and Biogas Energy Content
MI Ejimofor1*, IG Ezemagu1, MC Menkiti1*
1Department of Chemical Engineering, Nnamdi Azikiwe University, Awka, Anambra State, Nigeria
*Corresponding Author: MI Ejimofor, MC Menkiti, Department of Chemical Engineering, Nnamdi Azikiwe University, Awka, Anambra State, Nigeria
Received: 08 June 2021; Accepted: 15 June 2021; Published: 14 July 2021
Article Information
Citation:
MI Ejimofor, MC Menkiti, IG Ezemagu, Integrated Treatment of Paint Wastewater Using Helix Pometia Shell Coagulant and Sludge Conversion to Biogas: Process Thermodynamics and Biogas Energy Content. International Journal of Plant, Animal and Environmental Sciences 11 (2021): 391-422.
View / Download Pdf Share at FacebookAbstract
This work focused on treatment of paint wastewater and biofuel generation using post coagulation sludge (PCS). Helix potemia shell coagulant was used as a biocoagulant for paint wastewater coagulation. The PCS was converted to biogas via anaerobic digestion. The biogas production process thermodynamics and the energy content of the biogas were evaluated. The total solid (TS) content of the paint wastewater sample (3994mg/l) before the treatment reduced to 804mg/l (42% below the national discharge limit of 1905mg/l) after the coagulation treatment. The volatile solid content(%VS) and the C: N value of 76% and 25:1 indicate that PCS has propensity to yield gas. Cumulatively, 250ml of biogas was recovered within the 40days from 150g of PCS. The recovered biogas contained 63% methane. The negative gibbs free energy (ΔG) of -7.81E+04 shows that the digestion process was spontaneous. Positive enthalpy (ΔHo) and entropy (ΔSo) values of 259.1136KJ/Kg and 8.61E+03Kj/K depict the process was endothermic and entropy driven, respectively. The upper calorific value (UCV), lower calorific value (LCV), latent heat of vaporization (LHV), wobbies index (W) and adiabatic flame temperature (TTL) of 24385.54 kJ/m, 21964.34kJ/m3, 2421.202 kJ/m3, 30246.54 kJ/m3 and 813.1189K, respectively indicate that the biogas is within the standard that can be used in internal combustion engine or as cooking gas.
Keywords
<p>Paint wastewater; Helix pometia; Post coagulation sludge; Anaerobic digestion; Thermodynamics; Biogas energy</p>
Article Details
1. Introduction
Treatment of industrial wastewater and management of post treatment sludge has been an issue of interest to researchers. In one way or the other, discharge of untreated wastewater has affected the eco-system adversely [1-5] and will continue to be a global challenge if nothing is done to curtail its impact. Industries such as paint manufacturing industry generate tons of wastewater annually [6-8] which is expected to return into the ecosystem. The wastewater from paint industry contains suspended particles and other contaminants (dissolved solids), hence cannot be returned into the environment without adequate treatment (9). Generally, much research has successfully treated different wastewaters including paint wastewater to conform to WHO standard [9-15] for discharge into the environment [16-19]. However, researchers in quest to solve the puzzles of decontaminating the wastewater to conform to dischargeable standard have created another problem of management of large volume of post treatment sludge [20, 21]. Specifically, huge success has been recorded in treatment of paint wastewater using coagulation [5, 14, 22-26] and adsorption methods [27-30]. This research leaves behind the gap of effective management of the post coagulation or post adsorption sludge associated with these treatments. The post treatment sludge, toxic as they may be always disposed in dumps and landfills [31-33]. For effective management of post treatment sludge, an attempt has been made to integrate a method of converting the sludge into a useful product that will be beneficial to the society. The present method seeks to convert the post coagulation sludge from paint wastewater coagulation into biogas via anaerobic digestion. Coagulation/flocculation and anaerobic digestion are two main methods for this present research. Coagulation/flocculation as treatment method employs the introduction of coagulants into the wastewater sample to effect particles charge neutralization and subsequent floc formation. The flocs formed during the process settle by gravity and are recovered as post coagulation sludge. The choice of the coagulant depends on the extent of clarification desired and the purpose of treatment (discharge or reuse) [34, 35]. However, recent research emphasized the need for eco-friendly coagulants and suggested the use of natural coagulants which are biodegradable over chemical-based coagulants [9, 36, 37]. Hence, the present work verified the possibility of extraction coagulant from helix potemia shells. The post coagulation sludge recovered from the use of the extracted coagulant (helix potemia shell coagulant) in treatment of paint wastewater is rich in C: N (carbon – nitrogen ratio), hence can yield biogas via anaerobic digestion. Biogas is important for energy sustainability [38]. It was referred to as “the future way” [39] in terms of eco- friendly energy generation. With a climatic condition that has been adversely affected by burning of fossil fuels, resulting in intense droughts, devastating hurricanes, and a diminishing ozone [40-44] a clean, renewable energy source is of interest. Biogas is fast becoming a valuable energy source contributing to the global energy need. At the end of this work, three things are set to be achieved; (a) to extract a bio-coagulant from helix pometia shell for treatment of the paint wastewater (b) treat the paint wastewater to conform to dischargeable standard and (3) recover and convert the post coagulation sludge into biogas.
2. Materials and methods
2.1 Raw material collection and preparation
Helix pometia shells (Plate 1) were obtained as waste at no cost from a market in Onitsha, Anambra State, Nigeria, while the paint wastewater was collected after a batch wash-off at Naco paints Onitsha, Anambra State. The shells were washed with distilled water and sun dried for two days. The dried samples were milled and sieved with standard sieve (1/4in mesh size). The milled sample (Helix pometia shell floor, HPSF) of 0.91 – 0.43um was obtained and stored in an airtight sack for further use.
2.2 Novel strong alkaline solution extraction method of HPSC from HPSF
The Fernandez-Kim extraction procedure [9] was modified for the extraction of helix pometia shell coagulant (HPSC). 100g of HPSF was introduced into 500ml of 3.5% NaOH (w/v) solution contained in 1L extraction beaker. The resultant mixture was heated to 70oC and kept at same temperature under agitation for 2h. 2 ml of de-ionized water was added at intervals to prevent foaming. After 2h stirring, the mixture was subsequently allowed to cool to room temperature and separated using filter sack setup. The extract was allowed to settle and decanted to remove the clear extraction solution from the crude extract. The insoluble product obtained was washed with distilled water and discalced thermally at 105oC for 2 min to precipitate any trace of calcium. The resultant mixture was allowed to settle and further decanted to have more concentrated sample. The potential of the obtained sample termed helix pometia shell coagulant (chito-protein) was harnessed in treatment of paint wastewater via jar test experiment using conventional coagulation method adopted from Menkiti and Ejimofor et al., 2016.
2.3 Sludge collection and preparation
The post coagulation sludge (PCS) used were collected after the coagulation treatment of the paint wastewater using Helix Pometia shell coagulant (HPSC). The sludge (PCS) was separated from the bulk of the treated water by decanting the clarified wastewater. Furthermore, the recovered PCS was mildly concentrated by heating in an oven at 800C for 20min.
2.4 Materials characterization
2.4.1 Paint wastewater (PW): The characterization of paint wastewater was conducted based on the standard methods for the characterization of wastewater as reported by Menkiti and Ejimofor 2016.
2.4.2 Helix pometia shell coagulant (HPSC): HPSC was characterized using proximate and elemental characterization. The parameter testing methods for the proximate characterization is given in Table 1.
2.4.3 PCS characterization: Instrumental characterization of PCS was done using standard instruments and test methods. EDX/WDS scanning electroscope was used for surface morphological analysis, thermo nicolet 470FTIR spectrophotometer was used for FTIR characterization. X-ray diffraction pattern was obtained using X-ray diffraction spectrophotometer (MiniFlex Benchtop model). Physical characterizations were also carried out to determine the following: total solid content (TS)7, volatile solid content (VS)8, chemical oxygen demand (COD)9, total carbon (TOC)10 and the total nitrogen (TN)11. The testing methods are presented in Table 1(7-11- method number in Table 1).
|
S/No |
Parameters |
Procedure |
Ref. |
|
1 |
Yield (%) |
AOAC – PA (118) (1990) |
[43] |
|
2 |
Protein (%) |
AOAC- 920.53 (1995) |
[42] |
|
3 |
Bulk density (g/ml) |
ASTM E-357-07 (2015) |
[43] |
|
4 |
Ash content (%) |
AOAC -942.05PA (2000) |
[43] |
|
5 |
Weight loss (%) |
AOAC - 930.15(2000) |
[42] |
|
5 |
Oil content (%) |
AOAC – 999.02(1999) |
[44] |
|
6 |
Moisture content (%) |
AOAC 934 (2005) |
[46] |
|
7 |
Total, solid (TS) |
APHA 2540B (1997) |
[35] |
|
8 |
Volatile solid (VS) |
APHA 2540E (1997) |
[35, 37] |
|
9 |
Chemical oxygen demand (COD) |
APHA 5220 B (2005) |
[57] |
|
10 |
Total, Carbon |
Walkley and Black (1934) |
[35] |
|
11 |
Total, Nitrogen |
APHA 4500-Norg C (2005) |
[46] |
Table 1: Parameter testing method for proximate/physical characterization of HPSC and PCs.
2.5 Bench scale Jar test experiment
Standard turbid-metric laboratory Jar test method [5, 9] was used for the coag- flocculation experiment. 500 mL of PPW samples were measured into (five) 1000mL beakers. 1000-5000mg of konki-De was dosed into 5different beakers. Specified pH adjustment was achieved using 0.1MH2SO4 and 0.1M NaOH after the experiment was first conducted using the initial pH of PPW. The mixture was continuously stirred in a magnetic stirrer for 2min at 250rpm stirring speed and subsequently reduced to 30rpm for 20min. The treated mixture was allowed to settle for 35min.Within this interval, at desired times, 20mL of the clear upper layer of the settling mixture was taken and analyzed for residual turbidity. The data obtained were used to investigate the treatment efficiency, effect of process parameters, adsorption kinetics and equilibrium studies.
2.6 Biogas production
Bio-gas production via anaerobic digestion of PCS was carried out using four experimental units (anaerobic bio-digester, biogas measuring unit, biogas purification unit and biogas collection unit) as shown in Figure 1.
A mixture of 150g of PCS and 450ml of water was charged into the anaerobic bio-digester (A, Figure 1) (made of sealed 1L gallon, with 750ml working volume). The crude biogas produced inside the bio-digester flowed into the water displacement biogas measuring unit (B) through delivery tube (D1). The water displacement measuring unit consists of inverted measuring cylinder and bowel filled with supersaturated acidified brine. The brine was used to prevent dissolution of the produced biogas and to enhance the building up of gas pressure for easy measurement and recovery [45]. The biogas is expected to displace equal volume of brine inside the measuring unit. The volume of water displaced by the biogas entering the measuring unit was recorded every five (5) days. The biogas evolved in the air space of the inverted measuring cylinder flowed into the purification unit through delivery tube D3. Within the purification unit, the biogas passed through subunits C (containing Ca (OH)2), D (containing solution of iron fillings) and E (containing CaCl2) to remove CO2(g), H2S(g) and H2O(g), respectively. Aliquots were collected from the bio-digester at five days intervals through line D2 (sampling point) for analysis (TS, VS, TOC, TN). The biogas sample collected from collection unit (F) after the 40 days retention time was analyzed using gas chromatography.
2.7 Thermodynamics of biogas production process
The biogas production thermodynamic parameters: mass fractions, specific gas constant, specific heats, ratio of the specific heats, internal energy, and enthalpy were calculated from the gas chromatography result using Equations (1) to (10) shown in Table 2 [46].
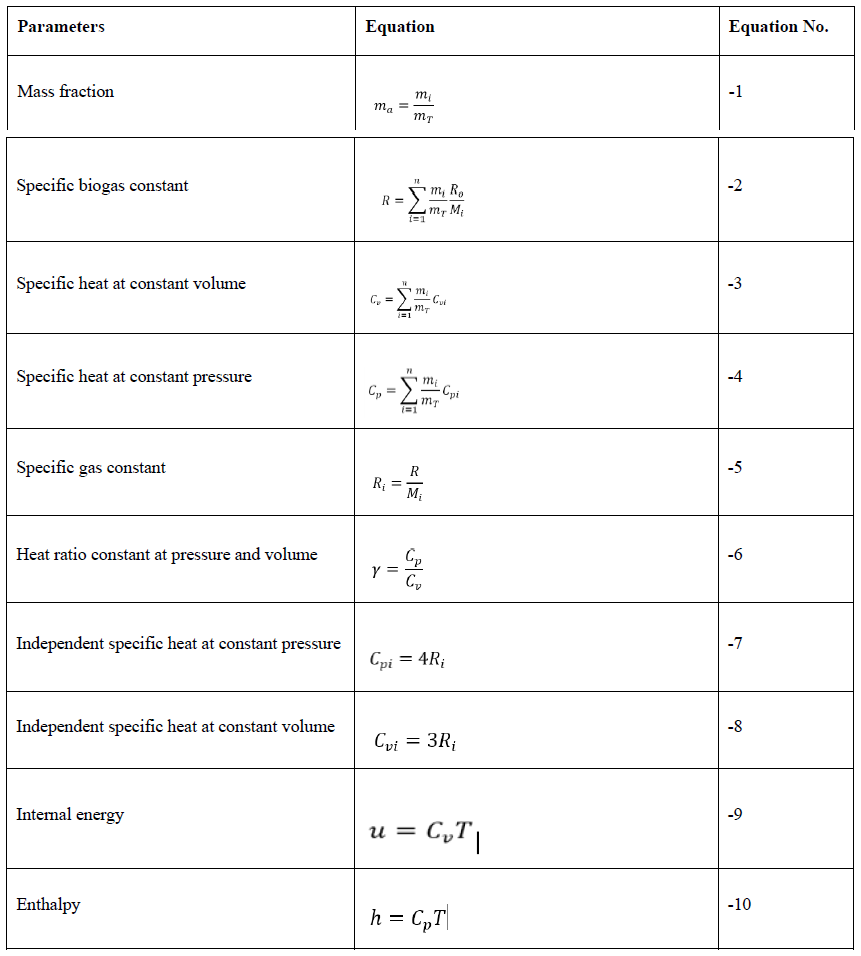
Table 2: Thermodynamics parameters estimated.
ma -mass fraction of the biogas components,mi - the mass of a component gas in the mixture, mT - the total mass of the components in the mixture. R- Specific biogas constant, R0 - the universal gas constant; Ri - specific gas constant of a component gas in the biogas mixture. Cp - specific heat at constant pressure, Cv - specific heat at constant volume, γ - ratio of the specific heats, Cvi- specific heat at constant volume, u - specific internal energy,h- specific enthalpy
Furthermore, change in standard Gibb’s free energy (ΔGo), standard enthalpy (ΔHo), and standard entropy (ΔSo) were also estimated using modified Eyring-Polanyi equation (Equation 11), Equation 12 and 13, respectively.
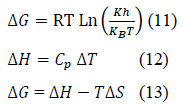
Where k is the rate constant (s-1) from kinetic studies (reported elsewhere), T is the absolute temperature (K), R, kb and h are the universal gas (8.314 Jmol-1K-1), Boltzmann (1.38 x 10⁻²³ J/K) and Planck’s (6.63x 10⁻³⁴ J s) constants, respectively. The transmission coefficient κ is often taken as unity.
2.8 Energy Content of Biogas
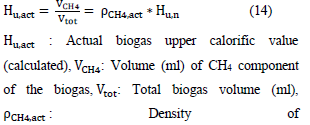
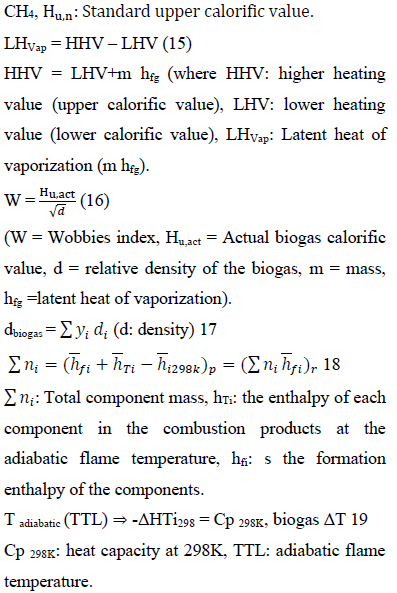
Energy content of biogas estimates the approximate values of the useful part of energy obtained during biogas combustion. The higher the energy content, the higher the biogas quality and the lower the chemical complexity [47-49]. The energy parameters of the recovered biogas (actual calorific values (heating value), the latent heat of vaporization (the difference between the upper calorific and actual calorific value), the wobbe’s index (W) and the adiabatic flame temperature (TLL) were evaluated based on the thermodynamics properties of the biogas (specific heat (Cp) molar mass(M), density (ρ), standard lower calorific value (Hu), specific gas constant(R) using Equations 14, 15, 16 and 12, respectively.
3. Results
3.1 Paint wastewater analysis before and after coagulation
Wastewater analyses of the paint wastewater carried out before and after coagulation treatment were compared with the national environmental regulatory standard for wastewater discharge (national discharge limit) in Table 3. The jar test experiment was conducted using best coagulant dosage, pH, temperature, and time of 4g/l, 4, 45oC and 20mins, respectively obtained from the preliminary one factor at a time jar test experiment. Table 3 shows that the paint wastewater has high content of TSS and TDS of 2681mg/l and 1313mg/l, respectively as against the NERS (National effluent regulatory standard) standard of 300NTU (705mg/l) and 1200mg/l before treatment. The high TSS and TDS observed in paint effluent indicate that the wastewater contains high particle load which cannot be discharged to the environment without treatment. The sample’s pH (7.89) was observed to be within the acceptable standard. After the coagulation treatment, the wastewater characteristic was observed to have reduced below the discharge limit. Hence, the treated wastewater can be discharged into the environment without adverse effect.
|
Nacco Paint wastewater Quality |
Before treatment |
After treatment |
NERS |
|
TS (mg/l) |
3994 |
804 |
1905 |
|
TSS (mg/l) |
2681 |
279 |
705 |
|
TDS (mg/l) |
1313 |
525 |
1200 |
|
pH |
7.89 |
7.2 |
07-Aug |
Table 3: Wastewater Analysis of Nacco emulsion paint wastewater.
TS: Total solid, TDS: Total dissolved solid, TSS: Total suspended solid.
3.2 Sludge characterization
3.2.1. Elemental Analysis of PCS: Elemental characterization was carried out to evaluate the elemental composition of PCS. Table 4 shows that PCS contains calcium (Ca), oxygen (O), sodium (Na) and carbon (C) as the major elemental components. Other elements such as Mg, Al, P, Si, C, Cl, Ti, and K are in trace values. The Ca, Si Cl, Ti, C and Na content of PCS can be attributed to the suspended particles in paint wastewater which must have
resulted from different components used in paint production (calcium carbonate, titanium dioxide, Sodium silicate, biocide, cellulose thickener among others). The oxygen (O) and other components result from the natural coagulant (helix potemia shell extract HPSE, [5] used for the jar test coagulation experiment. The presence of these elements infers that PCS consists of the particles in the wastewater and the crude extract (chito-protein) used as coagulant for particles decontamination.
|
Elements |
%W.C |
|
C |
9.26 |
|
Na |
7.68 |
|
Mg |
1.96 |
|
Al |
3.03 |
|
P |
0.27 |
|
Si |
3.28 |
|
Cl |
0.94 |
|
K |
0.25 |
|
Ca |
39.6 |
|
Ti |
3.58 |
|
Fe |
1.33 |
|
O |
29.04 |
Table 4: Elemental composition of the post coagulation Sludge (PCS).
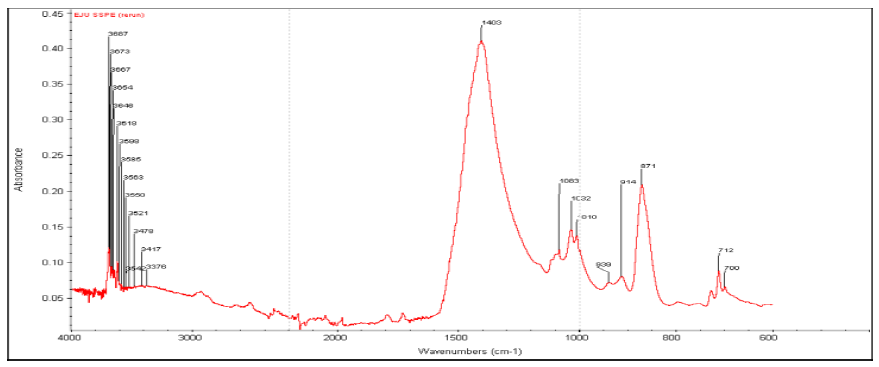
3.2.2 FTIR Analysis of PCS: The observed functional groups in PCS give suggestion of the proportion of the biodegradable components of PCS. The presence of functional group such as amine group, β-glycosides, cellulose infers that to a large extent PCS is biodegradable. Furthermore, understanding of the surface chemistry of the sludge in terms of the present functional group will aid the decision of the best method to apply for sludge processing and treatment.
FTIR spectrum of PCS (Figure 1) shows many distinct and pronounced peaks. The peaks were analyzed and compared with the known signature of identified materials in FTIR library (FTIR databases, wwwftir-libraries.com). From the spectrum peaks within the plot of absorbance and wavenumbers, the nature and representation of some functional groups were observed. Twenty-four (24) discernable peaks were detected between the frequencies (wavenumbers) of 600-4000 cm-1 in Figure 1. The highest peak can be observed as 1403 cm-1 and at a threshold of 0.4. This peak represents =C–H in-plane bending of alkene aliphatic compound. A trace of carboxylic functional group is observed as stunted band at 3000 cm-1. The peak at 3476 cm-1 may be attributed to cellulose –OH stretching vibration [35]. The appearance of peak within the range of 3300-3500 cm-1 could be linked to N-H stretching of amine group. Peaks within the range of 3500 – 3550 cm-1 depict phenol O-H stretching. Frequency range above 3550 cm-1 as seen in the higher wave number area of the spectrum could be linked to alcohol O–H stretching, which is typical of oxygen containing compounds. This can be confirmed by the presence of oxygen in the chemical/elemental characterization presented in Table 4. At the lower wave-number area, the appearance of band at 939 cm-1 could be attributed to C–O–H out-of-plane bending while peaks at 712 cm−1 and 700 cm−1 show N-H wagging group. In addition, the presence of β-glycosides at 871 cm-1 may have given credence to the presence of cellulose [50]. These functional groups were formed from the adsorptive interaction between the suspended particles from paint and the bio-coagulant during the coagulation experiment that generated the PCS.
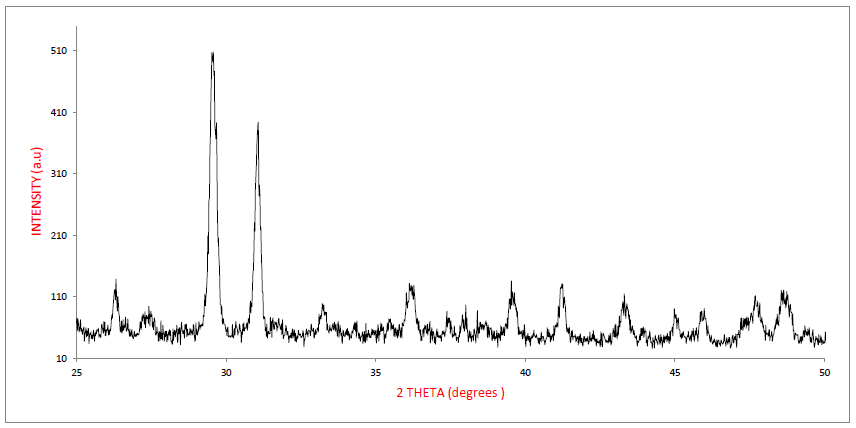
3.2.3 XRD Analysis of PCS: X-ray diffraction spectrum of PCS is presented in Figure 2. From the spectrum, a systematic arrangement of peaks with two distinct high intensity peaks and other ten (11) low intensity peaks can be observed. Hence, a total of twelve (13) clear peaks were detected at scattering angles of 2θ = 260, 270, 290, 310, 330, 360, 390, 420, 440, 460, 470, 480 and 490, respectively.
The two distinct peaks represent the dominant element accumulated during coagulation (calcium and oxygen). The two elements were found also to be prominent in elemental characterization of PCS (Table 4). It is understandable that calcium is one of the major constituents in paint wastewater while the oxygen shows to a great extent the protein content the bio-coagulant used in PCS generation [9]. The low intensity peaks can be attributed to the position of the trace elements within the crystalline structure. The symmetric arrangements of the peaks indicate a well-organized atomic grouping or crystalline spacing within the internal chemistry of PCS. This arrangement indicates an organized crystalline structure. The lattice d-spacing (interplanar spacing) was evaluated using Braggs equation (d= λ/(2Sin θ) [51-53]. The first diffraction plane was observed from the origin at hkl of 000. Therefore, it can be concluded that the atomic structure of PCS is of primitive crystalline structure [9]. The lattice planes for the peaks are presented in Table 5. The planes represent the distances between successive, parallel planes of lattice atoms. The planes act as diffraction gratings to radiation that has a wavelength comparable in size to the spacing between planes.
|
peak |
2θ |
θ |
d(A) |
Plane (hkl) |
|
1 |
26 |
13 |
3.43 |
0 |
|
2 |
27 |
13.5 |
3.3 |
103 |
|
3 |
29 |
14.5 |
3.08 |
222 |
|
4 |
31 |
15.5 |
2.89 |
4 |
|
5 |
33 |
16.5 |
2.72 |
110 |
|
6 |
36 |
18 |
2.49 |
200 |
|
7 |
39 |
19.5 |
2.31 |
202 |
|
8 |
42 |
21 |
2.15 |
111 |
|
9 |
44 |
22 |
2.06 |
202 |
|
10 |
46 |
23 |
1.97 |
200 |
|
11 |
47 |
23.5 |
1.93 |
200 |
|
12 |
48 |
24 |
1.89 |
220 |
|
13 |
49 |
24.5 |
1.86 |
220 |
Table 5: d- Values and their corresponding miller’s planes for PCS.
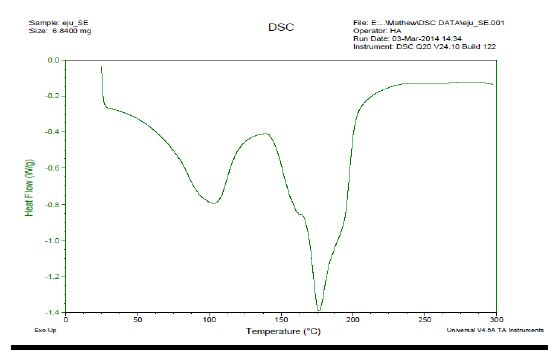
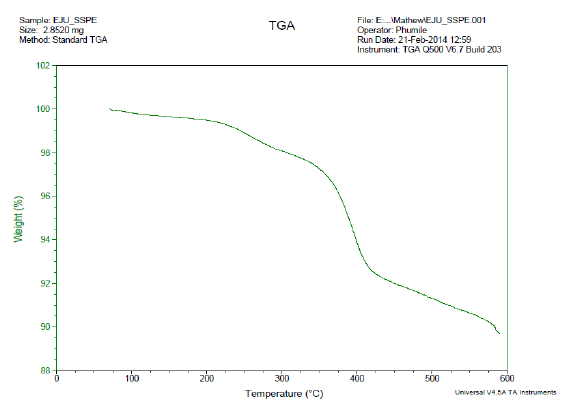
3.2.4 DSC /TGA for PCS: PCS was subjected to DSC and TGA; the images obtained are presented in Plate 1 respectively. From Plate 1, the glass transition point was observed at 25oC, while the sharp transition was observed at 102oC. The Eutectic point in DSC curve of any material projects the presence of impurity on such material (Sari,2006). The point-like elongated part at 175oC (eutectic point) shows that PCS is not a pure sample from single origin. PCS contains particles from different origins aggregated and settled as sludge. From thermal gravimetric analysis (TGA) in Plate 2, the descending TGA thermal curve obtained indicates that weight loss occurred. The plateau stage was observed between 100 - 200oC. This stage indicates a stage of thermal stability where there is no weight loss as a result of variation in temperature. The onset temperature was observed at 225oC. At this temperature, the initial pronounced weight loss began. Weight loss of 69% was obtained; this weight loss must have resulted from the volatile part of PCS. This observed volatile content of the recovered sludge (PCS) infers those parts of the PCS are biodegradable. Sludge of that nature can be used effectively for biogas production.
3.2.5 Physicochemical Properties of the digester feedstock: The intrinsic properties of PCS were observed via physicochemical characterization shown in Table 6. The parameters of importance while considering a feed slurry for anaerobic digestion are the carbon-to-nitrogen value (C: N) and the volatile solid content (% VS). The % VS shows the extent of the biodegradability of the feed slurry.
|
Parameters |
PCS |
|
pH |
6.94 |
|
TS |
222g/l |
|
COD |
1236mg/l |
|
BOD5 |
866.5mg/l |
|
TOC |
28% |
|
VS(%TS) |
76 |
|
VSS (mg/l) |
3179 |
|
TKN |
1.12% |
|
C: N |
25:01:00 |
Table 6: Physicochemical characterization PCS.
For a biodegradable feed slurry, the potential for biogas yield is a measure of the C:N value. Feed slurry with good propensity for biogas yield must have C:N value within the range of 25:1 and 30:1 [46]. From Table 6, the %VS for PCS feed slurry was found to be 76%. The % VS of this magnitude indicates that greater part of the feed slurry is biodegradable. The C:N value of 25:1 was obtained which shows that the slurry has a good potential for biogas yield. Hence it could be inferred that PCS can be used as precursor for biogas generation. Near neutral PCS pH of 6 is reasonably within the suitable pH for bacteria activities in anaerobic digestion. The presence of organic matter in PCS was revealed by the BOD and COD of 1236 mg/l and 866.5, respectively.
3.3 Biogas production
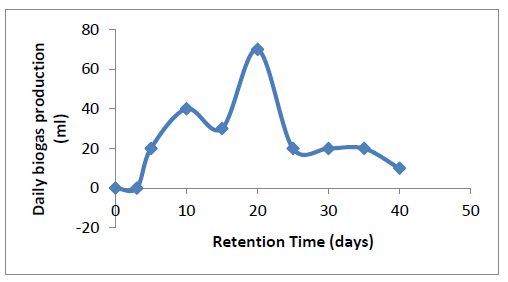
3.3.1 Biogas Yield: The biogas yield from PCS digestion was observed every five days using water displacement method (see biogas production method). The volume of biogas generated was plotted against retention time in Fig 3.
Different stages can be observed from the sinusoidal trend of Figure 3. These stages include: the lag stage, acidogenesis stage, acetogenesis and methanogenesis stage. Although these stages sometimes take place simultaneously in some cases. It is possible to detect them from a careful study of the process. From Figure 3, it can be observed that the biogas production started after the day 3 of charging the feed slurry into the bio-digester. From day 1 to day 3 when there was no active yield of biogas is regarded as the hydrolysis period. In general, hydrolysis is a chemical reaction. Within this period, there is formation of H+ cations and OH- anions. The otherwise unstable large organic polymers in the feed slurry are broken down into simple organic monomers, oligomers and amino acids that could be utilized by the fermentative acido-genesis bacteria. [54, 55] referred to this hydrolysis period as lag period which is the minimum time required for commencement of biogas production. From the FTIR characterization in Figure 1, it was observed that PCS contains protein and cellulose. Therefore, protease and cellulase must have played major role in PCS hydrolysis.
The acidogenesis stage began at the day 4. This stage is characterized by the release of proton and proton acceptors. Within this period, acid forming bacteria which are facultative, break down the products of hydrolysis into acetic acid (CH3COOH), hydrogen (H2), carbon dioxide (CO2) and alcohols [55]. The stage is also characterized by the onset of actual biogas yield after the lag period. From Figure 3, this stage was observed within day 4 - day 9. Within the acidogenesis stage, active gas production was observed; however, the non-flammability of the gas at this stage indicates the absence of methane gas. [56] reported a similar result.
The termination of acido-genesis stage was marked by the onset of flammability, which introduced aceto-genesis and methanogenesis stages on the day 10. The aceto-genesis stage is characterized by conversion of fermentation product into acetic acid, and H2. In addition, at this stage H2S present in biogas are formed through the action of sulphoreductors [56]. The action of two other bacteria such as homoacetogens and syntrophes are pronounced at this stage. The homoacetogens creates a pathway for acetate production while the syntophes is responsible for ammonia formation [55]. The onset of acetogenesis stage could be observed from Figure 3 at day 10. Also, it is observable that after the day 10, within the aceto-genesis stage there was decline in gas production (between day 10-15). This decline could be attributed to kinetic difference existing between the actions of acetogens and methanogens. In addition, parts of the existing products (sugar and amino acids) are being rapidly converted to acetic acid. Within this stage, the actions of methanogens cannot be ruled out due to the presence of CO2 [57]. However, the stage is predominantly for acetate formation. After this period (acetogenesis stage), the system experienced a rapid increase in yield of biogas till the maximum yield was attained on day 20. This rapid yield could be linked to increase in production of mainly methane gas resulting from surplus substrate available for methanogens. The methanogens achieve methane production by using the acetic acid and the inorganic carbon-dioxide as terminal electron acceptors. Depletion in substrate concentration resulted in decline in yield after the maximum gas yield was attained. [56, 58, 59] reported similar result.
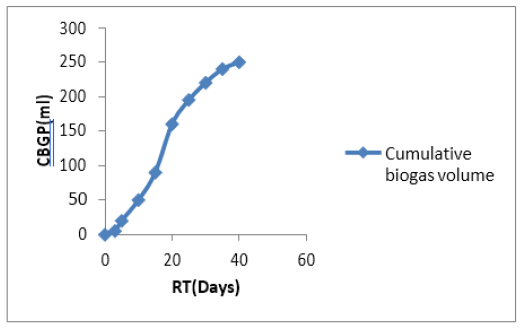
3.3.2 Cumulative biogas yield: The cumulative biogas yield within the 40 days retention time was shown in Figure 4. Within the RT (40 days), 250ml of biogas was produced from PCS slurry. This is a relatively good yield based on the size of the experimental setup (IL, with 75% working volume).
3.3.3 Variation in process parameters with retention time
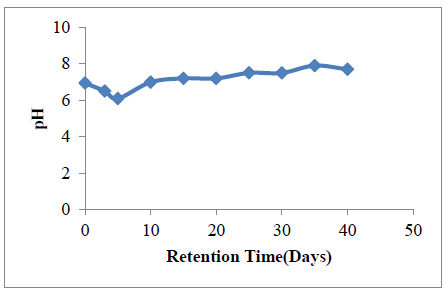
3.3.3.1 Variation in pH with retention time: The variation in pH within the anaerobic digester during the experiment is shown in Figure 5. The pH was observed to fluctuate between the pH of 7 and 8, after initial drop from 6.9-6.1 between 0-5 days of the experiment.
This initial drop in pH towards acidic level (6.9 - 6.1) before assuming a more stable values after day 10 has been attributed to the action of the acidogenic bacteria. Within this period (day 3- day 10), the acid forming bacteria (acidogenic bacteria) were actively breaking down organic content of the substrates, producing mostly organic acids. This process increases the general acidity of the anaerobic digestion system.
After the sharp decline in pH (from pH of 6.9 - 6.1), the system pH fluctuates around neutrality all through the 40 days retention time. This near neutral environment provides a suitable atmosphere for the activities of the methanogens. The maximum biogas yield was observed at the 20th day within neutral pH of 7.2.). This can be attributed to the fact that the methanogens are highly pH sensitive. The bacteria thrive within neutral pH, any slight variation in pH above or below neutrality inhibit the activities of the methanogens. [58, 60] reported similar trend.
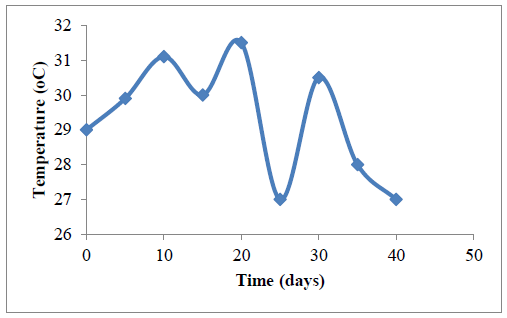
3.3.3.2 Variation in temperature with RT: The variation of the process temperature with the retention time during the bio-digestion experiment is presented in Figure 6. It was observed that the temperature remained within mesophilic range (25-31oC) throughout the 40 days retention period.
The lowest temperature reading of 27ºC was obtained on the 25th day, while the highest of 31.5ºC was recorded on the 20th day of the digestion process. The sinusoidal variation may be attributed to the influence of the surrounding environment’s physical conditions since the digester was not lagged [61]. The significant and sudden decrease in temperature from 31.5oC to 27oC, corresponding to the 20th and 25th day must have occurred as a result of the prevalent weather condition. This sudden drop must have affected the system as the gas yield dropped significantly from 70 ml to 20 ml.
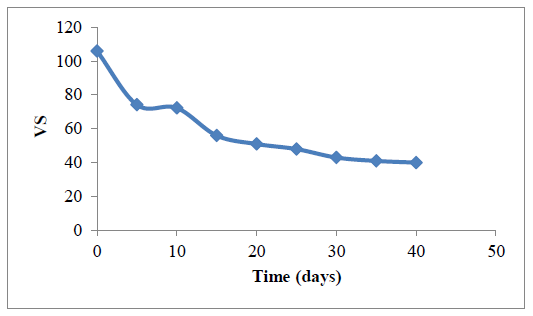
3.3.3.3 Influence of RT on volatile solid reduction: Methane yield is often based on the volatile solids portion of the feed stock, hence the more the reduction in volatile solid the more the yield of methane [62]. Figure 7 presents a plot of reduction in the volatile solid content with time. The VS were observed to decrease with increase in RT. This trend can be linked to the progressive conversion of the VS content of the feed slurry to methane by methanogens. The greater percentage of the VS reduction occurred between 0-20 days. Furthermore, between day 20 – day 40, there was no much further reduction in VS because much of the available biodegradable component of the substrate accessible to micro-organisms must have been utilized. At the end of the 40 days retention time, 37.7 % of the initial VS were unconverted while 62.3% were converted during the anaerobic digestion process. The unconverted content of the VS could be attributed to incomplete mineralization of the nitrogen content of the feed slurry during the digestion process.
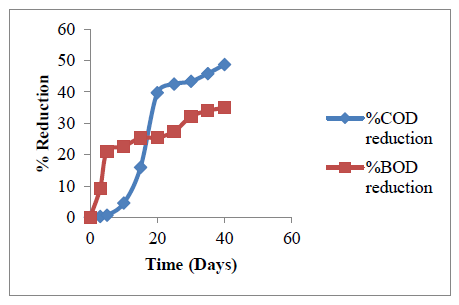
3.3.3.4 Reduction in COD and BOD with RT: The chemical oxygen demand (COD) and biochemical oxygen demand (BOD) reduction show the extent of utilization of the organic matter present in the system. While COD measures the total concentration of organic matter, BOD indicates the total amount of biodegradable organic matters [63].
The COD and BOD estimated using APHA 5220 B (2005) and ASTM D6238-98 (2012) in [64] were plotted against retention time in Figure 8. Three stages of reduction could be observed in Fig 8 (both in COD and BOD). For the COD, the lag period observed between 0-5 days represent the onset of slurry decomposition. The actions of the present micro-organisms are not very pronounced at this stage. The second stage is a stage of rapid rise in the reduction of COD. This stage was observed between day 6 – day 20. This stage represents a period of more rapid biological degradation of the organic content of the feed slurry. The final stage is a stage of another gradual or less rapid reduction between day 21 – day 40. Before this final stage, more of the organic content of the feed slurry has been decomposed; therefore, the digestion system contains less organic content. Reduction in COD is related to theoretical volumetric yield of methane gas. 1mg reduction in COD is equivalent to 0.35 ml of methane yield [65]. A total of 485.7 mg reduction was observed in COD after the last day, which is equivalent to 170 ml of methane.
Also from Figure 8, it could be observed that the reduction in BOD was favored by increase in retention time. About 383 mg reduction (34.5%) was recorded from the study. The reduction in COD and BOD show the activities of the microorganisms in decomposition of the organic materials. A total of 45% reduction was observed in COD while 34% was observed in BOD.
3.4 Variation in Methane production within 40 days RT
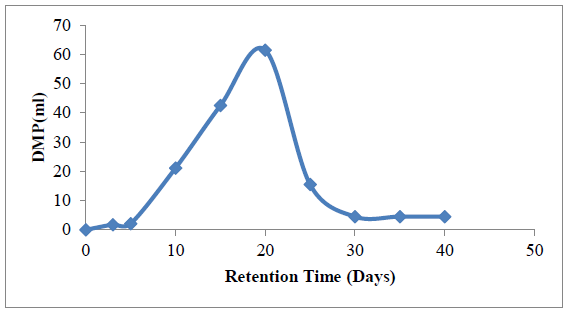
The theoretical yield of methane gas was estimated using the process COD reduction (1mg reduction in COD is equivalent to 0.35 ml of methane). Figure 9 represents the variation in daily methane production (DMP) with retention time.
Four stages can be observed from Figure 9, these stages include: the lag stage (day 0 – day 5), a stage of progressive increase in methane yield (day 6 - day 20), a stage of rapid decline in yield (day 21- day 30) and a stage of equilibrium in methane yield (day 31- day 40). The lag stage represents the initial stage of hydrolysis where there was no production of methane gas. The second stage represents a period of rapid increase in methane yield. Within the second stage, the action of methanogens are prominent, hence there was rapid conversion of acidogenesis products (CO2, acetate and H2) to methane gas. The third stage is a stage where most of the components available for conversion have been utilized. Hence, within this stage, methane production declined to the minimum before the last stage of equilibrium. The highest volume of methane was obtained at the 20th day.
3.5 Confirmatory test for the presence of methane and the effect of purification
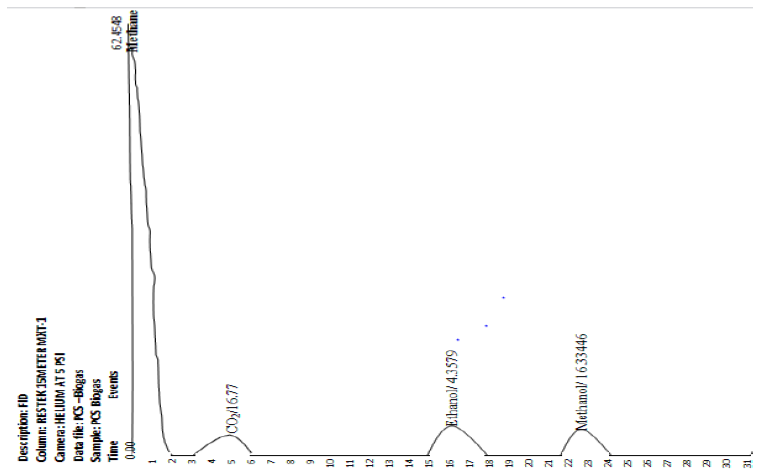
The gas chromatography conducted on the final product collected from the collection unit result in the chromatograph in Figure 10. The chromatogram presented as graph of detector response (y-axis) against retention time (x-axis), generally presents a spectrum of peaks for the sample involved. The qualitative makeup of the biogas can be deduced from Figure 10. Four components were observed at different peak strengths. Methane gas has the highest peak strength and area.
The weight percent (%composition) of each component in the biogas was estimated with the peak areas obtained from the GC result (Table 7, column 3) using Equation 20.

Where, the “Total peak area” is the summation of the peak areas of the components in the biogas in Table 7. The actual percentages of the components of the recovered biogas are presented in Table 7(column 5).
|
Component |
Retention time |
Peak area |
Height |
Units |
%Composition |
|
CH4 |
0.636 |
5974.36 |
94.337 |
Ppm |
63.19665 |
|
CO2 |
7.26 |
2321.61 |
64.048 |
Ppm |
16.77861 |
|
Ethanol |
10.82 |
3370.34 |
95.062 |
Ppm |
4.35793 |
|
Methanol |
16.45 |
2260.15 |
62.738 |
Ppm |
16.33446 |
Table 7: Analysis of Biogas obtained from the collecting unit for PCS digestion system.
It is observable in Table 7, that the recovered biogas contained high quantity of methane (approx. 63.2%) by weight. The presence of some other elements such as ethanol, carbon dioxide, ethanol and methanol were also found. Furthermore, the purification units attached to the bio-digesters (C, D, E in Figure 1) were designed to remove CO2, H2S and water vapor from the biogas through gas absorption [46]. However, from Table 7, it could be observed that the recovered product contains 16.77% of CO2 and other trace components (ethanol and methanol). There was no trace of hydrogen sulphide and water vapor. Hence, it could infer that in the present study, the purification method applied achieved total removal of hydrogen sulphide and water vapor but was not sufficient for total removal of carbondioxide.
The recovered biogas can be classified as relatively high-quality biogas [66], due to the percentage of methane. Except carbon-dioxide, all the trace components present in the recovered biogas are flammable. Hence, the recovered biogas can burn effectively.
3.6 Thermodynamics analysis of biogas production
The thermodynamic parameters (mass fractions, specific gas constant, specific heats, ratio of the specific heats, internal energy, and enthalpy) of the biogas production process were calculated using Equations 1 to 10 in Table 2. The mass in mixture (mass of component in biogas), mass fractions (ma, Equation 1), specific gas constant (Ri, Equation 5), components specific heats (Cpi and Cvi, Equation 7and 8), ratio of the specific heats ()(Equation 5), internal heat (Equation 9) and enthalpy (Equation 10) of the components of the recovered biogas are presented in Table 8.
Table 8: Mass fractions of various component of biogas.
MW.C: molecular weight of components, MW: molecular weight of the recovered biogas (mf*MW.C), γ: adiabatic index
From Table 8, methane gas (CH4(g)) has the highest mole fraction, specific heat at constant volume (Cv) and constant pressure (Cp) of 0.636 ,1.338 KJ/KgK and 1.78 KJ/KgK, respectively compared with other components of the biogas. [46] reported a similar observation for biogas generation from Cattle, Pig and Poultry manure mixture. Specific heat of methane forms majorly the specific heat of the biogas and is important in estimating the calorific value of the biogas desired to be used as energy source [36, 40]. A biogas with methane content of Cv and Cp of 1.338 KJ/KgK and 1.78 KJ/KgK, would require less energy to initiate burning in combustion engines [46]. The Polyatomic or diatomic nature of the recovered biogas was evaluated with the use of the adiabatic index (γ) (Equation 6). Adiabatic index is the ratio of specific heat at constant pressure to the specific heat at constant volume. This index commonly called gamma, reflects the effect of heat flow to the change in internal energy [51, 58]. It is an arbitrary constant, i.e., it has no physical impact and is not a representation of a physical quantity but just a ratio. For polyatomic gases, γ is while for diatomic gases γ 1.4 [67, 68]. In this present study, the values of γ for the recovered components of the biogas are 1.29. This inferred that the biogas recovered is composed of polyatomic gases.
The molecular weight (MW) of the recovered biogas was calculated based on the mole fraction and the molecular weight of the components (. The biogas has molecular weight of 25.1167 g/mol. Table 8, shows the biogas heat capacities at constant pressure (Cp) and constant volume (Cv) obtained using Equations 3 and 4. The overall biogas heat capacities estimated based on the components specific heat capacities were obtained as 1.689 KJ/KgK and 2.250 KJ/KgK,
The specific internal energy (u) and enthalpy (h) of biogas recovered after the purification process was calculated based on Equation 9 and 10, respectively. The specific internal energy and the enthalpy of the generated biogas can also be seen in Table 8. The specific internal energy defined the inherent energy of the recovered biogas while the enthalpy quantifies the heat that will be recovered by burning one kilogram (1kg) of the recovered biogas. In this present study, the specific internal heat, and the enthalpy of the recovered biogas at 37oC were 417.558 KJ/Kg and 624.14KJ/Kg, respectively. A similar observation was reported by [46].
The thermodynamic parameters: Gibbs free energy (ΔG), enthalpy (ΔH) and entropy(ΔS) of the digestion process estimated with respect to temperature based on Eyring-polyanyi equation (Equations 10, 11 and 12), are presented in Table 9. The rate constant (0.19) used for the thermodynamic parameters estimation was obtained from the kinetic model parameters of the best kinetic model that described the present biogas production data (logistic kinetic model), however not reported in detail.
|
T(K) |
ΔGo |
ΔHo |
ΔSo |
|
297.8 |
-7.68E+04 |
||
|
299.7 |
-7.73E+04 |
||
|
300.9 |
-7.76E+04 |
||
|
302.5 |
-7.80E+04 |
||
|
309 |
-7.98E+04 |
259.1136 |
8.61E+03 |
|
306 |
-7.90E+04 |
||
|
303 |
-7.82E+04 |
||
|
303 |
-7.82E+04 |
||
|
302 |
-7.79E+04 |
Table 9: Thermodynamics parameters for biogas production process.
Table 9 shows that the ΔGo was negative while ΔHo and ΔSo were both positive. The negative values of ΔGo depict that the biogas production reaction is feasible and spontaneous. Also, it is observable in Table 9 that ΔGo decreases negatively with temperature, suggesting that increase in temperature within the biogas production systems favors the process spontaneity. Positive value of ΔHo infers that the biogas production process was endothermic in nature, while the positive value of ΔSo revealed that the process is entropy driven in support of the endothermic nature of the digestion process. Also, the positive value of ΔHo is an indication that the biogas production process will yield better result with addition of external source of heat to the system, which may be achieved by operating above the mesophilic condition.
3.6 Energy Content of the recovered Biogas:
The useful part of the energy of biogas is the calorific value of its CH4 content [68]. The other components have energy content also, but they do not participate in a combustion process [68]. Calorific value is the amount of heat produced by the combustion of a fuel mass and is typically expressed in joules per kilogram. Biogas with methane content above 40% and calorific value above 18000KJ/m3 can be used for power generation in internal combustion engines [69]. Table 10 shows the energy parameters or the combustion properties of the recovered biogas.
|
PCS |
|
|
VCH4 (ml) |
170 |
|
VTotal (ml) |
251.8 |
|
Density CH4 at amb. Temp(Kg/m3) |
0.65 |
|
Reference UCV(kJ/Kg)Hun |
55568.1 |
|
Reference LCV(kJ/m3) |
50050.9 |
|
Biogas UCV (calculated)(kJ/m3) |
24385.5 |
|
Biogas LCV (calculated) (kJ/m3) |
21964.3 |
|
LHV (kJ/m3) |
2421.2 |
|
UW (kJ/m3) |
30246.5 |
|
LW(kJ/m3) |
27243.4 |
|
TLL(K) |
813.119 |
Table 10: Combustion properties of the recovered biogas.
VCH4: Volume of methane recovered; VTotal: Total volume of biogas; UCV: Upper calorific value; LCV: Lower calorific value; LHV: Latent heat of vaporization; UW: Upper wobbe index; LW: Lower wobbe index; TLL: Adiabatic flame temperature
From Table 10, the upper calorific value (UCV) at standard conditions (STP) of 24385.54 kJ/m3 was obtained at ambient temperature. The calorific values of this magnitude (24385.54 kJ/m2) indicates that the biogas recovered meets the desired condition for use in internal combustion engines [70]. However, UCV makes no allowance for the latent heat required to vaporize the liquid water produced by the combustion process. Hence it is a theoretical parameter and is rarely used [71]. To account for the latent heat of vaporization, the lower calorific value (LCV) was estimated. The biogas LCV is the actual heat available for work. From Table 10, the lower calorific values (LCV) were obtained as 21964.34 kJ/m3. The latent heat of vaporization (LHV) is the difference between UCV and LCV. It accounts for the heat soaked up due to evaporation of water during combustion in an internal combustion engine [34]. This quantity of heat (LHV) is temporarily lost and therefore does not contribute to the work done by the combustion process. The LHV was obtained as 2421.202 kJ/m3. Hence, it could be inferred that 11.02% of the total thermal energy available to do work by combustion of the recovered biogas will be lost as a result of formation and vaporization of water in the combustion chamber. The adiabatic flame temperature of the recovered biogas estimated using Equation 19 was found to be 813.1189K. This is the temperature that will result from complete combustion of the biogas without any work, heat transfer or changes in kinetic or potential energy. The ratio of either the upper or the lower calorific power and the square root of its relative density (The Wobbe’s Index (W)) is an indicator of the interchangeability of fuel gases such as natural gas, liquefied petroleum gas (LPG), and town gas. It is used in comparing the combustion energy output of different composition of fuel gases in an appliance. If two fuels have identical Wobbe Indices, then for a given pressure and valve settings, the energy output will also be identical. Pure methane has a Wobbe number of 50771.75; natural gas as piped to homes in the United States typically has upper Wobbe number between 48797.5 and 51777.5 [72]. Based on this standard, it could be observed that the upper Wobbe’s index of the biogas produced (between 36621.9 - 30246.54) estimated using Equation 16 fall within the acceptable standard Wobbe’s number (≤ 48797.5 - 51777.5) [73].
4. Conclusion
Paint wastewater treatment, sludge recovery and conversion to biogas was successfully achieved via coaguation and anaerobic digestion. The thermodynamics of the biogas production process shows that the process was spontenoius while the energy content studies inicate that the energy parameters of the recovered biogas falls within the acceptable standard. Generally, the following conclusion can be drawn from this work:
- Helix potemia shell coagulant (HPSC) was successfully extracted from waste helix potemia shells(HPS).
- The extracted HPSC achieved significant reduction (> 90%) in total solid content of paint wastewater.
- The post treatment sludge(PCS) successfuly recovered and subjected to anaerobic digestion yield biogas with 62% of methane by weight.
- The thermodynamics properties of the biogas production process show that the process was feasible and spontenous
- The energy content parameters of the recovered biogas fall within the standard of natural gases suitable for combustion.
Declaration of interest
The authors wish to declare that they have no conflicting interest.
Funding
The research work was funded by the authors.
Authors Contributions
Ejimofor, M.I and Ezemagu, I. G conceived the work and carried out the experiments; Menkiti, M.C supervised the research work.
References
- Nadakavukaren A, Caravanos Our global environment: A health perspective. Waveland Press (2020).
- Commoner The closing circle: nature, man, and technology. Courier Dover Publications (2020).
- Pandey VP, Dhaubanjar S, Bharati, L, et Spatio-temporal distribution of water availability in Karnali- Mohana Basin, Western Nepal: Climate change impact assessment (Part-B). Journal of Hydrology: Regional Studies (2020): 100691.
- Jagaba AH, Kutty SRM, Hayder G, et Water quality hazard assessment for hand dug wells in Rafin Zurfi, Bauchi State, Nigeria. Ain Shams Engineering Journal (2020).
- Menkiti MC, Ejimofor Experimental and artificial neural network application on the optimization of paint effluent (PE) coagulation using novel Achatinoidea shell extract (ASE). Journal of Water Process Engineering 10 (2016): 172-187.
- Garg S, Kumar P, Singh S, et Prosopis juliflora peroxidases for phenol remediation from industrial wastewater–An innovative practice for environmental sustainability. Environmental Technology & Innovation (2020): 100865.
- Salihoglu G, Salihoglu, A review on paint sludge from automotive industries: Generation, characteristics, and management. Journal of environmental management, 169 (2016): 223-235.
- Mrayyan B, Hamdi Management approaches to integrated solid waste in industrialized zones in Jordan: A case of Zarqa City. Waste Management 26 (2006): 195-205.
- Menkiti MC, Ejimofor MI, Ezemagu IG, et Turbid-metric approach on the study of adsorptive component of paint effluent coagulation using snail shell extract. Arabian Journal for Science and Engineering, 41 (2016): 2527-2543.
- Olajire The brewing industry and environmental challenges. Journal of Cleaner Production, 256 (2020): 102817.
- Sabri NA, Schmitt H, Van der Zaan B, et Prevalence of antibiotics and antibiotic resistance genes in a wastewater effluent-receiving river in the Netherlands. Journal of Environmental Chemical Engineering, 8 (2020):102245.
- Cheah WY, Sankaran R, Show PL, et al. Pretreatment methods for lignocellulosic biofuels production: current advances, challenges, and future prospects. Biofuel Research Journal 7 (2020): 1115.
- Ejimofor MI, Ezemagu IG, Menkiti M C. Biogas production using coagulation sludge obtained from paint wastewater decontamination: Characterization and anaerobic digestion kinetics. Current Research in Green and Sustainable Chemistry 3 (2020): 100024.
- Balik ÖY, Aydin Coagulation/flocculation optimization and sludge production for pre-treatment of paint industry wastewater. Desalination and Water Treatment 57 (2016): 12692-12699.
- Zhang R, Yang Y, Huang CH, et Kinetics and modeling of sulfonamide antibiotic degradation in wastewater and human urine by UV/H2O2 and UV/PDS. Water research 103 (2016): 283-292.
- Haq I, Raj Pulp and Paper Mill Wastewater: Ecotoxicological Effects and Bioremediation Approaches for Environmental Safety. In Bioremediation of Industrial Waste for Environmental Safety (2020): (pp. 333-356).
- Etteieb S, Magdouli S, Zolfaghari M, et Monitoring and analysis of selenium as an emerging contaminant in mining industry: A critical review. Science of the Total Environment 698 (2020): 134339.
- Pan Y, Ni BJ, Bond PL, et Electron competition among nitrogen oxides reduction during methanol-utilizing denitrification in wastewater treatment. Water research 47 (2013): 3273-3281.
- Fakayode Impact assessment of industrial effluent on water quality of the receiving Alaro River in Ibadan, Nigeria. African Journal of Environmental Assessment and Management 10 (2005): 1-13.
- Ahmad K, Wajid K, Khan ZI, et Evaluation of potential toxic metals accumulation in wheat irrigated with wastewater. Bulletin of environmental contamination and toxicology 10 (2019): 822-828.
- Mahmood T, Elliott Activated sludge process modification for sludge yield reduction using pulp and paper wastewater. Journal of Environmental Engineering 132 (2006): 1019-1027.
- Barbosa AD, da Silva LF, De Paula HM, et Combined use of coagulation (M. oleifera) and electrochemical techniques in the treatment of industrial paint wastewater for reuse and/or disposal. Water research 145 (2018): 153-161.
- Kakoi B, Kaluli JW, Ndiba P, et Optimization of Maerua Decumbent bio-coagulant in paint industry wastewater treatment with response surface methodology. Journal of Cleaner Production, 164 (2017): 1124- 1134.
- da Silva LF, Barbosa AD, de Paula HM, et Treatment of paint manufacturing wastewater by coagulation/electrochemical methods: proposals for disposal and/or reuse of treated water. Water research 101 (2016): 467-475.
- El-Dars FMSE, Ibrahim MA, Gabr Reduction of COD in water-based paint wastewater using three types of activated carbon. Desalination and water treatment 52 (2014): 2975-2986.
- Dovletoglou O, Philippopoulos C, Grigoropoulou Coagulation for treatment of paint industry wastewater. J. Environ. Sci. Heal. Part.A 37 (2002): 1361–1377.
- Myers Surfactant science and technology. John Wiley & Sons (2020).
- Yuan W, Zhu B, Li XY, et Visualizing H2O molecules reacting at TiO2 active sites with transmission electron microscopy. Science 367 (2020): 428-430.
- Horikoshi S, Serpone Can the photocatalyst TiO2 be incorporated into a wastewater treatment method? Background and prospects. Catalysis Today 340 (2020): 334-346.
- El-Sawy AM, King’ondu CK, Kuo CH, et X-ray absorption spectroscopic study of a highly thermally stable manganese oxide octahedral molecular sieve (OMS-2) with high oxygen reduction reaction activity. Chemistry of Materials 26 (2014): 5752-5760.
- Kamaruddin MA, Yusoff MS, Rui LM, et An overview of municipal solid waste management and landfill leachate treatment: Malaysia and Asian perspectives. Environmental Science and Pollution Research 24 (2017): 26988-27020.
- Foo KY, Hameed An overview of landfill leachate treatment via activated carbon adsorption process. Journal of hazardous materials 171 (2009): 54-60.
- Jones The metamorphism of dumps into hills. In Proceedings of the First International Seminar on the Management of Rock Dumps, Stockpiles and Heap Leach Pads Australian Centre for Geomechanics (2008): (pp. 267-275).
- Bhatia S, Othman Z, Ahmad Pretreatment of palm oil mill effluent (POME) using Moringa oleifera seeds as natural coagulant. Journal of Hazardous Materials 145 (2007):120-126.
- Ezemagu IG, Ejimofor MI, Menkiti MC. Thermodynamic studies of anaerobic digestion of post coagulation sludge from petroleum produced water and cow dung. Current Research in Green and Sustainable Chemistry 3 (2020): 100037.
- Mosaddeghi MR, Pajoum Shariati F, Vaziri Yazdi SA, et Application of response surface methodology (RSM) for optimizing coagulation process of paper recycling wastewater using Ocimum basilicum. Environmental technology 41 (2020): 100-108.
- Choy SY, Prasad KMN, Wu TY, et Utilization of plant-based natural coagulants as future alternatives towards sustainable water clarification. Journal of environmental sciences 26 (2014): 2178-2189.
- Thrän D, Schaubach K, Majer S, et Governance of sustainability in the German biogas sector—Adaptive management of the Renewable Energy Act between agriculture and the energy sector. Energy, Sustainability and Society 10 (2020): 3.
- Lie Synthesis, performance, and regeneration of carbon membranes for biogas upgrading—a future energy carrier. Department of Chemical Engineering Norwegian University of Science and technology, Trondheim (2005).
- Menkiti MC, Ezemagu IG, Nwoye CI, et al. post-treatment sludge analyses and purification of paint effluent by coag-flocculation method. International Journal of Energy and Environmental Engineering7 (2016): 69-83.
- Jain MS, Kalamdhad A review on management of Hydrilla verticillata and its utilization as potential nitrogen-rich biomass for compost or biogas production. Bioresource Technology Reports 1 (2018): 69-78.
- Song Z, Yang G, Guo Y, et Comparison of two chemical pretreatments of rice straw for biogas production by anaerobic digestion. BioResources 7 (2012): 3223-3236.
- Thiex, N. (2009). Evaluation of analytical methods for the determination of moisture, crude protein, crude fat, and crude fiber in distillers dried grains with solubles. Journal of AOAC international, 92(1), 61-73.
- Barbir F, Veziroglu TN, Plass Jr Environmental damage due to fossil fuels use. International journal of hydrogen energy 15 (1990): 739-749.
- Ojikutu Abimbola O and Osokoya Olumide Evaluation of Biogas Production from Food Waste. The International Journal of Engineering and Science (IJES) 3 (2014): 1-7.
- Aworanti OA, Agarry SE, Ogunleye Bio methanization of the mixture of cattle manure, pig manure and poultry manure in co-digestion with waste peels of pineapple fruit and content of chicken-gizzard-part ii: Optimization of process variables. The Open Biotechnology Journal 11 (2017).
- Ejimofor MI, Ezemagu IG, Menkiti MC. Physiochemical, Instrumental and thermal characterization of the post coagulation sludge from paint industrial wastewater treatment. South African Journal of Chemical Engineering (2021).
- Rafique R, Poulsen TG, Nizami AS, et Effect of thermal, chemical, and thermo-chemical pre-treatments to enhance methane production. Energy 35 (2010): 4556-4561.
- Tippayawong N, & Thanompongchart Biogas quality upgrade by simultaneous removal of CO2 and H2S in a packed column reactor. Energy 35 (2010): 4531-4535.
- Villandier N, & Corma Transformation of cellulose into biodegradable alkyl glycosides by following two different chemical routes. ChemSusChem 4 (2011): 508-513.
- Elnahas HH, Abdou SM, El-Zahed H, et Structural, morphological, and mechanical properties of gamma irradiated low density polyethylene/paraffin wax blends. Radiation Physics and Chemistry 151(2018): 217-224.
- Rafiqi FA, Rather MS, Majid Doping polyaniline with copper bisglycinate [Cu (gly) 2]—Synthesis, characterization, and thermal study. Synthetic metals 171(2013): 32-38.
- Anderoglu Residual stress measurement using X-ray diffraction (Doctoral dissertation, Texas A&M University) (2005).
- Vidhya Anaerobic digestion of food waste in a horizontal plug flow reactor (doctoral dissertation, birla institute of technology & science). (2013).
- Stolze Y, Zakrzewski M, Maus I, et Comparative metagenomics of biogas-producing microbial communities from production-scale biogas plants operating under wet or dry fermentation conditions. Biotechnology for biofuels 8 (2015): 1-18.
- Ofoefule AU, Onyeoziri MC, Uzodinma Comparative study of biogas production from chemically treated powdered and un-powdered rice husks. Journal of Environmental Chemistry and Ecotoxicology 3 (2011): 75- 79.
- Raposo F, De la Rubia MA, Borja R, et al. Assessment of a modified and optimised method for determining chemical oxygen demand of solid substrates and solutions with high suspended solid content. Talanta 76 (2008): 448-453.
- Dahunsi SO, & Oranusi Co-digestion of food waste and human excreta for biogas production. Biotechnology Journal International (2013): 485-499.
- Ngumah CC, Ogbulie JN, Orji JC, et Biogas potential of organic waste in Nigeria. Journal of Urban and Environmental Engineering 7 (2013): 110-116.
- Laskri N, Hamdaoui O, Nedjah Anaerobic digestion of waste organic matter and biogas production. Journal of Clean Energy Technologies 3 (2015).
- Yin C, Shen Y, Yu Y, et In-situ biogas upgrading by a stepwise addition of ash additives: Methanogen adaption and CO2 sequestration. Bioresource technology 282 (2019): 1-8.
- Deepanraj B, Sivasubramanian V, Jayaraj Kinetic study on the effect of temperature on biogas production using a lab scale batch reactor. Ecotoxicology and Environmental Safety 121 (2015): 100-104.
- Singh CS, Goel D, Singh AK, et Biogas Generation from Domestic Bio-waste: A Way to Fill Energy Gap. Journal of Biofuels 9 (2018): 124-132.
- Assmann C, Scott A, Biller Online total organic carbon (TOC) monitoring for water and wastewater treatment plants processes and operations optimization. Drinking Water Engineering & Science 10 (2017).
- Li J, Jha AK, He J, et Assessment of the effects of dry anaerobic co-digestion of cow dung with wastewater sludge on biogas yield and biodegradability. International journal of physical sciences 6 (2011): 3723-3732.
- Bareither CA, Wolfe GL, McMahon KD, et Microbial diversity, and dynamics during methane production from municipal solid waste. Waste management 33 (2013): 1982-1992.
- Grigor’yev YN, Yershov The linear stability of inviscid shear flow of a vibrationally excited diatomic gas. Journal of applied mathematics and mechanics 75 (2011): 410-418.
- Lafay Y, Taupin B, Martins G, et Experimental study of biogas combustion using a gas turbine configuration. Experiments in fluids 43 (2007): 395-410.
- Zamorano M, Perez J, Aguilar I, et Study of Energy potential of the Biogas produced by an urban waste landfill in southern Spain. Renewable & Sustainable Energy Reviews 11 (2007): 909-922.
- Cacua K, Amell A, Olmos A comparative study of the com-combustion properties of normal bio-bustion biogas gas gas-air mixture and oxygen oxygen-enriched biogas biogas-air. Ingenieria e investigación 31 (2011): 233-241.
- DESIDERI U, Leonardi D, Proietti Application of infrared thermography to study behaviour of biogas captation wells (2007).
- Driftmeier U.S. Patent No. 6,539,775. Washington, DC: U.S. Patent and Trademark Office (2003).
- Pannucharoenwong N, Worasaen A, Benjapiyaporn C, et Comparison of bio-methane gas wobbe index in different animal manure substrate. Energy Procedia 138 (2017): 273-277.



 Impact Factor: * 4.1
 Acceptance Rate: 75.32%
  Time to first decision: 10.4 days
  Time from article received to acceptance: 2-3 weeks