RAPD and ISSR Banding Pattern of Alpinia Galanga Populations from Eastern India
Reena Parida and Sanghamitra Nayak
Centre for Biotechnology, SPS, Siksha ‘O’ Anusandhan University, Bhubaneswar, Odisha, India.
*Corresponding Author: Reena Parida, Centre for Biotechnology, SPS, Siksha ‘O’ Anusandhan University, Bhubaneswar, Odisha, India
Received: 24th Jan-2019; Revised: 20th Mar-2019; Accepted: 26th Feb-2019
Copyright: ©2019 Reena Parida. This is an open-access article distributed under the terms of the Creative Commons Attribution License , which permits unrestricted use, distribution, and reproduction in any medium, provided the original author and source are credited
Article Information
Citation: Reena Parida and Sanghamitra Nayak. RAPD and ISSR Banding Pattern of Alpinia Galanga Populations from Eastern India. International Journal of Plant, Animal and Environmental Sciences 9 (2019): 1-5.
View / Download Pdf Share at FacebookAbstract
India is very well known for presence of medicinal aromatic plants for treatment of various diseases which are day by day diminishing from the nature. This requires an urgent need for conservation of germplasm of those high yielding varieties which arises to help in various ways to the pharmaceutical, cosmetic as well as other industries. So also their genetic study is very much essential in order to explore their molecular structure. The present study was undertaken to characterize Alpinia galanga collected from four different populations of Odisha using two molecular markers as Random Amplified Polymorphic DNA and Inter Simple Sequence Repeats. Further a dendrogram was constructed through sequential agglomerative hierarchical and nested clustering, unweighted pair group method with arithmetic mean analysis and Jaccard’s similarity coefficient of combined markers which segregated these genotypes into two main clusters moreover showing the genetic similarity between the germplasm. Hence, the molecular analysis could be further used for identification of important novel gene present in Alpinia galanga which can be utilized for future crop improvement.
Keywords
<p>Alpinia galanga, Polymerase Chain Reaction, Random Amplified Polymorphic DNA, Inter Simple Sequence Repeats</p>
Article Details
INTRODUCTION
Alpinia galanga an aromatic rhizomatous herb belonging to Zingiberaceae is cultivated in India and China [1]. The plant can grow upto 10 feet high, rhizomes in clumps, with abundant leaves and is commonly known as blue ginger or greater galangal. The plant has leaves that are lance-shaped, 30-60cm long and 10-15cm broad with fringed borders and reedy stems along with thick fragrant rootstocks. The raw rhizome is a popular ingredient used in many Indonesian and Malaysian dishes for its ginger like flavour. The rhizomes of A.galanga smell as cardamom so mainly used for flavouring food as well as condiment with medicinal properties. The rhizome is used to treat arthritis, ulcer, whooping colds in children, fever, vomiting etc. The rhizomes have antimicrobial, antioxidant, antiulcer, anti-inflammatory, antitumour, cytotoxic, anti-spasmodic, anti-hepatotoxic, anti depressant and mosquito repellant activities [2-8]. Besides its vast importance there are very few reports available on its genetic study for which the present work has been reported from the eastern ghats.
MATERIALS AND METHODS
Plant material and molecular analysis
For the present study, Alpinia galanga were collected from the wild habitats of Koraput, Phulabani, Raikia and G.Udaigiri populations and were maintained in the medicinal garden of Centre for Biotechnology, Siksha ‘O’ Anusandhan University, Bhubaneswar, Odisha. DNA was isolated by the standard protocol followed by polymerase chain reaction (PCR) reaction as Random Amplified Polymorphic DNA (RAPD) and Inter simple sequence repeat (ISSR) following the reported standard protocol [9-11].
For RAPD random decamer Operon Primers (Operon Tech., Alameda, USA) were dissolved in double sterilized T10E1 buffer, pH 8.0 to the working concentration of 15 ng/ml. RAPD primers as per the amplified pattern from A, C, D, N and AF series namely OPA04, OPA07, OPA09, OPA18, OPC02, OPC05, OPC011, OPD03, OPD07, OPD08, OPD12, OPD18, OPD20, OPN04, OPN16, OPN18, AF5, AF14 and AF15 were used. Similarly ISSR primers namely (GAC)5, (GTGC)4, (GACA)4, (AGG)6, (GA)9T, T(GA)9, (GTG)5, (GGA)4 and (CAA)5 (Bangalore Genei Pvt. Ltd, Bangalore, India) were used. After PCR reaction, 2.5 ml of 6X loading dye (MBI Fermentas, Lithuania) was added to the amplified products and separated in 1.5-2% agarose gel with ethidium bromide. The electrophoresis was performed for 3 hours at 60 volt and visualized under UV-transilluminator (BioRad, USA) and photographed using Gel Documenting System (Bio-Rad, USA) for scoring the bands [12]. The sizes of the amplicons were determined by comparing them with that of the DNA ladder and were repeated at twice to confirm the reproducibility patterns.
Statistical analysis
Resolving power (Rp) of the primers were calculated [13]. Resolving power is: Rp=SIB (IB (Band informativeness) = 1-[2´(0.5-P)], P is the proportion of the species containing the band. The Primer Index (PI) was calculated from the polymorphic index. A polymorphic index (PIC) was calculated as PIC = 1-åP2i, Pi is the band frequency of the ith allele [14]. In the case of RAPDs and ISSRs, the PIC was considered to be 1-p2-q2, where p is band frequency and q is no band frequency [15]. The PIC value was then used to calculate the primer index (PI). PI is the sum of the PIC of all the markers amplified by the same primer.
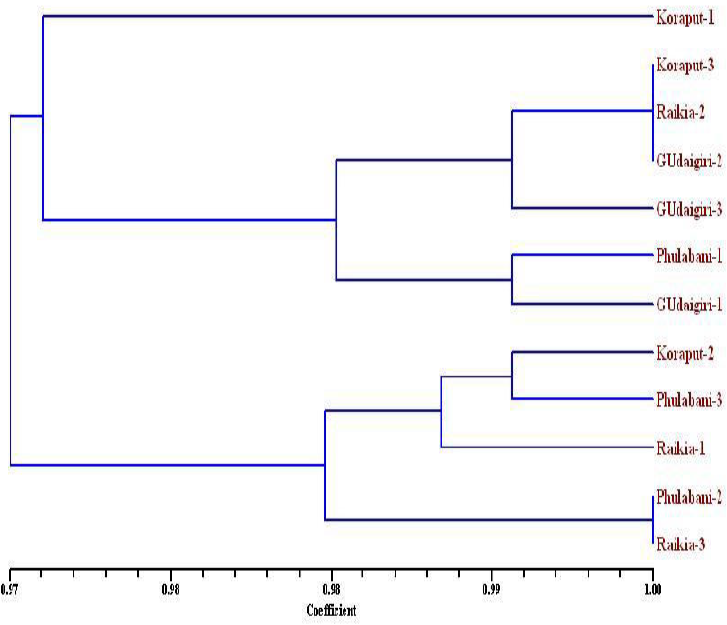
Jaccard’s coefficient of similarity was measured and a phylogram based on similarity coefficients was generated by unweighted pair group method using arithmetic averages (UPGMA) and the SAHN (Sequential Agglomerative Hierarchical and nested) clustering was obtained [16, 17]. The entire analysis was performed using the statistical package NTSYS-pc 2.02e [18]. In addition to the classical resampling methods the statistical testing of robustness of the obtained trees, such as bootstrapping was implemented. This test has been created to give a possibility of having more distances with the same values. In such case, the order of taxa influences the result of the tree building. Rearrangement of taxa can reveal this situation.
RESULTS
RAPD and ISSR analysis
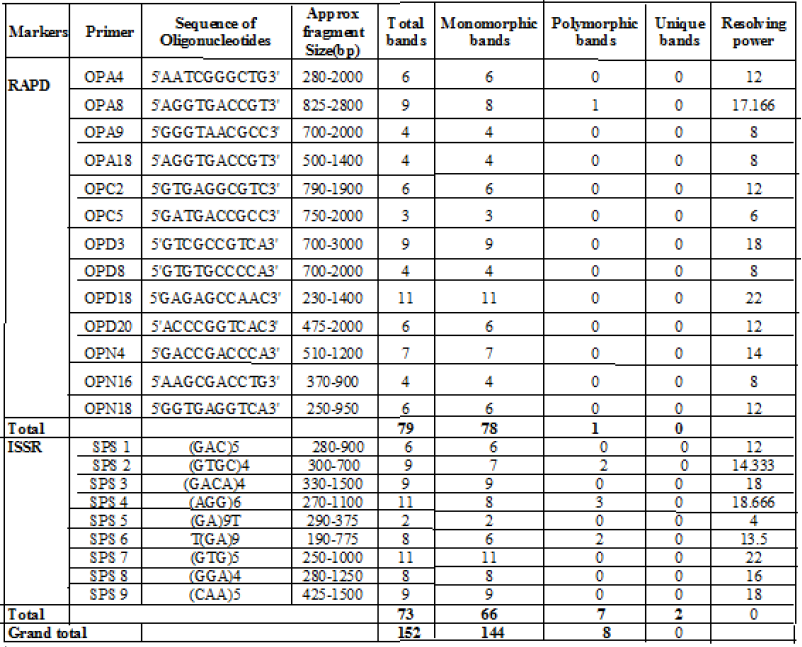
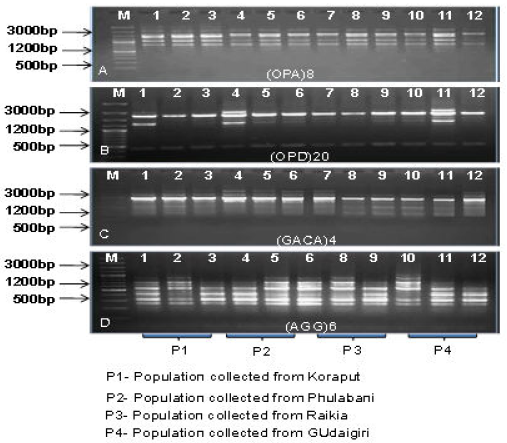
The DNA profiles as obtained by RAPD markers were represented in Table-1 (Fig. 1 A, B). A total of 79 bands were amplified, 78 bands were found to be monomorphic and only 1 was polymorphic in nature. The highest number of bands (11) were amplified with primer OPD18 (230-1400bp) and lowest number of band (3) was amplified with primer OPC5 (750-2000bp). No unique bands were found with all the primers. Average number of bands per primer was found to be 6.1. The resolving power of the primers were varied from 6-22 where the primer with maximum resolution power was OPD18 (22) and the primer with minimum resolution power was OPC5 (6).
The DNA profiles as obtained by ISSR markers were represented in Table-1 (Fig. 1 C, D). A total of 73 bands produced, 66 were monomorphic, 5 were polymorphic and 2 were found to be unique bands. The primer (AGG)6 and (GTG)5 produced maximum number of bands(11), while primer (GA9)T produced minimum number of bands (2). The bands were amplified in the range of 190-1700bp. Among these ISSR primers, maximum resolving power (22) was obtained in (GTG)5 primer and minimum Rp (4) was in (GA9)T.
Analysis of data of combined markers
A total of 152 bands were amplified with all the marker out of which 144 were monomorphic, 6 were polymorphic and rest 2 were unique bands (Table-1). All the samples were correlated with each other with an average similarity of 0.976 which ranged between 0.961 to 1.000. The dendrogram constructed using Jaccard’s similarity coefficient, separated the 4 populations into two major clusters, one with 7 samples another with rest 5 samples at similarity coefficient of 0.97 (Fig. 2). Each cluster was again subdivided into two sub clusters of which one sub cluster contain single sample being separated from rest of all 2 sub clusters. Cluster I included 7 replicates i.e., 3 from G.Udaygiri, 2 replicate populations from Koraput, one each from Raikia and Phulabani and Cluster II includes 5 replicates i.e., 2 replicates each from Phulabani populations and Raikia populations and one replicate population from Koraput.

Table 1: Details of RAPD, ISSR and combined marker analysis as revealed among four populations of Alpinia galanga
DISCUSSION
Thirty-seven galanga (Alpinia spp.) accessions, 31 cultivated and 6 wild landraces from different areas in Thailand were evaluated for genetic diversity, using random amplified polymorphic DNA (RAPD) primers are reported. In their study Out of 22 random primers used only 8 primers produced a total of 73 polymorphic bands. UPGMA cluster analysis of genetic similarity estimates (Jaccard’s coefficient) separated the accessions into 5 major clusters. The dendrogram showed no relation with their morphological characters such as type, color of rhizome and collection sites which were indicated by the regions of Thailand [19]. There are other studies of genetic diversity using ISSR markers [20, 21]. However, this study illustrated that both RAPD and ISSR analysis could be a useful tool to evaluate genetic diversity in galanga accessions. The highly informative primers identified in this study would be available for further genetic analysis of A. galanga for plant selection and improvement.
CONCLUSION
Moreover identification of Zingiberaceous taxa through herbarium is very difficult because of problem in preserving thick and fleshy rhizomes. The precise characterization of genetic diversity that exists in available germplasm of different species using molecular markers is one step forward providing accurate genetic information for future breeding programme for improvement of the desired taxa. The present report based on molecular markers was done to characterize genetically different populations in Alpinia species. This phylogenetic study could be valuable for species identification of A. galanga as being reported for the first time in this genus from eastern India. The resources could also be used as a healthy plant material for supply to industries for commercial exploitation.
ACKNOWLEDGEMENTS
The authors are grateful to Prof (Dr.) M.R. Nayak, President and Prof (Dr.) S.C. Si, Dean, Centre for Biotechnology, Siksha ‘O’ Anusandhan University for providing facilities and encouraging throughout.
REFERENCES
- Jatoi SA, Kikuchi A, Yi SS, Naing KW, Yamanka S, Wataanbe JA and Watanabe KN 2006. Use of rice SSR markers as RAPD markers for genetic diversity analysis in Zingiberaceae. Breeding Sci, 56: 107-111.
- Itokawa H, Morita H, Sumitomo T, Totsuka N and Takeya K 1987. Antitumor principles from Alpinia galangal. Planta Med., 53: 32-33.
- Yahya MA, Rafatullah S, Mossa JS, Ageel AM, Said MS and Tariq M 1990. Gastric antisecretory, antiulcer and cytoprotective properties of ethanolic extract of Alpinia galanga Willd in rats. Phytotherapy Res, 4: 112-114.
- Zaeoung S, Plubrukarn A and Keawpradub N 2005. Cytotoxic and free radical scavenging activities of Zingiberaceous rhizomes. Songklanakarin J Sci Technol, 27: 799-812.
- Matsuda H, Morikawa T, Ohgushi T, Ishiwada T, Nishida N and Yoshikawa M 2005. Chem Pharm Bull, 53: 387-392.
- Jirawan O and Tomoko S 2006. Antimicrobial properties and action of galangal (Alpinia galanga) on Staphyloccus aureus. LWT- Food and Sci Technol, 39: 1214-1220.
- Tawatsin A, Asavadachanukorn P, Thavara U, Wongsinkongman P, Bansidhi J, Boonruad T, Chavalittumrong P, Soonthornchareonnon N, Komalamisra N and Mulla MS 2006. Repellency of essential oils extracted from plants in Thailand against four mosquito vectors (Diptera: Culicidae) and oviposition deterrent effects against Aedes aegypti (Diptera : Culicidae), 37: 915-931.
- Tachakittirungrod S, Okonogi S and Chowwanapoonpohn S 2007. Study on antioxidant activity of certain plants in Thailand: Mechanism of antioxidant action of guava leaf extract. Food Chem, 103: 381-398.
- Doyle JJ and Doyle JL 1990. A rapid DNA isolation procedure for small quantities of fresh leaf tissue. Phytochem Bull, 19: 11-15.
- Williams JGK, Kubelik AR, Liva KJ, Rafalski JA, Tingey SV 1990. DNA polymorphisms amplified by arbitrary primers are useful as genetic markers. Nucl Acid Res, 18: 6531-6535.
- Zeitkiewicz E, Rafalski A and Labuda D 1994. Genome finger printing by simple sequence repeat (SSR)-anchored PCR amplification. Genomics, 20: 176-183.
- Gherardi M, Mangin B, Goffinet B, Bonnet D and Huguet T 1988. A method to measure genetic distance between allogamous populations of alfalfa (Medicago sativa) using RAPD molecular markers. Theor Appl Genet, 96: 406-412.
- Prevost A and Wilkins MJ 1999. A new system for comparing PCR primers applied to ISSR fingerprinting of potato cultivars. Theor Appl Genet, 98: 661-668.
- Smith JSC, Chin ECL, Shu H, Smith OS, Wall SJ, Senior ML, Mitchell SE, Kresovich S and Ziegle J 1997. An evaluation of the utility of SSR loci as molecular markers in maize (Zea mays): Comparison of data from RFLPs and pedigree. Theor Appl Genet, 95: 163-173.
- Ghislain M, Zhang D, Fazardo D, Huamann Z and Hismans RH 1999. Marker assisted sampling of the cultivated andean potato Solanum fureja collection using RAPD markers. Genetic Res Crop Evol, 46: 547-555.
- Jaccard P 1908. Nouvelles recherché sur Ia distribution florale. Bulletin de la Societe Vaudense des Scinses Naturelles, 44: 223-270.
- Sneath PHA and Sokal RR 1973. Numerical Taxonomy, Freeman, San Francisco, California, 573.
- Rohlf FJ 1997. NTSYS-pc Numerical Taxonomy and multivariate analysis system. Version 2.02e. Exeter Software, Setauket, New York.
- Saritnum O and Sruamsiri P 2003. Random amplified polymorphic DNA analysis of galanga (Alpinia spp.) accessions. CMU J, 3:159-164.
- Rajasekharan PE, Kareem VK, Ravish BS and Mini S 2016. Analysis of genetic diversity in Alpinia galanga using ISSR markers. Indian J Plant Genet Resour, 29: 194-198.
- Silvy M 2018. Molecular characterisation of Alpinia species from western ghats. Int J Curr Adv Res, 7: 1031-1035.


 Impact Factor: * 4.1
 Acceptance Rate: 75.32%
  Time to first decision: 10.4 days
  Time from article received to acceptance: 2-3 weeks