Relationship between Large amounts of Cryptomeria Japonica D. Don Pollen Dispersion and Cold Front Passage
Yuichi Takahashi1*, Shigeto Kawashima2, Yusuke Suzuki1 and Seiji Kakehata1
1Department of Otolaryngology, Head and Neck Surgery, Yamagata University Faculty of Medicine, Yamagata, Japan
2Graduate School of Agriculture, Kyoto University, Kyoto, Japan
*Corresponding Author: Yuichi Takahashi, Department of Otolaryngology, Head and Neck Surgery, Yamagata University Faculty of Medicine, Yamagata, Japan.
Received: 12 August 2022; Accepted: 27 September 2022; Published: 30 September 2022
Article Information
Citation: Yuichi Takahashi, Shigeto Kawashima, Yusuke Suzuki, Seiji Kakehata. Relationship between Large Amounts of Cryptomeria Japonica D. Don Pollen Dispersion and Cold Front Passage. International Journal of Plant, Animal and Environmental Sciences. 12 (2022): 134-137.
View / Download Pdf Share at FacebookKeywords
<p>Airborne pollen; Automatic pollen monitor; Cold front; Cryptomeria japonica; Pollen Robo</p>
Article Details
Recently, with the proliferation of automatic Cryptomeria japonica pollen monitors, it has become possible to obtain hourly data measured simultaneously from multiple locations. The KH-3000 monitor used by the Pollen Observation System of the Japanese Ministry of the Environment, “Hanako-san”, and the “Pollen Robo” monitor created by Weathernews Inc. were installed in various places in the Tohoku region for collection of simultaneous pollen count data, and the results indicated that the period of the day when large amounts of C. japonica pollen were dispersed may be related to the passage of a cold front extending from a low pressure system. Japanese cedar (Cryptomeria japonica D. Don) blooms and releases pollen during periods of rapid temperature increase. As a result, of the majority of C. japonica pollen disperses between the afternoon and late in the evening with little distribution from midnight to dawn. However, occasionally a large amount of pollen is observed even in inclement weather if the temperature is sufficiently high. Based on our C. japonica pollen dispersal data, it is evident that the amount of pollen increased each day as the warm sunny days continued, reaching a maximum amount immediately before extreme weather events. In such cases, a warm front often preceded the passing of the cold front. Our previous older studies showed a sharp increase in the amount of C. japonica pollen during warm and cold fronts, followed by a sharp decrease in the amount of pollen with rainfall after the cold front passed. This phenomenon was reported in the Yamagata Basin in Yamagata City, from hourly pollen data collected in a seven-day recording volumetric spore trap (Burkard Manufacturing Co., Ltd., hereinafter abbreviated as Burkard sampler) [1]. At that time, our aim was to understand the relationship between the time of passage of the front and the change in the amount of C. japonica pollen released over a wide area. Since such a study requires hourly data taken at multiple points simultaneously, it was challenging to use the conventional method of counting pollen under a microscope.
Currently, automatic C. japonica pollen monitors have become widespread in Japan, making it possible to retrieve hourly values from multiple locations simultaneously. In Japan, there are two main automatic C. japonica pollen observation networks, the one is “Hanako-san”;KH-3000 monitor and the other is “Pollen Robo”. We once verified the accuracy of the KH-3000 monitor using Burkard sampler which installed side by side, and the number of C. japonica pollen was calculated using a microscope. The results obtained by the two methods were in good agreement [2]. The details of the device are described by Kawashima et al. [3]. The advantage of “Pollen Robo” is the large number of measurement points in Japan, and about 1,000 monitors are installed nationwide every year during the C. japonica pollen season. Since the hourly values are computerized in real time, “Pollen Robo” users can see at a glance the hourly trends of C. japonica pollen in the place where they live. It has a mechanism to inhale the atmosphere equal to the amount of breathing of adults.
In this study, we first investigated the quantitative changes in pollen dispersal dynamics over time using the data from “Hanako-san,” followed by a determination of the relationship between the cold front passage and the amount of dispersion using “Pollen Robo” data. Meteorological data from the Automatic Meteorological Data Acquisition System (AMeDAS) is also available near the pollen measurement locations, and by using data obtained from this system near the “Pollen Robo” measurement point, it is possible to determine the time the front passed in each area.
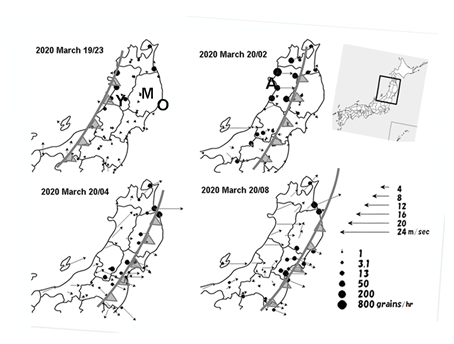
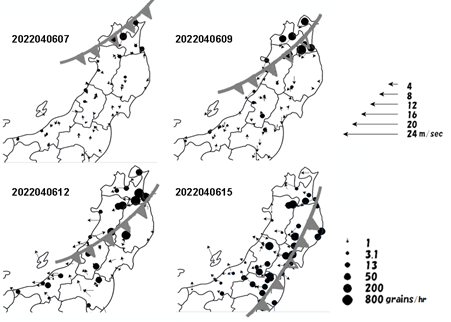
Our target area was the Tohoku region, which extends from north to south in the northern part of the Japanese archipelago (Figure 1 top right inset). “Pollen Robo” data in these areas were obtained from Weathernews Inc. We used the wind direction/velocity of the AMeDAS to determine the transit time of the front, obtained from the Japan Meteorological Agency website. The wind directions are shown by the 16 arrows, and the wind speeds are indicated by the length of each arrow. The passage time of the cold front is based on the change in wind direction, and the weather chart published by the Japan Meteorological Association is used as a reference.
The constant pollen dispersal period in the Tohoku region occurred from mid-March to early April. C. japonica pollen dissemination usually occurs between afternoon and late in the evening; however, the peaks were observed from midnight to dawn in March 19–20 in 2020. When the types of pollen dispersed on those days were examined under a microscope, most of them were C. japonica pollen. Looking at peak times for major cities using “Hanako-san”. The time when the most C. japonica pollen was dispersed was 01:00 on the March 20th in Akita City (A) on the Sea of Japan coast, 03:00 in Morioka City (M) and Yokote City (Y) in the inland area, and 05:00 in Ofunato City (O) on the Pacific Ocean coast (Figure 1, capital letter). Therefore, the pollen wave moved from the Sea of Japan side of the region to the Pacific Ocean side, coinciding with the passage of the front. During this period, there was a low pressure system in the western sea of Hokkaido, releasing a cold front that spread from north to south and extended along the Tohoku region. When then examined the data from “Pollen Robo,” and the results are presented in Figure 1. The pollen numbers change dramatically with the passage of the front, and they are shown as logarithmic values on the map. The position of the cold front is shown in gray symbols in the Figure 1 and 2. As is clear from the figure, many dispersal points moved from the Sea of Japan side to the Pacific Ocean side along the Japanese archipelago in 2020 (Figure 1). In 2022, the front passed through the northern part of the Tohoku region earlier than the southern region. Along with this, the area where a lot of C. japonica pollen was dispersed also moved from the northern part of the Tohoku region to the southern region. (Figure 2).
We examined the relationship between the time of frontal passage and the greatest pollen dispersal in 2020, and found that they were highly positive correlated (r = 0.8005, n = 52). The majority of the pollen was dispersed within two hours before or after the passing of the front; of the 52 points, 22 (42% [22/52]) were simultaneous, namely, the greatest dispersion of C. japonica pollen occurred at the same time as the front passed; and 90% (47/52) of cases were within two hours before or after the time of passage. The number of dispersions was high in the northern part of the Tohoku region close to the low pressure system at the end of the front and low in the southernmost part of the Tohoku region away from this system.
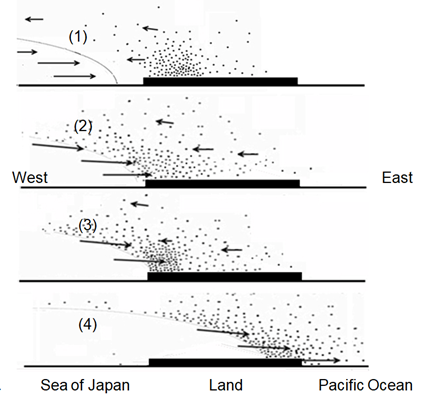
Figure 3 shows the possible mechanism of pollen concentration due to the passage of a cold front. It is speculated that a large amount of pollen was generated in areas where the temperature had risen by a passing warm front (1), and the generated pollen was carried by the cold front that followed (2), and pollen concentration occurs before and after the arrival of a cold front (3) and (4). We previously observed that pollen enrichment was affected by mountains [4]; therefore, we are interested in whether the passage of the cold front and the effect of the topography relate to the same mechanism, which will be considered in future studies.
The KH-3000 monitor and “Pollen Robo” count pollen utilizing the intensity of reflected light and cannot identify the pollen morphology. Therefore, it is not possible to differentiate pollen when many types of pollen are dispersed simultaneously, because particles with similar reflected light intensity (mainly particles of similar size) are grouped together. Fortunately, in Japan, C. japonica releases the majority of the airborne pollen in the first half of the C. japonica pollen season and in substantial quantities. In addition, the size of the pollen is larger than that of other suspended particles, so it could be possible to count only C. japonica pollen. Therefore, automatic pollen monitors those counts airborne pollen from the particle size are useful during the C. japonica pollen season. Various automatic pollen monitors have been developed in Europe and Japan that recognize pollen morphology, such as BAA-500 [5,6], and monitor using autofluorescence [7]. We believe that it is possible to confirm whether the phenomenon observed in this study can be found in other species of pollen using the data obtained from such automatic pollen monitors.
Conclusions
- Due to the passage of a cold front, the area with a high concentration of japonica pollen changed according to the movement of the front.
- At 40% of the observed points, the count values reached the maximum at exactly the time the cold front passed, and 90% of the points reached the maximum within 2 hours before or after the front passed.
- The maximum number of dispersions was high in the region close to the low pressure system and low in the region away from the system.
Declarations
Acknowledgements
We would like to express our deep gratitude to Weathernews Inc., especially Ms. Ayumi Kusada of Weathernews Inc. for providing the “Pollen Robo” data of Tohoku region. We also thank Dr. Sahashi, N., the Executive Secretary of the Pollen Information Association who permitted the use of the pollen data. This research did not receive any specific grant from funding agencies from the public, commercial, or nonprofit sectors. We would like to thank Editage (www.editage.com) for English language editing.
Competing interests: The authors declare no competing interests.
References
- Takahashi Y, Katagiri S, Tohkairin K, et al. Hourly variation in the dispersion of japonica (Cryptomeria japonica) pollen in the Yamagata Basin and the effect of cold and warm fronts on the pollen counts. Arerugi [Japanese Journal Allergology] 38 (1989): 407-412.
- Takahashi Y, Kawashima S, Fujita T, et al. Comparison between real-time pollen monitor KH-3000 and Burkard sampler. Arerugi [Japanese Journal Allergology] 50 (2001): 1136-1142.
- Kawashima S, Clot B, Fujita T, et al. An algorithm and a device for counting airborne pollen automatically using laser optics. Atmospheric Environment 41 (2007): 7987-7993.
- Takahashi Y, Kawashima S, Suzuki Y, et al. Enrichment of airborne japonica (Cryptomeria japonica) pollen in mountain ranges when passing through a front accompanying temperate low pressure. Aerobiologia 34 (2018): 105-110.
- Oteros J, Pusch G, Weichenmeier I, et al. Automatic and online pollen monitoring. Allergy and Immunology 167 (2015): 158-166.
- Oteros J, Weber A, Kutzor S, et al. An operational robotic pollen monitoring network based on automatic image recognition. Environmental Research, 91 (2020): 110031,
- Mitsumoto K, Yabusaki K, Kobayashi K, et al. Development of a novel real-time pollen-sorting counter using species-specific pollen autofluorescence. Aerobiologia 26 (2010): 99-111.


 Impact Factor: * 4.1
 Acceptance Rate: 75.32%
  Time to first decision: 10.4 days
  Time from article received to acceptance: 2-3 weeks