Dynamic Connectedness and Hedging Opportunity Nexus between Clean Energy, Crude Oil and Technology Sector
Tayfun YILMAZ1*, Ismail ÇELIK2, Feyyaz ZEREN3, Sinan ESEN4
1Department of Business Administration, Faculty of Economics and Administrative Sciences, Burdur Mehmet Akif Ersoy Universitsity, Antalya Burdur Yolu, Yakaköy/Burdur Merkez/Burdur, Türkiye
2Department of Banking and Finance, Faculty of Economics and Administrative Sciences, Burdur Mehmet Akif Ersoy Universitsity, Antalya Burdur Yolu, Yakaköy/Burdur Merkez/Burdur, Türkiye
3Department of International Trade and Finance, Faculty of Economics and Administrative Sciences, Assoc. Prof. Dr. Yalova Universitsity, Merkez, Bahçelievler, Termal Yolu Üzeri, Yalova Merkez/Yalova, Türkiye
4Department of International Trade and Logistics, Faculty of Applied Sciences, Assoc. Prof. Dr. Sakarya University of Applied Sciences, Uygulamalı Bilimler Üniversitesi, Kemalpasa, Kemalpasa, Serdivan/Sakarya, Türkiye
*Corresponding Author: Feyyaz ZEREN, Department of International Trade and Finance, Faculty of Economics and Administrative Sciences, Assoc. Prof. Dr. Yalova Universitsity, Merkez, Bahçelievler, Termal Yolu Üzeri, Yalova Merkez/Yalova, Türkiye.
Received: 17 March 2023; Accepted: 29 March 2023; Published: 11 April 2023
Article Information
Citation: Tayfun YILMAZ, İsmail ÇELİK, Feyyaz ZEREN, Sinan ESEN. Dynamic Connectedness and Hedging Opportunity Nexus between Clean Energy, Crude Oil and Technology Sector. International Journal of Plant, Animal and Environmental Sciences 13 (2023): 23-36.
View / Download Pdf Share at FacebookAbstract
In this paper, dynamic connectedness and time varying hedging opportunities between WilderHill clean energy ETF, West Texas Intermediate (WTI) crude oil and Arca Tech 100 ETFs were analyzed between 3 May 2005-22 October 2021. The volatility interdependency and conditional correlation nexus were investigated by TVP-VAR and DCCFIGARCH model with daily frequencies. TVP-VAR results prove that dynamic connectedness increases among assets, especially during periods of turbulence such as Covid-19. Furthermore, DCC-GARCH model results show that ETFs included in the analysis exhibit long memory properties. The conditional correlation between ECO and PSE is around 71%. The most important finding of the research is that long position risks arising in both ECO and PSE can be effectively and efficiently hedged with WTI. On the other hand, it was determined that WTI can be added to the portfolio in order to reduce the risks of portfolio to be established with clean energy and technology sector. Another remarkable result of the paper is that the simultaneous evaluation of ECO and PSE in portfolio strategies cannot contribute to risk minimization.
Keywords
Dynamic Connectedness; Time varying hedging opportunities; Clean Energy; WTI; Technology sector
Dynamic Connectedness articles; Time varying hedging opportunities articles; Clean Energy articles; WTI articles; Technology sector articles
Article Details
Jel Codes: G11; Q42
1. Introduction
Supply of energy plays an important role in today’s society, ranging from assuring basic human needs to independence of countries. There are three basic sources where can be provided.
Traditional fossil sources like crude oil which has been in use for nearly more than a century, from renewable energy sources and from nuclear raw materials in the form of nuclear energy. However crude oil prices are determined according to demand and supply principle, local and international problems of the crude oil exporting countries which are called “OPEC”, sudden shocks in the market, like contraction of demand or political and social restrictions taken for oil and its derivatives due to global climate change will cause high volatility in the price changes. On the other hand, boost of oil price will trigger the demand on alternative sources, of course this will make a positive impact on the revenue stream of such companies. Although renewable energy capacity has doubled globally from 2007 to 2016, crude oil and other liquids share on global energy consumption is still around 32% [1,2]. Although crude oil prices had gone down to 32 $/ barrel in 2008 crisis, than increased to 114 $/ barrel in 2011 and then went down to 26 $/barrel in 2016, which is a loss of 77 % compared to 2011 prices. Later, on prices differed between 51 / 77 $ a barrel. During Covid19 pandemic due to decline of demand prices went down to 20 $/barrel but recovered to 30 $. Rise in the profits of Tech companies related with clean energy companies are highly expected due to this unstability of oil prices and markets [3].
ARCH and its derivative traditional short memory models are used in most studies investigating the determination of hedging effectiveness and portfolio diversification opportunities. However, in many empirical studies with financial statistics, it has been determined that the autocorrelations of the return and volatility series remain non-zero for a fairly wide delay (using remain non-zero expression of Ding et al. [4], Baillie et al. [5], Ding and Granger [6], Andersen et al. [7]. In all of these studies, it has been proven that autocovariance functions disappear at a slow rate. The most important originality of this study is that the volatility structures of the series, in which portfolio optimization and hedging opportunities are investigated, used the FIGARCH model, which takes into account the long memory (GARCH, EGARCH, APARCH, etc.) instead of short memory models in multivariate form.
The rapid progress in the renewable energy and technology sectors in recent years has reached remarkable levels. According to the "Global Trends in Renewable Energy Investment 2020" report of the UN Environment Program (2020), the investment made in renewable energy in the 2010-2019 period reached 2.7 trillion dollars. Although the Covid-19 process is delayed, it is planned to make an additional $ 1 trillion additional non-hydro renewable energy investment until 2030 [8]. Recently, modeling and forecast of the volatility of financial assets with robust methods attracts the attention of investors, especially in portfolio diversification. This paper basically has two different aims. Firstly, this study aims to investigate the dynamic connectedness and volatility transmission channels between oil, clean energy and technology ETFs. This is one of the most important motivations of the paper, which is thought to fill the gap in the literature. We employ a new approach to the Diebold and Yilmaz [9] connectedness index, developed by Antonakakis and Gabauer [10], which is based on TVP-VAR. Secondly, this study is to demonstrate the conditional correlations between clean energy, technology and wti, as well as to measure the hedging opportunities of long position risks arising from investments made in both clean energy and technology sectors and fossil fuels. The second important contribution of the study to the literature is that the DCC-FIGARCH-t method is used in the search of hedging opportunities, unlike the studies in the previous literature.
In the following sections of the paper, firstly, a summary of the studies in the literature is presented, and then the econometric methods used are introduced. In the fourth part, data and the obtained empirical findings are given and the last part includes results and discussions.
2. Literature Review
There are not much study analyzing relation amidst share values of crude oil companies and alternate energy source and technology companies. The very first one was performed in 2008 by Henriques and Sadorsky [11]. The empirical relation amidst share values of alternate energy source and technology companies and crude oil manufacturing companies were found to have “granger” effect.
Kumar et al. [12] has claimed that alterations in the alternative energy source index is related with crude oil cost and share value of alternative energy source and technology companies, as well with previous alterations in rate of interests. Any rise in crude oil prices affects alternate energy source indices positively. In another study, Sadorsky [13] had performed one of the basic studies about this subject and analyzed the spread of unpredictability amidst crude oil prices and share value of alternate energy source and technology corporations. The results were showing a strong link in high technology share values with alternate energy source company shares values compared with crude oil company shares. If you buy a 20-cent oil share for short term, you can secure this investment with a 1 $ high technology company share for long term.
Managi and Okimoto [14] analyzed structural breaks in the long run relation of alternate energy source shares and found a positive relation in crude oil and alternate energy source prices after the structural break in 2007. Bondia et al. [15] has found long term relation in one or two endogenous breaking points between oil prices, alternative energy and high-tech company stocks. In addition to this, while alternate energy source and high technology company share values were affected by crude oil prices and interest rates in the short terms but not in long terms.
Zhang and Du [16] showed that alternate energy source company share values have more correlation with high technology company share values rather than crude oil and coal prices. Reboredoa and Ugolini [17] evaluated the effect of cardinality of clean energy share profits in price alterations of fossil fuels (oil, natural gas, coal) and power generating costs. They have found that, whenever there is an up/down fluctuation in power generating costs, it has a major effect on renewable energy price dynamics. Moreover, electric prices in Europe and crude oil prices in United States are major determinants in renewable energy share fluctuations.
Ferrer et al. [18] shows that correlation among these occur in short term, such as up to 5 days, but long-term effects were small in United States. Also, another important result of this study was, neither in long term nor short term crude oil price has major effect in the performance of alternate source energy corporate shares in the stock exchange market. In 2018 Lee and Baek [19] have used ARDL model which considers asymmetrical effects and nonlinear. It was found that, alterations in crude oil prices have asymmetrical and positive effect on alternate energy source company shares in short term. In a study carried out by Song et al. [20] examining the dynamic directional information spillover of return and volatility between fossil fuel energy market, investor sentiment, and renewable energy stock prices, it was determined that the spread of volatility was stronger than the spread of returns and it suggests that the risk transfer between the markets was more remarkable. The effect of fossil fuel energy markets (especially the crude oil) on the alternative energy companies’ shares in the stock exchange markets was higher than that of the sentiments of investors. Finally, investor sentiment towards alternative energy markets can partially explain the profits of these shares and their fluctuations. Magyereh et al. [21] with a different approach from their previous study, examined correlations between crude oil shares and alternate energy source and technology shares. When resolving statistics, it was found that, short term profits from crude oil market shares does not affect and get effected from the profits of alternate source energy and technology shares, but in the long term, there is remarkable transfer of profit as an investment from crude oil shares to alternate source energy and technology corporate shares. Over all scales a strong return link was observed amongst alternate source energy shares and such high technology providing corporate shares. The spread of unpredictability was significant in all statistics and alterations.
Nasreen et al. [3] dynamics of relevance among crude oil profits and alternate source energy and technology corporate share indexes were examined. Obtained findings showed that alternate source energy and technology corporate share indexes are perfect hedging tools for the risks in crude oil market. Examining the oil price and alternative energy company stock portfolio and oil price and technology company stock portfolio, it can be seen that the optimum portfolio is the oil-weighted one. Finally, the authors stated that there was a statistically significant relationship between the crude oil prices and the alternative energy and technology indexes between the years 2006 and 2009.
There are few studies using Diebold and Yilmaz’s [22-24] spillover approach. Cronin [25] used this approach to study the relationship between US monetary and financial assets since 2000. He found that sizeable spillovers arose during the periods of economic and financial turbulence after the terrorist attacks to the World Trade Center, the post-Lehman Brothers bankruptcy, etc. Duncan and Kabundi [26] investigated the volatility transmission since it is related with four South African asset classes, namely bonds, commodities, currencies, and equities. The authors found that there was a high level of systemic risk in South Africa and, furthermore, the risk was predominantly related with the country-specific factors. Yilmaz [27] analyzed 10 major East Asian stock markets in order to examine the behavior of return and volatility spillovers across the region over the period between 1992 and 2009. As stated in his study, East Asian stock markets became more interdependent as captured by the increase in return spillovers in the mid-1990s. Caloia et al. [28] studied the strength and direction of semi-volatility spillovers between Germany, France, the Netherland, Italy, and Spain. They found that, over the period between 2000 and 2016, France and the Netherlands were the net donors, while Italy and Spain were the net receivers of both downside risks and upside opportunities. On the other hand, Germany was a net receiver of upside semi-volatility and a net donor of downside semi-volatility. Ji et al. [29] examined the connectedness by using the return and volatility spillovers across six large cryptocurrencies from 7th August 2015 to 22nd February 2018. According to their findings, Bitcoin was found to lose its dominant role in the evolving cryptocurrency market. All the cryptocurrencies were found to alternate between being transmitters and receivers in the course of time. Mensi et al. [30] studied the risk spillover between MSCI world index, S&P 500 index for the United States, stoxx600 index for Europe, P1DOW index for Asia/Pacific, and the five stock markets located in Greece, Ireland, Portugal, Spain, and Italy. They found asymmetric conditional correlations and evidence of significant risk spillovers between these stock markets. Kumar [31] also studied the nature of returns and volatility spillovers between exchange rates and stock price in India, Brazil, and South Africa and found a bi-directional volatility spillover between stock and foreign exchange markets in these countries. Balcilar and Bekun [32] examined the interconnectedness between the returns of the price of oil and foreign exchange on the selected agricultural commodity prices. The results showed a weak pass-through among the investigated variables in rice, sorghum, price inflation, a nominal effective exchange rate and oil price display, while banana, cocoa, groundnut, maize, soybean, and wheat were net transmitters of spillover. Balcilar et al. [33] examined the return and volatility spillover effects in the S&P 500, crude oil, and gold and found a bidirectional return and volatility spillover among these assets. Antonakakis et al. [34] examined the network topology of UK regional property returns over the period 1973Q4–2014Q4 and found that the transmission of inter-regional property return shocks is an important source of fluctuations in the regional property return.
Combining these with the literature, it can be stated that there is a positive relationship between crude oil price and alternative energy source price and there is a significant rise in the alternate energy source indexes whenever crude oil price goes up. Moreover, there is a causal relationship between technology shares, crude oil prices, and alternate energy source company shares. On the other hand, the relationship between alternative energy company shares and high technology company shares is more intense than the alternative energy company shares and fossil fuel prices.
3. Research Methodology
3.1 Dynamic connectedness
Our empirical analysis consists of the following two steps. In the first step, we examine the volatility contagion effects among our series, in order to understand the transmission mechanism and spillover effects of volatility shocks. In the second section of paper, we estimate the time-varying correlations between WTI, ECO and PSE, as well as, to use this empirical information for the construction of the optimal diversification and hedging opportunity strategies.
The contagion effect of the crises in the financial markets makes it valuable to investigate the dynamic connectedness relationships between assets. Although many methods have been applied to investigate the volatility spillover relationships between markets, the most remarkable paper was developed by Diebold and Yilmaz [22,23,35] who introduced different versions of connectedness procedures based on the notion of forecast error variance decomposition from vector autoregressions [10,36,37].
The research procedure developed by Diebold and Yilmaz [9,22-24,35], especially in the field of economy and finance, volatility spillover, stock market interdependencies, cryptocurrency market contagion etc. has found an extensive field of study on the subject (see Duncan and Kabundi [26]; Yilma [27]; Kumar [31]; Caloia et al. [28]; Antonakakis and Gabauer [10]; Ji et al. [29]; Antonakakis et al. [34]; Balcilar and Bekun [32]; Mensi et al. [30]; Cronin [25]; Balcilar et al. [38].
In order to explore the volatility transmission mechanism in a time-varying form, we use the TVP VAR methodology of Antonakakis and Gabauer [10] that extends the originally proposed dynamic connectedness approach of Diebold and Yılmaz [22,23,35], by allowing the variances to vary via a stochastic volatility Kalman Filter estimation with forgetting factors [39].
According to the Bayesian Information Criterion (BIC) we employ a TVP-VAR (1) with time-varying volatility [10],
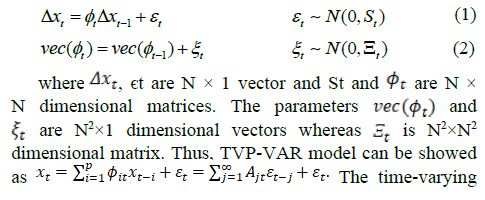
factor of the Vector Moving Average (VMA) model is the important part of the connectedness index served by Diebold
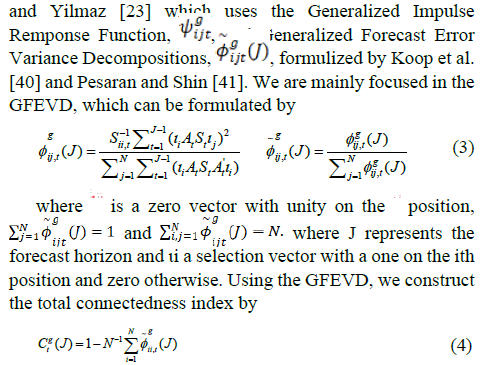
Firstly, we are investigate in the spillovers of variables i to all others j, indicating the TDCTO (Total Directional Connectedness To) others defined as;

Secondly, we calculate the transmission of all variables j to variable i, called TDCFROM (Total Directional Connentedness From) others formulated as;

Lastly, we compute the differencess between TDCTO and TDCFROM in order to gain the NTDC (Net Total Directional Connectedness);

If NTDC is negative, the variable will be interpreted as volatility receiver, if positive, it will be interpreted as volatility transmitter.
3.2 DCC-FIGARCH-t Model
MGARCH models are used frequently by researchers to determine portfolio selections, volatility transmission and hedging opportunities between financial markets. Financial series behavior of skewed distributed and leptokurtic character, information shocks eliminate in hyperbolic speed after reaching financial assets, reluctancy of financial series to return to average are causing financial assets to be interpreted as showing long memory behavior. In this respect Fractional GARCH models are preferred instead of GARCH models to examine the volatility structures of financial assets.
In this paper, we will examine dynamic volatility spillover and hedging opportunities among WTI, ECO and PSE. A major advantage of running the DCC-GARCH model developed by Engle [42] is the detection of possible changes in conditional correlations over time; this model allows us to detect dynamic investor behavior in response to news and innovations [43].
Engle [42] decomposed conditional covariance matrix as:
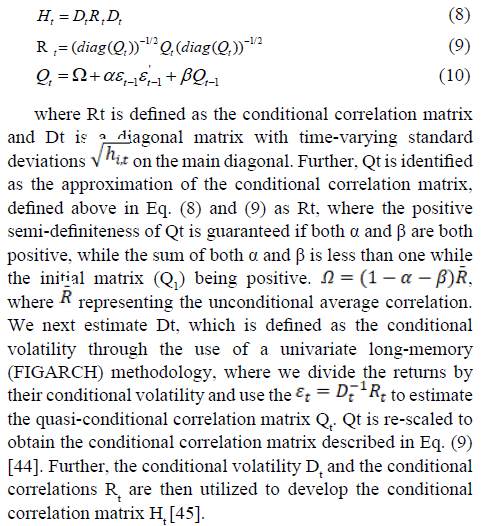
where Rt is defined as the conditional correlation matrix and Dt is a diagonal matrix with time-varying standard deviations on the main diagonal. Further, Qt is identified as the approximation of the conditional correlation matrix, defined above in Eq. (8) and (9) as Rt, where the positive semi-definiteness of Qt is guaranteed if both α and β are both positive, while the sum of both α and β is less than one while the initial matrix (Q1) being positive. , where representing the unconditional average correlation. We next estimate Dt, which is defined as the conditional volatility through the use of a univariate long-memory (FIGARCH) methodology, where we divide the returns by their conditional volatility and use the to estimate the quasi-conditional correlation matrix Qt. Qt is re-scaled to obtain the conditional correlation matrix described in Eq. (9) [44]. Further, the conditional volatility Dt and the conditional correlations Rt are then utilized to develop the conditional correlation matrix Ht [45].
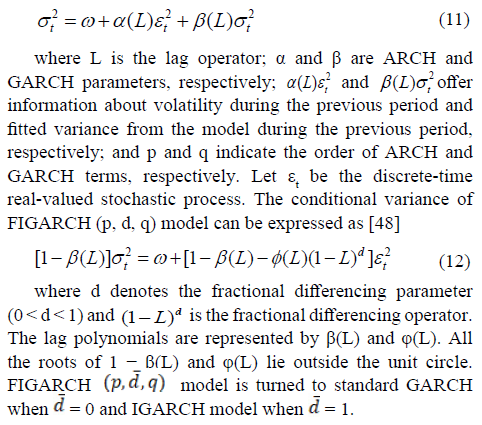
The FIGARCH (Fractional Integrated GARCH) model will be annexed to the literature and we will explore the diffusion relationship between long memory dynamics and financial asset returns. We can use the fractionally integrated GARCH (FIGARCH) model of Baillie et al. [5]. This model was generated from the GARCH specification of Bollerslev [46], which is a useful extension of the ARCH process introduced by Engle [47]. The GARCH (p, q) model can be defined as
4. Data and Empirical Findings
In this paper we have used data from The WilderHill Clean Energy Index (ECO), NYSE Arca Tech 100 Index (PSE) and daily closing prices of crude oil at West Texas Intermediate (WTI). They are obtained from www.finance.yahoo. The WilderHill Clean Energy is the oldest index, who covers 54 alternate source energy companies. The abbreviation for “Clean Energy Index” in the stock market is “ECO”. NYSE Arca Tech 100 Index was founded in 1986 and shows share prices of computer hardware and software companies, health equipment manufacturers, telecommunications and other technology companies. Its abbrevation in the stock market is “PSE” (Table 1).
|
Abbreviation of Variables |
Variables Used in the Study |
Researches Using the Variables |
|
ECO |
The WilderHill Clean Energy Index |
Henriques and Sadorsky [11], Kumar et al. [12], Managi and Okimoto [14], Ahmad [49], Reboredoa and Ugolini [17], Ferrer et al. [18], Song et al. [20], Magyereh et al. [21], Nasreen et al. [3] |
|
PSE |
NYSE Arca Tech. 100 Index |
Henriques and Sadorsky [11], Kumar et al. [12], Managi and Okimoto [14], Bondia et al. [15], Ahmad [49], Ferrer et al. [27], Lee and Baek [19], Nasreen et al. [3] |
|
OIL |
West Texas Intermediate Crude Oil |
Henriques and Sadorsky [11], [12], Managi and Okimoto [14], Bondia et al. [15], Ahmad [49], Reboredoa and Ugolini [17], Ferrer et. al. [18], Lee and Baek [19], Song et al. [20], Magyereh et al. [21], Nasreen et al. [3] |
Table 1: Information on the data set of the study.
4.1 Dynamic connectedness
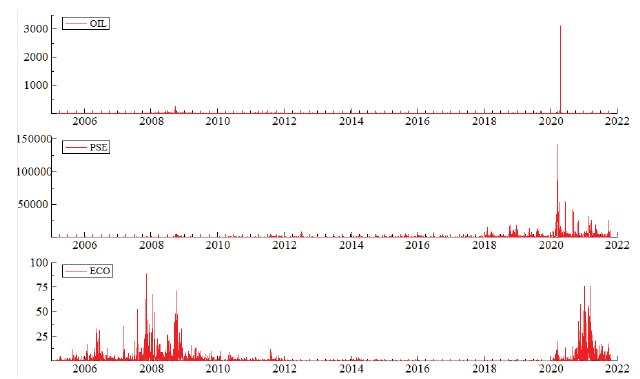
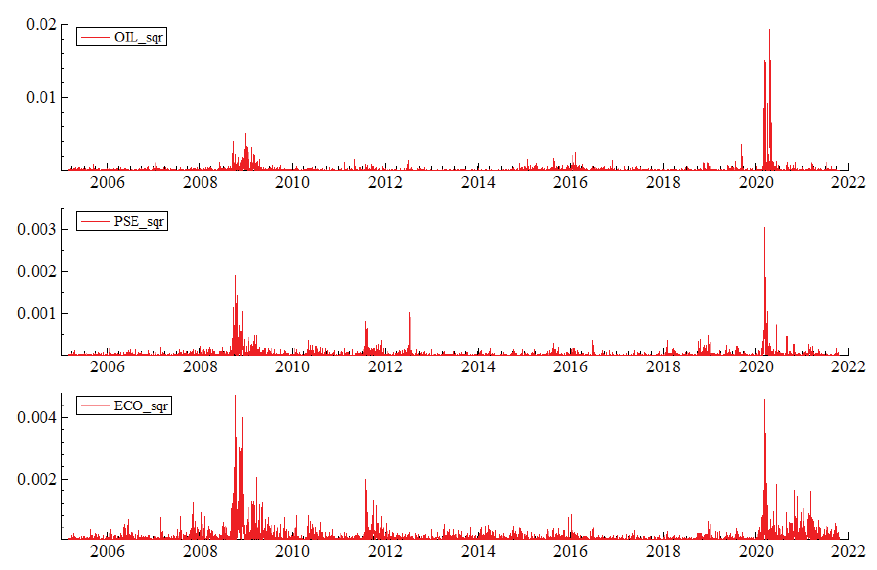
We collect daily price of the West Texas Intermediate Crude Oil (WTI), NYSE Arca Tech 100 Index (PSE) and The Wilderhill Clean Energy Index (ECO) between 3 May 2005-22 Oct 2021. In order to examine the Dynamic Connectedness relation, we first calculated the squared return of the series. Figure 1 represents the volatility series pilot. Descriptive statistics of the volatility series is presented in Table 2. We proved that all series are significantly right skewed and all variables are leptokurtic. In addition, JB test results show that, all series distribute non-normal. Furthermore, according to the ERS test results, all series are stationary on the 1% significance level. In addition, the series contain autocorrelation and exhibit ARCH effect.
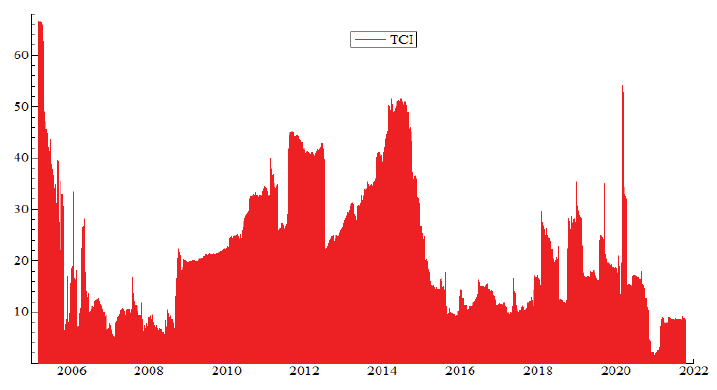
In Figure 2 and Table 3, we report time-varying dynamic connectedness test results for ECO, WTI and PSE. Although the average Total Connectedness Index (TCI) is 21.56, it can be seen that the dynamic connectedness relation between WTI, ECO and PSE rises between 50 and 65 during some turbulent periods such as Covid-19 (2020), European sovereign debt crisis (2012), Iran sanctions (2012), Lebanon Israel crisis (2006) and Paris climate agreement (2016). Considering the TCI values in table 3, the dynamic connectedness relation between WTI, ECO and PSE ETF series achieved a 21.56. This score provides evidence that there is no strong dynamic connectedness interaction between all variables. For instance, ECO and PSE explain 8.24% and 7.67% of the 10-days-ahead forecast error variance of the OIL. Also, ECO explain 20.46% of the forecast error variance of PSE. Similarly, PSE explain 20.76% of the 10-day-ahead forecast error variance of the ECO. In particular, the similarity of the power to explain the forecast error variances of ECO and PSE is similar to the DCC-FIGARCH-t results. This result can be interpreted as the evaluation of ECO and PSE together in portfolio diversification strategies does not contribute to risk minimization.
|
OIL |
PSE |
ECO |
|
|
Mean |
3.629 |
800.872 |
1.72 |
|
Variance |
3550.477 |
16929508.73 |
31.453 |
|
Skewness |
46.689*** |
17.843*** |
7.059*** |
|
0 |
0 |
0 |
|
|
Ex.Kurtosis |
2255.81*** |
456.10*** |
65.22*** |
|
0 |
0 |
0 |
|
|
JB |
905002411*** |
37160057*** |
790562*** |
|
0 |
0 |
0 |
|
|
ERS |
-25.598*** |
-15.747*** |
-12.814*** |
|
0 |
0 |
0 |
|
|
Q(10) |
964.020*** |
3604.199*** |
2586.209*** |
|
0 |
0 |
0 |
|
|
Q2(10) |
725.303*** |
1160.305*** |
661.533*** |
|
0 |
0 |
0 |
|
|
Notes: *** denote significance at 1%, significance levels respectively; ERS: Stock, Elliott, and Rothenberg (1996) unit-root test; Q(20) and Qs(20) are the empirical statistics of the Ljung-Box test |
|||
Table 2: Summary Statistics of Volatility Series.
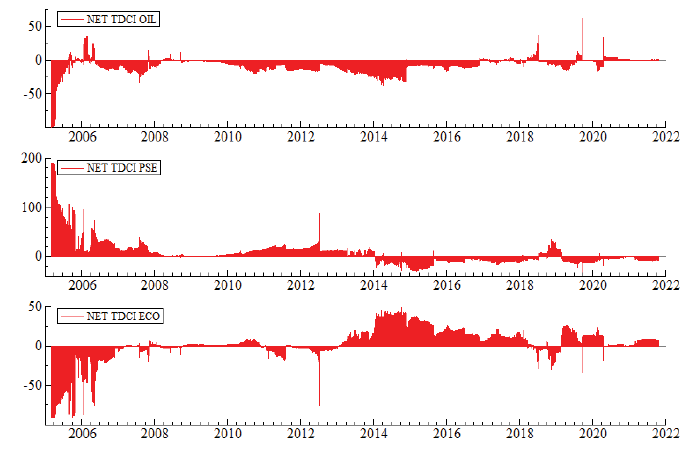
Figure 3, presents the dynamic net total directional connectedness between clean energy, crude oil and technology ETFs. We see that OIL (-8.34) is net receiver of the volatility spillover during the may-2005-Oct-2021 period. PSE (5.96) and ECO (2.39) are a net volatility transmitter. The reason for this situation can be explained that there is a volatility slipover from ECO and PSE shares to OIL due to the increasing importance of technology and clean energy companies after the 2000s, and in addition, due to the loss of importance of oil.
|
From (j) |
||||
|
TO (j) |
OIL |
PSE |
ECO |
From |
|
OIL |
84.09 |
8.24 |
7.67 |
15.91 |
|
PSE |
2.57 |
76.96 |
20.46 |
23.04 |
|
ECO |
4.99 |
20.76 |
74.25 |
25.75 |
|
TO |
7.57 |
28.99 |
28.13 |
64.69 |
|
Inc. Own |
91.66 |
105.96 |
102.39 |
TCI |
|
NET |
-8.34 |
5.96 |
2.39 |
21.56 |
|
Notes: Values represented are variance decompositions for TVP-VAR(2) model. A first-order lag length was chosen by Bayesian information criterion. |
||||
Table 3: TVP-VAR (2) Total Connectedness.
4.1 Dynamic Conditional Correlation and Hedging Opportunities
In this part of the study, it is aimed to investigate the conditional correlation and hedging opportunities between ECO, WTI and PSE. Firstly, the price series are converted to continuously compounded log returns with ln(p_t/p_(t-1)) equation. Summary statistics of log return data series are represented in Table 4. Table show that, all return series ara negatively skewed and leptokurtically distributed. On a final note, the JB test illustrates that the return series of WTI, ECO and PSE exhibit non-normal distribution. In addition, according to the ADF and ERS unit root test results, the return series are stationary. Furthermore, all return series are significantly autocorrelated and exhibit ARCH effects in error.
In Table 5, unconditional correlation parameters show that, positive relationship between PSE and ECO is observed. Although the correlation between both OIL and PSE and OIL & ECO is weak, positive relationship was observed. In Table 6, correlation parameters between squared returns show similarity with the results in Table 5. In Figure 4, volatility clusters are clearly seen in the squared return series.
This result raises doubts about the existence of long memory in asset series. It can be clearly seen from the chart that the 2008 global financial crisis, 2012 European debt crisis, the 2016 Paris climate agreement and the Covid-19 caused a serious increase in the volatility of all 3 series.
|
OIL |
PSE |
ECO |
|
|
Mean |
0.0001069 |
0.0002048 |
0.00000297 |
|
Maximum |
0.13882 |
0.043859 |
0.068705 |
|
Mininum |
-0.12256 |
-0.055313 |
-0.06791 |
|
Std. Dev. |
0.011458 |
0.005577 |
0.009416 |
|
Skewness |
-0.36177 |
-0.413 |
-0.59015 |
|
Excess Kurtosis |
14.465 |
9.8466 |
7.4081 |
|
Jarque-Bera |
33893*** |
15777*** |
9092.9*** |
|
ADF |
-36.1956*** |
-36.3366*** |
-35.226*** |
|
ERS |
-28.048*** |
-27.649*** |
-29.060*** |
|
Q (20) |
59.9390*** |
185.514*** |
76.7882*** |
|
Qs (20) |
2731.77*** |
5007.63*** |
5756.19*** |
|
ARCH (10) |
120.84*** |
159.63*** |
163.50*** |
|
Note: Q(20) and Qs(20) are the empirical statistics of the Ljung-Box test for autocorrelation of returns and squared returns series, respectively. ADF refers to the empirical statistics of the Augmented Dickey-Fuller (1979) unit root test respectively. ERS refers to Elliot, Rothenberg and Stock (1996) unit root test. ERS developed a feasible point optimal test,"P-test", which takes serial correlation of the error term into account. The ARCH (10) test proposed by Engle [45] is used to control the validity of ARCH effects. ***implies the rejection of the null hypotheses of normality, unit root, no autocorrelation and conditional homoscedasticity at the 1% significance level. |
|||
Table 4: Descriptive statistics for daily returns.
|
OIL |
PSE |
ECO |
|
|
OIL |
1 |
||
|
PSE |
0.263 |
1 |
|
|
ECO |
0.309 |
0.766 |
1 |
Table 5: Unconditional Correlation between daily returns.
|
OILsqr |
PSEsqr |
ECOsqr |
|
|
OILsqr |
1 |
||
|
PSEsqr |
0.217 |
1 |
|
|
ECOsqr |
0.267 |
0.758 |
1 |
Table 6: Unconditional Correlation between daily squared returns.
In Table 7 shows DCC-FIGARCH-t model results. The estimates of the univariate FIGARCH model (Panel 1) show that the fractionally integrated coefficient “d” is significant for all series. So, this result revealing a high level of shock persistence. d parameter of WTI is higher than the other indices.
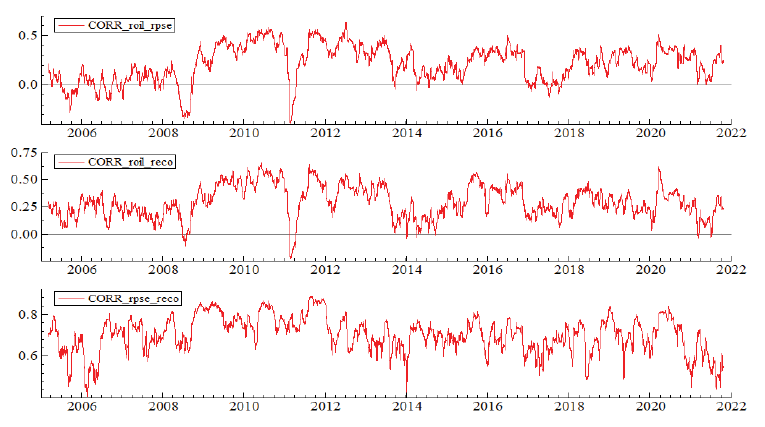
In Panel 2 of Table 7 displaying estimation results of DCC. α and β coefficients are positive. Furthermore, β criterion is very close to 1. This reveals a higher persistence of volatility across indices. Also sums of α and β coefficients are <1, indicating estimated DCC criterion scatter in the range of typical GARCH model. The results are showing investment instruments can be used to manage risks arising from another. The diagnostic test results were summarized in Panel 3, DCC-FIGARCH-t model. The Ljung-Box test for the standardized and squared standardized residuals don’t reject the null hypothesis of “no serial correlation” for most cases.
Figure 5 shows the conditional correlation between variables. Especially during the Covid 19 period, the conditional correlation between eco and pse increased up to 0.84. Similarly, the correlation between wti and both clean energy and technology indices increased at the beginning of 2020 due to covid-19. Research results are similar to Total connectedness analysis results. The correlation between variables increases during turbulence periods.
|
Panel 1: Estimates of the univariate |
FIGARCH Model |
||
|
OIL |
PSE |
ECO |
|
|
Const. (m) |
0.000249** |
0.0003566*** |
0.000185* |
|
-0.00012545 |
-0.00002972 |
-0.00010574 |
|
|
Const. (ν) |
0.009216*** |
1.032569*** |
2.481320*** |
|
-0.0024461 |
-0.30248 |
-0.78988 |
|
|
d-FIGARCH |
0.965349*** |
0.532241*** |
0.424027*** |
|
-0.05295 |
-0.11878 |
-0.057908 |
|
|
∅Arch(1) |
0.071314 |
0.100497 |
0.146596** |
|
-0.056066 |
-0.065098 |
-0.068658 |
|
|
βGarch(1) |
0.896940*** |
0.519522*** |
0.482010*** |
|
-0.015627 |
-0.13779 |
-0.094093 |
|
|
Panel 2: Estimates of the Multivariate |
Model |
||
|
alpha |
0.025814*** |
||
|
-0.0050979 |
|||
|
beta |
0.964754*** |
||
|
-0.0087951 |
|||
|
df |
7.642523*** |
||
|
-0.43013 |
|||
|
Log L |
47733.5 |
||
|
rho oil_pse |
0.2169 |
||
|
`rho oil_eco |
0.2997 |
||
|
rho pse_eco |
0.7055 |
||
|
Panel 3: Diagnostic tests |
|||
|
Qs (20) |
15.9217 |
32.2787** |
43.2901*** |
|
[0.7214684] |
[0.0404173] |
[0.0018713] |
|
|
Qs (20) |
9.28357 |
23.8057 |
21.7644 |
|
[0.9793839] |
[0.2509822] |
[0.3534305] |
|
|
Notes: Qs (10) and Qs (20) refering to Ljung-Box test data performed to the squared standardized particles with 20 lags respectively. The asterisks *, ** and *** shows significance at 10 %, 5 % and 1 % levels, respectively. The p-values are shown in brackets and the standard errors are in parentheses. |
|||
Table 7: DCC-FIGARCH-t (1, d, 1) Model Results.
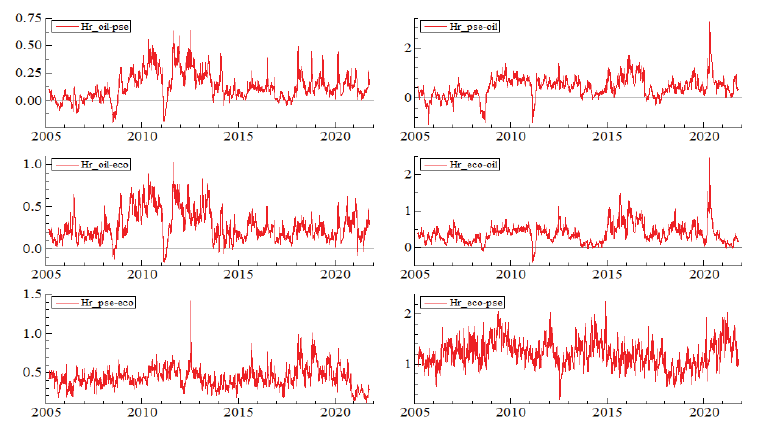
Long term positions in ECO, WTI or PSE can hedged with short term positions with other shares. We calculate time varying hedge ratio with the help olf conditional volatility series and be used eq. 13

The conditional volatilities from the DCC-FIGARCH-t model can be used to estimate Time-Varying (TV) hedge ratios. Figure 6 and Table 8 show that, a $1 long position in OIL can be hedged for 38 cents with a short position in the ECO. Onaverage, a $1 long position in clean energy companies can be hedged for 27 cents with a short position in the WTI. Furthermore, on average, a $1 long position in WTI market can be hedged for 43 cents with a short position in the PSE. On the other hand, a $1 long position in technology stock can be hedged fo 13 cents with a short position in the WTI futures. According to the results, it can be stated that WTI is an inexpensive alternative to manage long position risks arising from both clean energy and technology sectors.
|
Mean |
Min |
Max |
Std Dev |
|
|
ECO/OIL |
0.27084 |
-0.15267 |
1.0261 |
0.17595 |
|
OIL/ECO |
0.38273 |
-0.39346 |
2.4673 |
0.25525 |
|
PSE/OIL |
0.12605 |
-0.20609 |
0.6448 |
0.12689 |
|
OIL/PSE |
0.42814 |
-1.0744 |
3.0319 |
0.41139 |
|
PSE/ECO |
0.43406 |
0.1247 |
1.4124 |
0.12828 |
|
ECO/PSE |
1.2014 |
0.29234 |
2.247 |
0.26551 |
|
Long/Short represents that the first asset is long and the second asset is shorted in a portfolio |
||||
Table 8: TV- Hedge Ratio Summary Statistics.
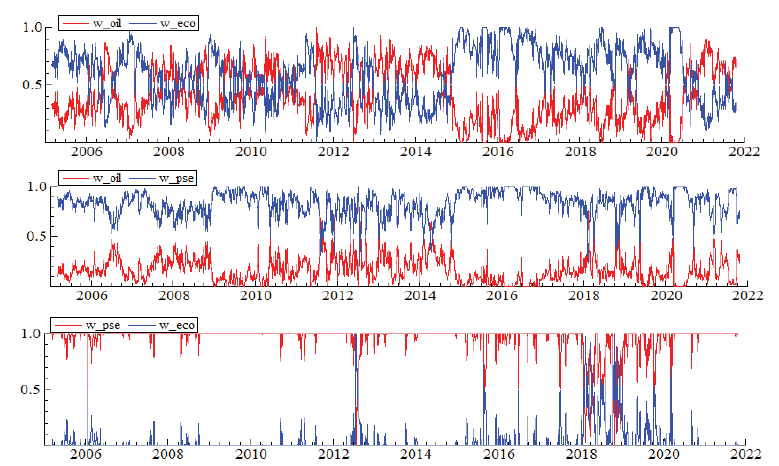
Calculating amount of these assets are important within the optimal portfolios, also calculating short term positions to avoid any long term position risks arising from financial assets. Conditional volatility obtained from DCC-FIGARCH-t can help to calculate amounts of portfolio by using equation 14 and 15.
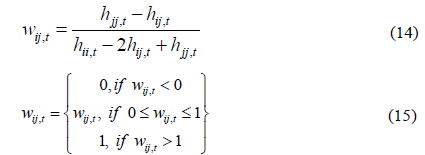
Wij,t, showing amount of 1st investment in 1$ investment portfolio, hij,t, showing covariance between these two investments. hjj,t, representing variance in both investments. When 1 represents value of asset, the remaining part will show the second investment value in the portfolio. Figure 5 shows time rates of financial asset amounts amongst the prospective portfolios.
The results of the dynamic optimal portfolio weights for two financial asset portfolios comprising of oil and one of the remaining ETFs are represented in Table 9. The mean weight shows the dollar cents that need to be invest in OIL in any $1 portfolio. For instance, in the OIL/ECO portfolio, 41 cents should be invested in OIL and 59 cents in ECO. Similarly, in the OIL/PSE portfolio, 17 cents should be invested in OIL and 83 cents in PSE. Due to the high conditional correlation between PSE and ECO, it emerges as a result of including only one of these investment instruments in bilateral portfolios.
|
Min |
Mean |
Max |
Std. dev. |
|
|
ECO/PSE |
0 |
0.042 |
1 |
0.12496 |
|
PSE/ECO |
0 |
0.958 |
1 |
0.12496 |
|
OIL/ECO |
0 |
0.408 |
1 |
0.22929 |
|
ECO/OIL |
0 |
0.592 |
1 |
0.22929 |
|
OIL/PSE |
0 |
0.17 |
0.79835 |
0.12659 |
|
PSE/OIL |
0.20165 |
0.83 |
1 |
0.12659 |
Table 9: Portfolio Weights.
4. Conclusion and Policy Recommendation
Increase in energy demand issue due to energy security arising from the climate changes and economic growth efforts of countries has recently started to take an important place in the political agendas of countries on a global scale. All these contributed to increased Research and Development works in alternative energy category in the last decade. Especially because of the effects of price shocks caused by uncertainties in oil prices, as in many other industries, the clean energy and technology sector recently drew significant interest in the finance literature. This paper aimed to reveal the time-varying interaction between crude oil and alternative energy & technology industries and helps to manage the risks of investment tools for long positioning and present hedging opportunity skills of investment tools in portfolio diversifications. With the help of DCC-FIGARCH-t model, both long memory properties in volatility and time rates volatility spillover structure were explored.
When the results obtained using the TVP VAR model are examined, it is understood that the dynamic linkage between ECO, WTI and PSE that changes over time is weak and this relationship becomes stronger in periods such as Covid-19, European sovereign debt crisis (2012), Iran sanctions (2012) Lebanon Israel crisis (2006) and Paris climate agreement (2016). On the other hand, volatility clusters were found in crude oil and alternative energy and technology returns. For this reason, useful information shocks reach to all 3 assets and being eliminated at hyperbolic speed, also the volatility spillover lasted for a long time. These were found in DCC-FIGARCH-t model results. Detailed results are shown in Figure 3. After the 2008 global financial crisis, an increase was observed in the conditional correlation between investment tools. The result achieved here revealed that the technology sector could not contribute to hedging the risks caused by the long positioning in any of the selected investment tools. Time-varying hedge rates were considered to manage risks of 1$ alternate energy long term position, WTI shorting of 0.27 $ is needed. Moreover, to manage risks of 1$ technology long-term position, WTI shorting of 0.13 $ is needed. Especially to manage risks of 1$ investment in technology category, 0.43 $ investment should be made in the alternative energy category. Considering the hedging opportunities, technology category cannot offer serious opportunities in comparison to other investment alternatives and the main reason is the high correlation in alternative energy category.
DCC-FIGARCH-t model used in this study creates binary portfolios with investment tools by making use of the conditional variance and covariance matrices. The average weight of ECO/OIL assets in the study is 0.59. Given this result, it can be concluded that a portfolio of 1$ should consist of 0.59 $ clean energy and 0.41$ WTI futures. According to the results of this study, correlation between clean energy (ECO) and technology (PSE) should be 75% and it should be noted that the technology sector cannot offer any hedging opportunities since it is relatively high. Hedging the long-term positioning risks in alternative energy and technology category by using the short-term positioning investments should be made in WTI future. On the other hand, long positioning risks of WTI futures can be compensated by clean energy asymmetric positions. Furthermore, it was observed that technology industry also offers similar hedging opportunities. For the investors who do not make portfolio diversification between two highly correlated investment instruments such as alternative energy and technology, it can be recommended to involve WTI futures in the portfolio, which will offer serious opportunities for managing the risks.
In this paper, it is aimed to fill a remarkable gap in literature by modeling the volatility of financial assets by using a more robust method with the DCC-FIGARCH-t model. Sadorsky [13] previously listed the short memory models such as Dynamic conditional correlation, Constant Conditional Correlation, etc. Although this subject has been examined by using models, the present paper is the first study examining these relationships by using models taking into account that information shocks that affect financial assets disappear at hyperbolic speed. This is the point, which differentiates it from the previous studies.
While S and P Global Clean Energy Index, The MSCI Global Alternative Energy Index, MSCI World Information Technology index, and many other similar indices have been used in previous studies, but the energy and technology category indices haven’t been included. This causes the most important constraints. By including more energy and technology indices in future studies, it will also be possible to make a selection between multiple models by the predictive performance. Considering the multivariate Fractional GARCH models, which take into account that time series are fractal (self-similarity), instead of short memory (CCC, BEKK, DCC GARCH, etc.) models, which have been used many times in modeling the return volatility of renewable energy and technology sectors, will offer important advantages to investors in terms of portfolio optimization and hedging opportunities.
References
- International Renewable Energy Agency, Renewable Energy Statistics 2017 (2017).
- International Energy Outlook (2019).
- Nasreen S, Tivari AK, Eizaguirre JC. Dynamic connectedness between oil prices and stock returns of clean energy and technology companies. Journal of Cleaner Production 260 (2020).
- Ding Z, Granger CW, Engle RF. A long memory property of stock market returns and a new model. Journal of Empirical Finance 1 (1993): 83-106.
- Baillie RT, Bollerslev T, Mikkelsen HO. Fractionally integrated generalized autoregressive conditional heteroskedasticity. Journal of Econometrics 74 (1996): 3-30.
- Ding Z, Granger CW. Modeling volatility persistence of speculative returns: A new approach. Journal of Econometrics 73 (1996): 185-215.
- Andersen TG, Bollerslev T, Diebold FX, et al. The distribution of realized exchange rate volatility. Journal of the American Statistical Association 96 (2001): 42-55.
- Global trends in renewable energy investment 2020, FS-UNEP Collaborating Centre for Climate and Sustainable Energy Finance (2020).
- Diebold FX, Yilmaz K. Financial and Macroeconomic Connectedness: A Network Approach to Measurement and Monitoring, Oxford University Press, April 2015 (2015).
- Antonakakis N, Gabauer D, Gupta R. International monetary policy spillovers: Evidence from a time-varying parameter vector autoregression. International Review of Financial Analysis 65 (2019).
- Henriques I, Sadorsky P. Oil prices and the stock prices of alternative energy companies. Energy Economics 30 (2008): 998-1010.
- Kumar S, Managi S, Matsuda A. Stock prices of clean energy firms, oil and carbon markets: A vector autoregressive analysis. Energy Economics 34 (2012): 215-226.
- Sadorsky P. Correlations and volatility spillovers between oil prices and the stock prices of clean energy and technology companies. Energy Economics 34 (2012): 248-255.
- Managi S, Okimoto T. Does the price of oil interact with clean energy prices in the stock market?. Japan and the World Economy 27 (2013): 1-9.
- Bondia R, Ghosh S, Kanjilal K. International crude oil prices and the stock prices of clean energy and technology companies: Evidence from non-linear cointegration tests with unknown structural breaks. Energy 101 (2016): 558-565.
- Zhang G, Du Z. Co-movements among the stock prices of new energy, high-technology and fossil fuel companies in China. Energy 135(2017): 249-256
- Reboredoa JC, Ugolini A. The impact of energy prices on clean energy stock prices. A multivariate quantile dependence approach. Energy Economics 76 (2018): 136-152.
- Ferrer R, Shahzad SJH, Lopez R, et al. Time and frequency dynamics of connectedness between renewable energy stocks and crude oil prices. Energy Economics 76 (2018): 1-20.
- Lee D, Baek J. Stock prices of renewable energy firms: are there asymmetric responses to oil price changes. Economies 6 (2018): 59.
- Song Y, Ji Q, Du Y, et al. The dynamic dependence of fossil energy, investor sentiment and renewable energy stock markets. Energy Economics 84 (2019): 104564.
- Magyereh A, Awartani B, Abdoh H. The co-movement between oil and clean energy stocks: A waveletbased analysis of horizon associations Energy 169 (2019): 895-913.
- Diebold FX, Yilmaz K. Measuring Financial Asset Return and Volatility Spillovers, With Application to Global Equity Markets, Economic Journal 119 (2009): 158-171.
- Diebold FX, Yilmaz K. Better to Give than to Receive: Forecast-Based Measurement of Volatility Spillovers. International Journal of Forecasting 28 (2012): 57-66.
- Diebold FX, Yilmaz K. Trans-Atlantic Equity Volatility Connectedness: U.S. and European Financial Institutions, 2004-2014. Journal of Financial Econometrics 14 (2016): 81-127.
- Cronin D. The interaction between money and asset markets: A spillover index approach. Journal of Macroeconomics 39 (2014): 185-202.
- Duncan AS, Kabundi A. Domestic and foreign sources of volatility spillover to South African asset classes. Economic Modelling 31 (2013): 566-573.
- Yilmaz, K. Return and volatility spillovers among the East Asian equity markets. Journal of Asian Economics 21 (2010): 304-313.
- Caloia FG, Cipollini A, Muzzioli S. Asymmetric semi-volatility spillover effects in EMU stock markets. International Review of Financial Analysis 57 (2018): 221-230.
- Ji Q, Bouri E, Lau CKM, et al. Dynamic connectedness and integration in cryptocurrency markets. International Review of Financial Analysis 63 (2019): 257-272.
- Mensi W, Boubaker FZ, Al-Yahyaee KH. Dynamic volatility spillovers and connectedness between global, regional, and GIPSI stock markets. Finance Research Letters 25 (2018): 230-238.
- Kumar M. Returns and volatility spillover between stock prices and exchange rates: Empirical evidence from IBSA countries. International Journal of Emerging Markets 8 (2013).
- Balcilar M, Bekun FV. Do oil prices and exchange rates account for agricultural commodity market spillovers? Evidence from the Diebold and Yilmaz Index. Agrekon 59 (2020): 366-385.
- Balcilar M, Ozdemir ZA, Ozdemir H. Dynamic return and volatility spillovers among S&P 500, crude oil, and gold. International Journal of Finance and Economics 26 (2018): 153-170.
- Antonakakis N, Chatziantoniou I, Floros C. The dynamic connectedness of UK regional property returns. Urban Studies, 55 (2018): 3110-3134.
- Diebold FX, Yılmaz K. On the network topology of variance decompositions: Measuring the connectedness of financial firms. Journal of econometrics 182 (2014): 119-134.
- Antonakakis N, Chatziantoniou I, Gabauer D. Refined Measures of Dynamic Connectedness based on Time-Varying Parameter Vector Autoregressions. Journal of Risk and Financial Management 13 (2020): 84.
- Antonakakis N, Chatziantoniou I, Gabauer D. Refined measures of dynamic connectedness based on time-varying parameter vector autoregressions. Journal of Risk and Financial Management 13 (2020): 84.
- Balcilar M, Ozdemir ZA, Ozdemir H. Dynamic return and volatility spillovers among S&P 500, crude oil, and gold. International Journal of Finance and Economics 26 (2021): 153-170.
- Gabauer D, Gupta, R. On the transmission mechanism of country-specific and international economic uncertainty spillovers: Evidence from a TVP-VAR connectedness decomposition approach. Economics Letters 171 (2018): 63-71.
- Koop G, Pesaran MH, Potter SM. Impulse response analysis in nonlinear multivariate models. Journal of econometrics 74 (1996): 119-147.
- Pesaran HH, Shin Y. Generalized impulse response analysis in linear multivariate models. Economics letters 58 (1998): 17-29.
- Engle R. Dynamic conditional correlation: A simple class of multivariate generalized autoregressive conditional heteroskedasticity models. Journal of Business and Economic Statistics 20 (2002): 339-350.
- Celik S. The more contagion effect on emerging markets: The evidence of DCC-GARCH model. Economic Modelling 29 (2012): 1946-1959.
- Harris RD, Nguyen A. Long memory conditional volatility and asset allocation. International Journal of Forecasting 29 (2013): 258-273.
- Corbet S, Goodell JW, Gunay S. Co-movements and spillovers of oil and renewable firms under extreme conditions: New evidence from negative WTI prices during COVID-19. Energy economics 92 (2020): 104978.
- Bollerslev T. Generalized autoregressive conditional heteroskedasticity. Journal of econometrics 31 (1986): 307-327.
- Engle RF. Autoregressive conditional heteroscedasticity with estimates of the variance of United Kingdom inflation. Econometrica 50 (1982).
- Gunay S, Bakry W, Al-Mohammad S. The Australian Stock Market’s Reaction to the First Wave of the COVID-19 Pandemic and Black Summer Bushfires: A Sectoral Analysis. Journal of Risk and Financial Management 14 (2021): 175.
- Ahmad W. On the dynamic dependence and investment performance of crude oil and clean energy stocks. Research in International Business and Finance 42 (2017): 376-389.


 Impact Factor: * 4.1
 Acceptance Rate: 75.32%
  Time to first decision: 10.4 days
  Time from article received to acceptance: 2-3 weeks