From Manipulation to Modulation: Evaluating the Effect of Osteopathic Rib Raising Technique on Cardiac Autonomic Activity Through QT Interval and Heart Rate Variability Analysis
Faustine Viri1, Roqaya Wafa1, Kristina Cummings1, Maxim Crasta2*
1Lake Erie College of Osteopathic Medicine, Elmira, NY 14901
2Meritus School of Osteopathic Medicine, Hagerstown, MD 21742
*Corresponding author: Maxim Crasta, Meritus School of Osteopathic Medicine, Hagerstown, MD 21742, Email: Maxim.Crasta@msom.org
Received: 23 May 2025; Accepted: 13 August 2025; Published: 15 August 2025
Article Information
Citation: Faustine Viri, Roqaya Wafa, Kristina Cummings, Maxim Crasta. From Manipulation to Modulation: Evaluating the Effect of Osteopathic Rib Raising Technique on Cardiac Autonomic Activity Through QT Interval and Heart Rate Variability Analysis. Cardiology and Cardiovascular Medicine. 9 (2025): 344-354.
View / Download Pdf Share at FacebookAbstract
Osteopathic Manipulative Therapy (OMT) has become a key approach in managing musculoskeletal disorders, supported by both patient reports and clinical evidence. Although there is evidence suggesting that manual techniques like rib raising can affect the autonomic nervous system (ANS), the specific electrophysiological repercussions on cardiac tissue remain to be fully elucidated. This study seeks to investigate how rib raising manipulation may influence ventricular repolarization dispersion via ANS interactions in healthy subjects. The rationale for employing rib raising lies in its potential to modulate autonomic tone. Various QT interval metrics were analyzed, including the Index of Cardiac Electrical Balance (iCEB), QTc, Tp-e/QTc ratio, JT/QRS ratio, and JT index, along with heart rate variability measures such as the standard deviation of Normal to Normal intervals (SDNN) and LF:HF ratio, to assess changes in parasympathetic-sympathetic balance and their effects on cardiac electrophysiology.
A randomized two-period, two-sequence crossover design with repeated measures was conducted involving 20 research participants. Data was recorded using Electrocardiography (EKG) and Heart Rate Variability (HRV) assessments. Participants were assigned to two groups: one group received the rib-raising procedure (ART) initially, while the other group was administered a placebo treatment across two recording phases. Interval measurements were obtained through EKG software, focusing on the duration of the QT interval, QRS complex, JT interval, and QT-Peak to T-End (Tp-e) interval. QT correction was calculated using both Bazett's and Fridericia's formulas.
The ART group exhibited significant changes in cardiac parameters compared to the sham control group. The JT interval, JT/QRS ratio, and JT index (JTi) were larger, with a significant difference in the JT/QRS ratio (p=0.026). The Tp-e interval shortened significantly, while the QTa length increased. ART had significant effects on the Tp-e interval (F(2, 38) = 33.69, p < .001) and QTa interval (F(2, 38) = 3.179, p = .05). Both QTcB and QTcF intervals, corrected using Bazett’s and Fridericia’s formulas, showed significant prolongation (p < .05 for both). SDNN increased by 9.1% in the ART group (132 ± 18.9 ms vs. 121 ± 15.3 ms in the sham group), indicating enhanced parasympathetic modulation. The LF:HF ratio was significantly lower in the ART group (1.23±0.089 vs. 1.011±0.02, p=0.03), suggesting improved ANS equilibrium.
The increased QTa interval and reduced Tp-e values indicate transient changes in repolarization dynamics following the intervention. This is further supported by changes in the heart rate-corrected QT interval (QTc), an increased JT/QRS ratio suggesting delayed repolarization. These findings suggest that repolarization parameters are temporarily altered. Additionally, the elevated SDNN and reduced LH:FSH ratio post-intervention indicate heightened vagal modulation. The ART intervention appears to transiently increase sympathetic activity and subsequently promote parasympathetic dominance, creating a balanced autonomic nervous system that can be beneficial for cardiac health.
Keywords
<p>Rib Raising, QT interval, Autonomic Nervous Sytem, Cardiac Electrical Balance</p>
Article Details
1. Introduction
Osteopathic manipulative therapy, which incorporates methods like articulatory rib raising, has become increasingly popular in clinical practice as a viable approach to managing various musculoskeletal disorders and enhancing overall health. The systematic review conducted by Zip et al. highlights the effectiveness of OMT specifically for nonspecific low back pain, emphasizing the importance of utilizing authentic osteopathic interventions in clinical practice [1]. Their findings align with those of Posadzki and Ernst (2011), who conducted a systematic review and identified OMT as beneficial for patients with various musculoskeletal pain conditions [2]. Both studies underline the significance of the clinical judgment exercised by practitioners in tailoring treatments to individual patient needs, which is a cornerstone of osteopathic philosophy. However, the impact of these therapies on the autonomic nervous system (ANS) remains complex and multifaceted. A systematic review revealed that while some manual therapies seem to affect ANS activity, the findings across studies are inconsistent, and the precise mechanisms underlying these effects remain poorly understood [3,4].
This variability complicates the application of manual therapies aimed at modifying ANS function. In their study, Stepnik et al. (2023) evaluated the influence of rib raising and the Fourth Ventricle Compression technique on ANS activity, as measured by heart rate variability (HRV) in healthy subjects. The findings revealed an increase in parasympathetic activity, indicating a beneficial effect of these manipulative approaches on cardiac autonomic regulation. The rib raising technique raised levels of salivary alpha-amylase, a biomarker signifying enhanced parasympathetic nervous system activity [5,4]. These findings align with those of Borges et al. (2018) who reported increased HRV variability after certain manual therapies, further supporting the idea that specific body manipulations may promote parasympathetic dominance [5]. Moreover, manual manipulation has been shown to enhance respiratory function and boost the immune response by targeting key anatomical structures involved in these systems [6]. This suggests that the advantages of OMT may extend beyond musculoskeletal concerns, hinting at broader implications for the regulation of the ANS.Transmural dispersion of repolarization (TDR) represents the differences in the repolarization times among the epicardial, midmyocardial (M cells), and endocardial layers, a phenomenon that can be noninvasively assessed using surface electrocardiography [7-9]. Experimental models utilizing isolated ventricular wedge preparations have demonstrated that the peak of the T-wave on the ECG corresponds to the repolarization of the epicardial cells, whereas the end of the T-wave aligns with the final repolarization of the M cells [10]. This relationship establishes the T peak-to-end (Tp-e) interval as a surrogate marker for total TDR, effectively summarizing the heterogeneity in ventricular repolarization [11]. Building upon these electrophysiological concepts, additional indices such as the Tp-e/QT and Tp-e/corrected QT (QTc) ratios have been introduced. These ratios, derived from the conventional 12-lead surface EKG, offer a normalized measure of TDR that accounts for the overall repolarization duration [ 12,13].
The current study was designed to evaluate the impact of modulating ventricular repolarization dispersion through ANS intervention using a rib raising procedure in healthy individuals. The rationale for incorporating a rib raising procedure lies in its potential to modulate autonomic tone, which has been previously correlated with alterations in ventricular action potential durations and repolarization dispersion. [14,15]. Prior experimental studies have reported that enhanced sympathetic or altered vagal activity may influence the magnitude of TDR [15]. By measuring the Tp-e interval along with the Tp-e/QT and Tp-e/QTc ratios, the study aims to provide an integrative assessment of the electrophysiological substrate that may be modified by ANS activity. Collectively, these indices offer an indirect yet robust method for quantifying the spatial heterogeneity of repolarization. In doing so, these serve as valuable tools to evaluate the electrophysiological effects of the rib raising procedure.
In an earlier study, it was shown that Suboccipital Release Osteopathic Manipulation had diverse effects on QT metrics, leading to a noticeable increase in both QT and QTcB measurements [16]. A novel non-invasive biomarker, termed the Index of Cardio Electrophysiological Balance (iCEB), has been introduced to evaluate the balance between the depolarization and repolarization phases of the cardiac action potential [17]. The iCEB is calculated by dividing the QT interval, which reflects the total duration of ventricular depolarization and repolarization, by the QRS interval, representing only ventricular depolarization This ratio is considered a marker of cardiac wavelength and electrical stability, with changes in QT or QRS duration potentially indicating a higher risk of malignant ventricular arrhythmias. The core principle of iCEB is its ability to quantify the relative duration of repolarization compared to depolarization, serving as an indicator of the myocardium's electrophysiological balance. Recent studies have also suggested that iCEB may be influenced by the ANS, particularly in scenarios involving interventions aimed at modulating its activity. [18]. We undertook this research to gain deeper insights into the potential effects of the Articulatory Rib raising Technique (ART) on the cellular physiology of ventricular muscle tissue. We hypothesized that QT interval variations, measured via QT interval and heart rate responses using HRV metrics, would mirror these physiological alterations, highlighting changes in cardiac function and autonomic control after the procedure.
2. Materials and Methods
2.1 Subject Recruitment and Consent Process
This research study received formal approval from the Institutional Review Board at the Lake Erie College of Osteopathic Medicine located in Elmira, NY, USA (approval number 31-104 dated April 10, 2024). A total of twenty healthy adult individuals, ranging in age from 22 to 30 years old, were recruited for participation at the Osteopathic Principle and Practice laboratory. The participant cohort included an equal number of male and female medical students who volunteered for the research. Prior to inclusion in the study, all participants were thoroughly informed about the research protocol and provided their informed consent after fulfilling all outlined inclusion and exclusion criteria.
2.2 Randomization
The randomization process was conducted using an online randomization number generator. This generator produced unique numbers, which were printed on securely sealed envelopes to determine the treatment sequence for each participant. Participants were divided into two groups: one group initially received the rib-raising procedure, while the other group received a placebo treatment first. The specific treatment order for each participant was revealed by unsealing the corresponding envelope immediately before their session began.
2.3 Study Groups
This study utilized a randomized two-period, two-sequence crossover design with repeated measures. Participants were blinded to the intervention, and the researcher was unaware of group assignments. Each participant underwent a gentle touch-only intervention and a rib-raising technique in sequential sessions.
Timeline for Lab Sessions: Recording HRV and Electrocardiographic Data
|
Time in minutes |
Steps involved |
|
1-15 |
Preparation-Ensured all participants are properly attired, comfortable and free from distractions. Participants were relaxed and in a quiet environment, resting in supine position. |
|
16-20 |
Placing electrodes and chest strap for HRV & ECG Recording. Explained the HRV/EKG recording procedure to all participants. |
|
21-30 |
Period 1 recording (Sham and ART group) |
|
31-45 |
Washout Period |
|
46-55 |
Period 2 recoding (Sham and ART group) |
|
End of the intervention |
|
In addition to the HRV and EKG data, participant information such as height, weight, age, and sex was collected. Each participant's pulse rate and blood pressure were measured manually and documented prior to the intervention.
2.4 Research question
Null hypothesis (HO)
Rib raising manipulative technique will not show statistically significant difference (p>0,05) in autonomic modulation resulting in HRV changes and QT variability in healthy individuals.
Research hypothesis (H1)
Rib raising manipulative technique will show statistically significant difference (p>0,05) in autonomic modulation resulting in HRV changes and QT variability in healthy individuals. (H1: α =0.05).
2.5 Rib Raising
The participant lay supine on an OMT table, with the research student positioned on the left side. The student placed their arm beneath the participant's arm to access the paravertebral muscles, focusing on the first four ribs. Fingertips were positioned at the junctions where the ribs meet the transverse processes. Using a rocking motion, the researcher lifted the rib angles anteriorly, holding for five seconds before releasing. The pressure applied ensured anterior movement of the contacted tissues and ribs while minimizing movement in surrounding tissues. This lifting technique was repeated five times, followed by two additional sets targeting the ribs (T5-T8 together, then T9-T12). The procedure was then mirrored on the opposite side, starting again with the left. This cycle was repeated for both sides.
2.6 Sham Intervention
Each participant was positioned supine on an OMT table during the placebo protocol. The hand placement and timing were identical to those in the rib-raising protocol, except that no lifting or forward motion was applied during this procedure.
2.7 Recording of EKG and HRV
We used the Nasiff Cardio Card PC-based EKG device (San Pedro, CA, USA), equipped with integrated computer calipers for interval measurement. A 12-lead EKG was recorded at a speed of 25 mm/s and a voltage of 10 mm/mV, and the data were later saved on a computer for further analysis. Readings were taken after each subject rested in a supine position for 20 minutes before each intervention. A baseline data period was set for the control group prior to the first intervention. Following this baseline, two recording phases were done, designated as period one and period two, as outlined in the timeline given above. To minimize any possible carryover effects from the initial procedure, whether it involved ART or a sham treatment, a 15-minute washout period was incorporated. EKGs saved on the computer were randomly sampled and assessed alongside the automated measurements obtained from the device. The Principal Investigator and other team members independently measured the intervals, followed by a thorough cross-check of results. A comparison between the manual and caliper methods showed negligible intra-individual differences, indicating a high level of reproducibility
HRV was assessed using a software (Intellewave, Inc ,Largo, FL,USA) that provided real-time quantitative analysis of HRV spectral components. The system allowed for both graphical and numerical visualization of HRV data, which was captured via an ECG signal from a chest strap positioned securely at the participant's xiphoid process. A Polar® T31 coded™ transmitter belt (Polar Electro Oy, Kempele, Finland) was used to record the data, which was then wirelessly transmitted via Bluetooth to a computer for further processing and storage. Frequency domain measurements were recorded within a range of 0.01 to 0.40 Hz, with the low-frequency (LF) band set at 0.04–0.15 Hz and the high-frequency (HF) band at 0.15–0.40 Hz. The LF/HF ratio was subsequently calculated using Microsoft Excel.
2.8 Interval Measurements
The QT interval was measured from the start of the QRS complex (beginning of the Q-wave) to the end of the T-wave, identified as the point where the waveform returned to the TP baseline. In cases where U-waves were present, the end of the T-wave was determined using the tangent method, where a line drawn along the descending slope of the T-wave intersected the baseline.QRS duration is measured from the start of the QRS complex (onset) to its endpoint (J-point or QRS offset), representing the total time taken for ventricular depolarization. The JT interval is the duration from the end of ventricular depolarization (J-point) to the end of ventricular repolarization (T-wave end). It is calculated using the formula JT Interval = QT Interval − QRS Duration. The QT-Peak to T-End (Tp-e) interval measures the time from the peak of the T-wave to the end of the T-wave, reflecting late ventricular repolarization correction is calculated using Bazett's formula (QTc = QT/√RR). Fridericia's formula QTc = QT / ³√RR is also applied for comparison.
The Tp-e interval refers to the duration from the apex of the T wave to its end. This interval is believed to represent the transmural dispersion of repolarization throughout the ventricular walls. Conversely, the QT interval measures the time from the initiation of the QRS complex to the end of the T wave, encompassing both ventricular depolarization and repolarization. Consequently, the Tp-e/QT ratio is defined as the quotient of the Tp-e interval and the overall QT interval. This ratio serves to normalize the Tp-e interval in relation to heart rate, given that QT is influenced by heart rate variations.
3.Statistics
To evaluate the variations observed at three distinct time intervals, a repeated-measures analysis of variance (ANOVA) was employed. This methodology enabled the analysis of both inter-group differences and intra-individual changes over the specified period. Following the ANOVA, post hoc analyses were performed utilizing the Scheffé test to adjust for the potential inflation of Type I error associated with multiple comparisons. The results from these analyses are presented as mean values accompanied by their standard error of the mean (SEM), unless otherwise specified. To compare the differences between sham and ART, we employed student's t-tests for data that met the assumptions of normal distribution. Conversely, Mann-Whitney U-tests were utilized for data that did not conform to a normal distribution. Statistical analyses were conducted using Prism (version 10.0; GraphPad Software Inc., La Jolla, CA). A P<0.05 was considered to indicate statistical significance.
3. Results
|
Sham controls (n=20) |
Rib raising group (n=20) |
P values |
|
|
Age (years) |
25 ±4 |
25 ±4 |
1.00 |
|
Male (n%) |
50% |
50% |
1.00 |
|
Female (n%) |
50% |
50% |
1.00 |
|
BMI |
25±3.8 |
24.4±4.5 |
0.156 |
|
SBP (mmHg) |
118±33.1 |
116±14.12 |
0.141 |
|
DBP (mmHg) |
68±12 |
66±8.91 |
0.132 |
|
RR (ms) |
880±69 |
920±72 |
0.764 |
|
Heart rate (beats/min) |
68.0±10 |
65±14 |
0.152 |
|
QRS duration (ms) |
85±6.32 |
81±4.56 |
0.062 |
|
QT interval (ms) |
377±39 |
403±34 |
0.320 |
|
QTcB interval (Bazett) ms |
401±45 |
419±40 |
0.341 |
|
QTc Interval (Fridericia)ms |
393±67 |
413±48 |
0.054 |
|
Tp-e interval (ms) |
67.5±9.0 |
60±7.9 |
0.654 |
|
Tp-e/QT ratio |
0.18±0.05 |
0.16+0.07 |
0.360 |
|
Tp-e/QTc ratio |
0.16±0.03 |
0.15± 0.02 |
0.761 |
|
iCEB (QT/QRS) |
4.45± 0.41 |
4.97±0.51 |
0.042 |
|
JT interval (msec) |
292.34±42 |
322.32±28 |
0.039 |
|
JT/QRS ratio |
3.42±0.86 |
3.97±0.48 |
0.026 |
|
JT index |
94.7±19.6 |
104±15.64 |
0.051 |
|
BMI: Body mass Index; SBP: Systolic Blood Pressure; DBP: Diastolic Blood Pressure ; RR :Respiratory Rate ;QTc: corrected QT; QTcB : QT interval corrected using Bazett's formula ; Tp-e : Interval measured from the peak of the T wave to the end of the T wave; iCEB: Index of Cardiac Electrophysiological Balance is a measure calculated as the ratio of the QT interval to the QRS duration; JT Interval = QT Interval − QRS Duration; JT =QT interval−QRS duration. |
|||
Table 1: Baseline demographic and EKG parameters.
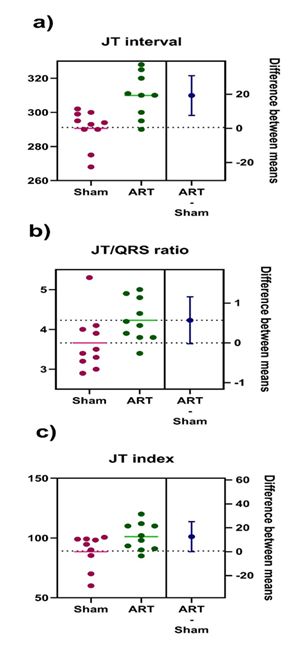
Table 1 presents the initial demographic and EKG parameters collected from the participants. No statistically significant differences were observed in the baseline characteristics among the participants. Although the variations in blood pressure and heart rate were statistically significant when analyzed individually, the equal representation of male and female participants mitigated these fluctuations. This balance may account for the observation of no significant differences between sexes (p < 0.05). The QRS complex duration, reflecting ventricular depolarization, decreased from 85 ± 6.32 milliseconds at baseline to 81 ± 4.56 milliseconds at follow-up, though this change was not statistically significant (p=0.062). Conversely, the QT interval increased from 377 ± 39 milliseconds to 403 ± 34 milliseconds (p=0.320), which also did not show statistical significance. To explore changes in the QT interval following the rib raising technique, corrected QT intervals was calculated using Bazett's (QTcB) and Fridericia's (QTcF) formulas. Although QTcF is often considered more accurate at extreme heart rates, especially lower rates, our results indicate that the observed increase in QTc was not statistically significant (p < 0.05). The QT interval was analyzed by disaggregating it into its components: QRS, JT, and Tp-e, to identify the specific component that contributed most significantly to the observed alterations after the rib raising intervention. The ART group showed significantly larger measurements for the JT interval, JT/QRS ratio, and JT index (JTi). Notably, the JT/QRS ratio demonstrated a statistically significant difference (p=0.0260), while the JTi closer toward significance (p=0.051).
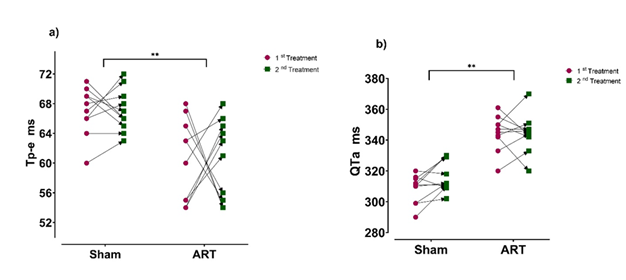
As shown in Figure 1, the segmental changes in the QT interval are depicted for participants randomly assigned to either the sham treatment or the ART treatment (first treatment). Following a sufficient washout period, participants underwent the alternative treatment in the second phase (second treatment). The later segment of the QT interval, referred to as Tp-e, demonstrated a significant shortening when compared to the sham control group. Conversely, the QTa length, which represents the early portion of the QT interval, was found to exhibit a significant increase. ANOVA demonstrated a statistically significant effect of ART on Tp-e intervals, F(2, 38) = 33.69, p < .001. Additionally, a significant effect was observed for QTa intervals, F (2, 38) = 3.179, p = .05, indicating that both cardiac parameters were influenced by the intervention.
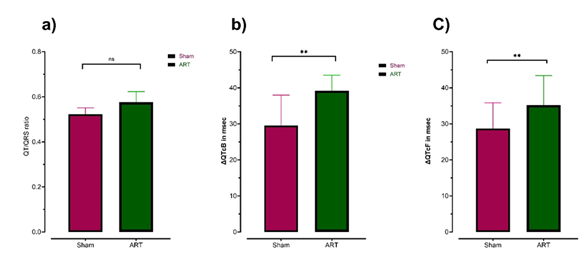
The effects of the intervention on cardiac electrophysiological parameters are summarized in Figure 2. Fig A shows the analysis of the QT/QRS ratio a validated marker of intrinsic cardiac electrical behavior (iCEB) revealed no statistically significant differences across study conditions (F(2, 38) = 0.1397, p = .132). This finding suggests that the intervention did not significantly alter the proportional relationship between depolarization (QRS duration) and repolarization (QT interval) phases, indicating preserved electrophysiological balance. In contrast, QTcB intervals (QT interval corrected via Bazett’s formula) demonstrated a significant increase compared to baseline control measurements (p < .05) as shown in Figure B. There was a robust statistical significance for the mean change in QTcB intervals (reported in milliseconds), with F (2, 54) = 27.94, p = .043. This indicates a pronounced intervention-associated prolongation of ventricular repolarization when using Bazett’s correction. For QTcF intervals (corrected via Fridericia’s formula), a statistically significant effect was also detected (F (2, 54) = 29.0, p = .041) as depicted in Figure C. These findings suggest that while both Bazett’s and Fridericia’s correction methods detected intervention-related changes in ventricular repolarization within the ART groups, the magnitude and implications of these effects differed markedly.
The left axis of the graph displays individual data points as a scatter plot, representing group means. The right axis shows the mean difference (ART – Sham) with a 95% confidence interval (CI). In graphs B and C, the CI crosses zero, indicating a statistically significant difference (p = 0.05). The effect size (mean difference ± SEM) is provided numerically. An independent two-tailed t-test showed no significant difference in post-treatment JT intervals between Sham and ART groups (t(38) = 2.755, p = 0.109). The JT/QRS ratio and JT index exhibited significant differences.
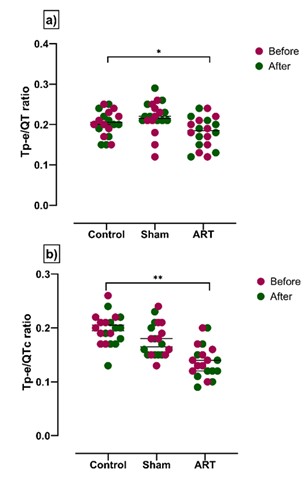
Figure 4 illustrates the changes in the duration of the late segment of the QT interval, comparing measurements before and after ART treatment. Both the Tp-e/QT and Tp-e/QTc ratios showed significant differences, with a more pronounced effect in the Tp-e/QTc ratio. The mean values were 0.2 ± 0.02 vs. 0.16 ± 0.01 for Tp-e/QT and 0.23 ± 0.02 vs. 0.15 ± 0.03 for Tp-e/QTc. These differences were statistically significant, with F(2, 57) = 9.054 (p = 0.051) for Tp-e/QT and F(2, 57) = 8.036 (p = 0.042) for Tp-e/QTc.
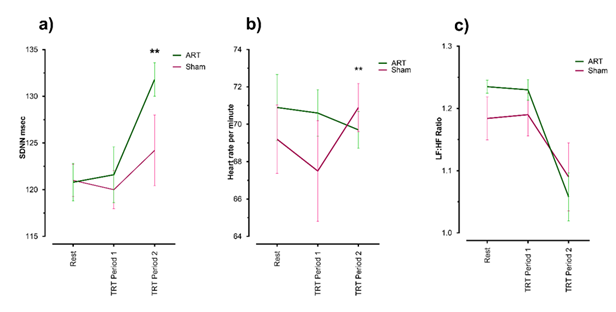
As shown in Figure 5, SDNN (Standard Deviation of Normal-to-Normal intervals) parameter, a key metric derived from HRV analysis, serves as a comprehensive indicator of ANS balance. A statistically significant improvements in SDNN values within the ART cohort. Sham group exhibited a mean SDNN of 121 ± 15.3 ms, while the ART group demonstrated a higher mean value of 132 ± 18.9 ms (Figure A). This 9.1% increase in SDNN among ART participants underscores a measurable shift toward enhanced parasympathetic modulation, suggesting that the therapeutic intervention may have effectively promoted ANS equilibrium. Figure B illustrates the observed changes in heart rate; however, substantial pre-existing variability within the groups may account for the lack of a statistically significant difference in heart rate reduction during ART administration. As shown in Figure C, an independent t-test revealed a statistically significant difference in the LF:HF ratio between the ART and Sham groups. The ART group had a lower mean ratio (M=1.23±0.089) compared to the Sham group (M=1.011±0.02, p=0.03).
5.Discussions
ART is reported to influence the sympathetic chain, as shown in studies by Tramontano et al. (2020) and Rechberger et al. [19,20]. These studies suggest that cranial osteopathic manipulative treatment can decrease cardiac sympathetic activity while increasing parasympathetic modulation. Additionally, OMT's effects on brain connectivity highlight its potential role in autonomic nervous system modulation. The study revealed functional connectivity changes post-treatment, indicating alterations in autonomic function. These findings are consistent with research highlighting the interaction between OMT and autonomic regulation, particularly through HR. These findings imply that OMT techniques can foster parasympathetic dominance while triggering sympathetic activation during specific phases of care. Some studies indicate a shift from initial sympathetic dominance to enhanced vagal activity, reflecting the dynamic nature of ANS responses to manual therapies. This supports the hypothesis that rib raising via articulatory methods may play a crucial role in influencing sympathetic activity, particularly in the early stages of the manipulation [21]. OMT appears to have the potential to both transiently increase sympathetic activity and subsequently promote parasympathetic dominance, leading to an intricate balance within the autonomic nervous system that can be beneficial for patient health.
The cold pressor test offers a robust ecological framework for examining heart rate modulation through sympathetic activation and parasympathetic reactivation. A study by Cuoco et al. (2016) and Romero et al. (2017) details the timeline of these autonomic responses, emphasizing the role of catecholamines in initiating immediate heart rate increases, followed by regulatory processes that restore homeostasis [23,24]. This dynamic interplay suggests that while sympathetic stimulation elevates heart rate, the reactivation of the parasympathetic nervous system begins almost immediately following the cessation of the stimulus. Although the rate of recovery can vary among individuals, it is generally observed that heart rate can return to baseline levels within one to two minutes after the cessation of sympathetic stimulation [25]. As previously reported and confirmed in this study, the uncorrected QT interval shows a dynamic relationship with heart rate, shortening as the rate increases and lengthening as it slows. Matching QT interval corrections with individual heart rate parameters can enhance the accuracy of QTc estimations aiming to provide a more accurate reflection of cardiac repolarization independent of the heart rate's influence [26]. The recovery of parasympathetic dominance following sympathetic stimulation is a pivotal element in the regulation of cardiovascular responses and overall ANS balance. During conditions such as physical exertion or acute stress, sympathetic outflow increases rapidly, leading to an elevated heart rate. This immediate response is critical for meeting the increased circulatory demands; however, the subsequent reactivation of parasympathetic tone is equally essential for restoring cardiac homeostasis and ensuring a timely deceleration of heart rate following the stressor [27,23]. The use of JT interval metrics, alongside QT interval measurements and ratios that reflect sympathetic and parasympathetic balance, has become increasingly significant in cardiac research [28,29 ,30]. The JT interval, which reflects the repolarization phase of the cardiac cycle and excludes the depolarization phase represented by the QRS complex, has been demonstrated to be a more consistent metric compared to the QT interval across various QRS durations. Studies suggests that the JT interval may yield more precise insights when evaluating the repolarization status of myocardial tissue, especially in cases of conduction abnormalities, as it separates repolarization dynamics from depolarization influences [31].
An increased JT/QRS ratio may signify a repolarization pattern or an improved myocardial recovery capacity post-depolarization, implying better overall cardiac function. [32]. It can be suggested that a higher JT/QRS ratio, coupled with the JT index, signifies strong electrical activity and an enhanced capacity for recovery after the ART intervention.
Studies have validated the connection between HRV parameters, such as iCEB and the QT/QRS ratio, and the activity of the parasympathetic nervous system [33,34,17]. Individuals who enhance their parasympathetic modulation through various therapeutic methods exhibit significant improvements in HRV metrics, reflecting better autonomic balance. A reduction in sympathetic output coupled with an increase in parasympathetic tone has been linked to positive cardiac outcomes, highlighting the importance of these measures in clinical practice as well.
It was previously observed that improved well-being and higher HRV levels in individuals signify the favorable impact of CPAP therapy on ANS function and respiratory drive [35,36]. The rise in SDNN indicates the overall balance of the autonomic nervous system, reflecting both sympathetic and parasympathetic factors [37 ]. The 9.1% increase in SDNN observed among ART participants in this study highlights a significant shift toward improved parasympathetic modulation, implying that the therapeutic intervention may have fostered ANS balance. The LF component of HRV is often interpreted as a measure predominantly influenced by sympathetic nervous system activity, while the HF component is mainly attributable to parasympathetic activity. [38,39,40]. The LF:HF ratio serves as a crucial indicator of sympathovagal balance, where a decreased ratio suggests either reduced sympathetic activity or enhanced parasympathetic activity. The drop observed in the LF:HF ratio in the study could result from either a decrease in LF or an increase in HF. The Tp-e interval and Tp-e/QT ratios show how the physiological states influence cardiac processes [41 ].Improved Tp-e intervals in this study align with prior findings linking shorter intervals to better cardiac outcomes and reduced arrhythmia risk. Additionally, the Tp-e/QT ratio, noted for its stability and its independence from heart rate and body weight supports its use as a reliable marker for ventricular repolarization dynamics [42,43].
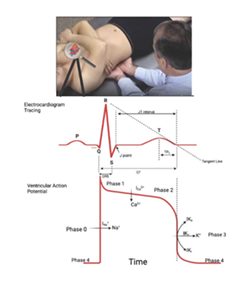
Phases of the Ventricular Action Potential: Phase 0: Rapid depolarization driven by the opening of voltage-gated sodium (Na+) channels (INa); Phase 1: Early repolarization caused by the transient outward potassium current (Ito) and the inactivation of INa; Phase 2: Plateau phase maintained by a balance between inward calcium (Ca²+) current (ICa,L) and outward potassium currents (IKr and IKs); Phase 3: Repolarization due to the sustained outward potassium current (IKr and IKs) and inactivation of Ica; Phase 4: Resting membrane potential maintained by the inward rectifier potassium current (IK1); Delayed Rectifier Potassium Channels (IKr and IKs): IKr (Rapid): Dominates early repolarization in Phase 3; IKs (Slow): Activates more slowly, contributing to repolarization during Phase 3, especially under conditions requiring prolonged action potential regulation.
The influence of vagal discharge on Phase 3 involves the cellular behaviors during the repolarization phase. Vagal stimulation, primarily mediated by acetylcholine acting on muscarinic receptors, results in a reduced heart rate and altered ion channel activity than can be induced [44]. The influence of RRT on QT interval dynamics observed in this study might have been mediated by cellular signaling pathways and cardiac physiological processes. As illustrated in Figure 6, RRT may impact the autonomic nervous system, with a notable effect on its parasympathetic component. The interplay between ART manipulations highlights a notable enhancement of vagal influence on the heart. This is supported by QT interval analysis, Tp-e parameters, and HRV measures, all indicating increased vagal activity following ART intervention.
6. Conclusions
The increased QTa interval and reduced Tp-e values indicate transient changes in repolarization dynamics following the intervention. This is further supported by changes in the heart rate-corrected QT interval (QTc), an increased JT/QRS ratio suggesting delayed repolarization, and a decreased Tp-e/QT ratio indicating a lower propensity for arrhythmias and a more synchronized repolarization process. These findings suggest that repolarization parameters are temporarily altered. Additionally, the elevated SDNN and reduced LH:FSH ratio post-intervention indicate improved vagal modulation. The ART intervention appears to transiently increase sympathetic activity and subsequently promote parasympathetic dominance, creating a balanced autonomic nervous system that can be beneficial for cardiac health.
7. Acknowledgement
We sincerely thank the student volunteers from Lake Erie College of Osteopathic Medicine in Elmira, NY, for dedicating their time to participate as subjects in this research.
8. Conflict of interest statement
The authors declare that they have no known competing financial interests or personal relationships that could have appeared to influence the work reported in this paper.
9. References
- Zipp CR, Semlitsch T, Tögel G, Krenn C, Loder C, et al. (2025). An overview of systematic reviews on the efficacy and safety of osteopathic techniques. Journal of Bodywork and Movement Therapies 42 (2025): 1186-1197.
- Ernst E, Posadzki P, Lee MS. Reflexology: An update of a systematic review of randomized clinical trials. Maturitas 68(2011): 116-120.
- Roura S, Álvarez G, Solà I, Cerritelli F. Do manual therapies have a specific autonomic effect? An overview of systematic reviews. PLOS ONE 16(2021): e0260642.
- Stepnik J, Czaprowski D, Kedra A. Effect of manual osteopathic techniques on the autonomic nervous system, respiratory system function and head-cervical-shoulder complex—A systematic review. Frontiers in Medicine 11 (2024): 1358529.
- Henderson AT, Fisher JF, Blair J, Shea C, Li TS, et al. Effects of rib raising on the autonomic nervous system: A pilot study using noninvasive biomarkers. Journal of Osteopathic Medicine 110(2010a): 324-330.
- Borges BLA, Bortolazzo GL, Neto HP. Effects of spinal manipulation and myofascial techniques on heart rate variability: A systematic review. Journal of Bodywork and Movement Therapies 22(2018a): 203-208.
- Yao S, Hassani J, Gagne M, George G, Gilliar W. Osteopathic manipulative treatment as a useful adjunctive tool for pneumonia. Journal of Visualized Experiments: JoVE 87 (2014a): 50687.
- Hevia JC, Antzelevitch C, Bárzaga FT, Sánchez MD, Balea FD, et al. Tpeak-Tend and Tpeak-Tend Dispersion as Risk Factors for Ventricular Tachycardia/Ventricular Fibrillation in Patients with the Brugada Syndrome. Journal of the American College of Cardiology 47(2006).
- Ohkubo K, Watanabe I, Okumura Y, Kofune M, Nagashima K, et al. Spatial and transmural repolarization, and dispersion of repolarization and late potentials evaluated using signal-averaged vector-projected 187-channel high-resolution electrocardiogram in Brugada syndrome. Journal of Arrhythmia 30 (2013).
- Antzelevitch C, Sicouri S, Diego JMD, Burashnikov A, Viskin S, et al. Does Tpeak–Tend provide an index of transmural dispersion of repolarization? Heart Rhythm 4 (2007).
- Zehir R, Karabay CY, Kalayci A, Akgün T, Kiliçgedik A, et al. Evaluation of Tpe interval and Tpe/QT ratio in patients with slow coronary flow. The Anatolian Journal of Cardiology 15 (2015).
- Torres YC. Ventricular repolarization markers for predicting malignant arrhythmias in clinical practice. World Journal of Clinical Cases 3 (2015).
- Antzelevitch C, Sicouri S, Diego JMD, Burashnikov A, Viskin S, et al. Does Tpeak–Tend provide an index of transmural dispersion of repolarization? Heart Rhythm 4 (2007).
- Piccirillo G, Moscucci F, D’Alessandro G, Pascucci M, Rossi P, et al. Myocardial repolarization dispersion and autonomic nerve activity in a canine experimental acute myocardial infarction model. Heart Rhythm 11 (2014).
- Zhang C, Dawen X, Yang L, Liu N, Jianghua Z, et al. Experimental study of the effect of autonomic nervous system on the transmural dispersion of ventricular repolarization under acute myocardial ischemia in vivo. Current Medical Science 22 (2002).
- Witczak R, Kachelmeyer J, Cummings K, Crasta M. Effects of Suboccipital Release Osteopathic Manipulation on Autonomic Nervous System: Insights from Short-Term QT Interval Measurements in Healthy Young Adults. Journal of Spine Research and Surgery 6 (2024): 41-51.
- Robyns T, Lu HR, Gallacher DJ, Garweg C, Ector J, et al. Evaluation of Index of Cardio-Electrophysiological Balance (iCEB) as a New Biomarker for the Identification of Patients at Increased Arrhythmic Risk. Annals of Noninvasive Electro cardiology 21(2015).
- Fornari M, Carnevali L, Sgoifo A. Single Osteopathic Manipulative Therapy Session Dampens Acute Autonomic and Neuroendocrine Responses to Mental Stress in Healthy Male Participants. Journal of Osteopathic Medicine 117(2017a).
- Tramontano M, Cerritelli F, Piras F, Spanò B, Tamburella F, et al. Brain Connectivity Changes after Osteopathic Manipulative Treatment: A Randomized Manual Placebo-Controlled Trial. Brain Sciences 10(2020).
- Rechberger V, Biberschick M, Porthun J. Effectiveness of an osteopathic treatment on the autonomic nervous system: A systematic review of the literature. European Journal of Medical Research 24(2019).
- Miller A, Gustin D, Wilson J, Johns J, Burch J, et al. Autonomic rehabilitation: Vagal and sympathetic impacts of modified occipitomastoid suture V-spread. PM&R 17(2025): 300-309.
- Henderson AT, Fisher JF, Blair J, Shea C, Li TS, et al. Effects of rib raising on the autonomic nervous system: A pilot study using noninvasive biomarkers. Journal of Osteopathic Medicine, 110(2010a): 324-330.
- Cuoco JA, Fennie CN, Cheriyan GK. Hypothetical Link Between Osteopathic Suboccipital Decompression and Neuroimmunomodulation. Journal of Neurology and Neuroscience 7 (2016).
- Romero SA, Minson CT, Halliwill JR. The cardiovascular system after exercise. Journal of Applied Physiology 122(2017): 925-932.
- GRAD C. Heart rate variability and heart rate recovery as prognostic factors. Clujul Medical 88(2015): 304-309.
- Desai M, Li L, Desta Z, Malík M, Flockhart DA (2003) Variability of heart rate correction methods for the QT interval. British Journal of Clinical Pharmacology 55 (2003).
- Qiu S, Cai X, Sun Z, Li L, Zuegel M, et al. Heart Rate Recovery and Risk of Cardiovascular Events and All-Cause Mortality: A Meta-Analysis of Prospective Cohort Studies. Journal of the American Heart Association 6(2017).
- Hnatkova K, Vicente J, Johannesen L, Garnett C, Strauss DG, et al. Heart rate correction of the J-to-Tpeak interval. Scientific Reports 9 (2019): 15060.
- Baumert M, Schlaich MP, Nalivaiko E, Lambert E, Sari CI, et al. Relation between QT interval variability and cardiac sympathetic activity in hypertension. American Journal of Physiology-Heart and Circulatory Physiology 300 (2011): H1412–H1417.
- Locati ET, Bagliani G, Padeletti L (2017) Normal ventricular repolarization and QT interval: Ionic background, modifiers, and measurements. Cardiac Electrophysiology Clinics 9(2017): 487-513
- Alizadeh A, Shahrbaf MA, Khorgami M, Zeighami M, Keikhavani A, et al. QTc interval measurement in patients with right bundle branch block: A practical method. Annals of Noninvasive Electro cardiology 28(2023): e13047.
- Hemmeryckx B, Feng Y, Frederix L, Lox M, Trenson S, et al. (2018). Evaluation of cardiac arrhythmic risks using a rabbit model of left ventricular systolic dysfunction. European Journal of Pharmacology 832 (2018): 145-155.
- Kaya H, Suner A, Koparal M, Yucetas SC, Kafadar S. Evaluation of Tp-e interval, Tp-e/QT ratio and index of cardiac-electrophysiological balance in patients with tinnitus. BMC Cardiovascular Disorders 21(2021): 415.
- Ozturk U, Ozturk O. Index of cardio-electrophysiological balance and Parkinson disease. Medicine, 102 (2023): e35075.
- Vasilkova T, Fiore VF, Clum A, Wong A, Kabir N, et al. Assessment of Autonomic Nervous System Activity Using Spectral Analysis of Heart Rate Variability After Continuous Positive Airway Pressure (CPAP) Therapy in Patients with Sleep Apnea. Cureus.
- Crasta M, Alam Z, Lakhani S (2023) Modulation of Respiratory Neural Drive by Physiological Loads in COVID-19 Patients with Dyspnea. Neuroscience and Medicine 14 (2023): 29-46.
- Chaswal M, Kapoor R, Batra A, Verma S, Yadav BS. Heart Rate Variability and Cardiovascular Reflex Tests for Assessment of Autonomic Functions in Preeclampsia. International Journal of Hypertension 2018.
- Shiga K, Izumi K, Minato K, Sugio T, Yoshimura M, et al. Subjective well-being and month-long LF/HF ratio among desk workers. Plos One 16 (2021).
- Usui H, Nishida Y. The very low-frequency band of heart rate variability represents the slow recovery component after a mental stress task. Plos One 12 (2017).
- Kataoka K, Tomiya Y, Sakamoto A, Kamada Y, Hiramatsu Y, et al. Altered autonomic nervous system activity in women with unexplained recurrent pregnancy loss. Journal of Obstetrics and Gynecology Research 41 (2014).
- Cekirdekci EI, Bugan B. Can abnormal dispersion of ventricular repolarization be a predictor of mortality in arrhythmogenic right ventricular cardiomyopathy: The importance of Tp-e interval. Annals of Noninvasive Electro cardiology 24(2019): e12619
- Ucar FM, Ozturk C, Yilmaztepe MA. Evaluation of Tp-e interval, Tp-e/QT ratio and Tp-e/QTc ratio in patients with acute myocarditis. BMC Cardiovascular Disorders 19(2019): 232.
- Alsancak Y, Gürbüz AS, Sakli B, Içli A (2019) Evaluation of index of cardio-electrophysiological balance and Tp-e/QT ratio in patients with coronary artery ectasia. Journal of Surgery and Medicine 3(2019): 223-226.
- Abramochkin DV, Tapilina SV, Sukhova GS, Nikolsky E. Functional M3 cholinoreceptors are present in pacemaker and working myocardium of murine heart. Pflügers Archiv - European Journal of Physiology 463(2012).


 Impact Factor: * 5.6
 Acceptance Rate: 74.36%
  Time to first decision: 10.4 days
  Time from article received to acceptance: 2-3 weeks