Reduced Glutathione Decreases Cell Adhesion and Increases Cell Volume
Alain Géloën1* and Emmanuelle Berger1
1Université de Lyon, UMR Ecologie Microbienne, CNRS 5557, INRA 1418, VetAgro Sup, Université Claude Bernard Lyon 1, Doua campus, Dubois Bldg, 2nd floor, 69622 Villeurbanne cedex, France
*Corresponding author: Alain Géloën, Université de Lyon, UMR Ecologie Microbienne, CNRS 5557, INRA 1418, VetAgro Sup, Université Claude Bernard Lyon 1, Doua campus, Dubois Bldg, 2nd floor, 69622 Villeurbanne cedex, France.
Received: 29 July 2022; Accepted: 08 August 2022; Published: 23 September 2022
Article Information
Citation: Alain Geloen and Emmanuelle Berger. Reduced Glutathione Decreases Cell Adhesion and Increases Cell Volume. Archives of Clinical and Biomedical Research 6 (2022): 880-888.
View / Download Pdf Share at FacebookAbstract
Glutathione is the most abundant thiol in animal cells. Reduced glutathione (GSH) is a major intracellular antioxidant neutralizing free radicals and detoxifying electrophiles. It plays important roles in many cellular processes, including cell differentiation, proliferation, and apoptosis. In the present study we demonstrate that extracellular concentration of reduced glutathione markedly increases cell volume within few hours, in a dose-response manner. Pre-incubation of cells with BSO, the inhibitor of γ-glutamylcysteine synthetase, responsible for the first step of intracellular glutathione synthesis, did not change the effect of reduced glutathione on cell volume, suggesting a mechanism limited to the interaction of extracellular reduced glutathione on cell membrane. Similarly, inhibition of γ-glutamylcyclotransferase involved in intracellular glutamate production, essential for intracellular production of glutathione, had no effect on the action of reduced glutathione. Oxidized glutathione exerted no effect on cell volume. Results show that GSH decreases cell adhesion resulting in an increased cell volume. Since many cell types are able to export GSH, the present results suggest that this could be a fundamental self-regulation of cell volume, giving the cells a self-control on their adhesion proteins.
Keywords
<p>A549; Cell Volume; Cell Adhesion; Glutathione; Holomonitor; xCELLigence</p>
Article Details
1. Introduction
Oxidative stress results from an imbalance between reactive oxygen species production (ROS) and the abilities of biological systems to eliminate them. In that context, reduced glutathione (GSH) is the central redox agent in most aerobic organisms and a fundamental player in the fine regulation of oxidative stress. GSH is involved in numerous vital functions such as detoxifying electrophiles, scavenging free radicals, maintaining the thiol status of proteins, providing cysteine, modulating DNA synthesis, microtubular-related processes, nitric oxide homeostasis, and the activity of neuromodulators as well as immune functions (reviewed in [1]). As a result, GSH plays important roles in cell metabolism, differentiation, proliferation [2] and apoptosis. Disturbances in GSH homeostasis are implicated in numerous human diseases, including cancer, pathologies associated to aging, cardiovascular, inflammatory, immune degenerative diseases [3]. Although GSH is present in the extracellular fluid, it cannot be directly uptaken by cells [1, 3]. It is degraded by cells expressing the ectoprotein γ-glutamyl transpeptidase to produce dipeptides and free amino-acids uptaken by cells and used for de novo GSH synthesis. GSH is a tripeptide (γ-L-glutamyl-L-cysteinylglycine) synthesized by two cytosolic ATP dependent enzymes: glutamate cysteine ligase (GCL) leading to the production of γ-glutamyl-cysteine from glutamate and cysteine and glutathione synthetase (GS) involved in the ligation of γ-glutamyl-cysteine to glycine to produce γ-glutamylcysteinylglycine. Cellular redox regulation are crucial in cell-matrix interaction [4]. Adhesion between cells and extracellular matrix is under the control of integrins. They have been identified as a target of redox-regulation by ROS [5]. Indeed all integrins contain a large number of cysteine residues in their ectodomains. The protein disulfide isomerase (PDI) regulates integrin-mediated activities, including adhesion. Blocking PDI inhibits adhesion [4, 6, 7]. Redox agents such as glutathione were shown to regulate the function of integrins [8, 9]. Integrins connect the extracellular matrix to the actin cytoskeleton. It has been suggested that integrins serve as cell volume sensors [10, 11]. Despite the described effects of redox on integrins, the effets of reduced glutathione on cell volume has never been reported so far. The present study relates experimental results pointing out the effect of reduced glutathione on cell volume, using different methods. Implications of such a new effect of reduced glutathione will be discussed in the light of recent data from the litterature.
2. Materials and Methods
2.1 Cell Culture
Human lung carcinoma A549 cells, were grown in Dulbecco’s Modified Eagle’s Medium with low glucose (1g/L) containing 10% fetal calf serum (DMEM 10% FCS, PAA Laboratories, Canada), streptomycin plus penicillin (100 units/mL; Sigma Aldrich, St Quentin-Fallavier, France). Before experiment, cells were dissociated by trypsin (0.05%, Sigma Aldrich) and cell concentration measured using a Sceptor pipette (Millipore, Burlington, USA). Cells were seeded at 5000 cells/cm2 in either E-96 plates or in 96 well plates. .
2.2 Chemicals
Reduced glutathione, buthionine sulfoximine (BSO) and TRITC-phalloïdin were purchased from Sigma-Aldrich. BSO is an effective and specific inhibitor of γ-glutamylcysteine synthetase, the enzyme of the first step in glutathione synthesis [12]. Zombie Red was purchased from Ozyme (Saint-Cyr L'Ecole, France). Intracellular concentration of glutathione was measured using the GSH-Glo™ Glutathione Assay from Promega. Pro-GA (Funakoshi Co., Ltd) is a new, pro-drug type inhibitor of γ-glutamylcyclotransferase (GGCT, EC 2.3.2.4), is part of the gamma-glutamyl cycle, which catalyzes the degradation of (5-L-glutamyl)-L-amino acid into 5-oxoproline + L-amino acid. 5-oxoproline is a precursor of glutamate, essential for intracellular production of glutathione.
2.3 Measurement of Cytotoxicity
2.3.1 Real-Time Cell Analysis of Impedance: Real-time cell analysis xCELLigence biosensor (RTCA, Agilent, Santa Clara, USA) measures cell surface occupancy (i.e. by impedance measurement), expressed as cell index. It takes into account cell number, cell size and adhesion force. Cells were grown until cell index reached around one (i.e. linear proliferative phase), which may take between 48 to 72 hours. Then culture medium was replaced by a fresh one containing either reduced glutathione and/or different inhibitors. The impedance was recorded every 15 min in a standard 37°C cell culture incubator with 5% CO2.
2.3.2 Quantitative Phase Imaging: Quantitative phase imaging was performed using the Holomonitor M4 digital holographic cytometer (DHC) from Phase Holographic Imaging (PHI, Lund, Sweden). The microscope was housed in a standard 37°C cell culture incubator with 5% CO2. Average optical cell volumes were measured in real-time every ten minutes during ten hours in control and after GSH addition.
2.3.3 Cytometry: For cell toxicity assay, at the end of experiments, living cells were incubated during 15 min at 37°C in the presence of Zombie Red (1/1000) according to the manufacturer's procedure (Ozyme) then trypsinized and fixed in PBS with formalin 3% (Sigma Aldrich). For F-actin quantification, at the end of experiment, cells were trypsinized then fixed with PBS/formalin 3% and incubated with PBS/Triton 0.1%/TRITC-phalloïdin 1 μg/mL (Sigma Aldrich) during 5 min. Cell count and fluorescence analyses were performed onto a Novocyte cytometer (Novocyte flow cytometer, Acea Biosciences, San Diego, USA) on at least 4 replicates.
2.3.4 Measurement of Oxidative Stress: After treatment cells were trypsinized and fixed with formalin 10% (Sigma, Saint-Quentin Fallavier, France). After 20 min incubation at 4°C, cells were centrifuged at 1000 rpm for 5 min (Eppendor 5910R, Hambourg, Germany). The pellet was dissolved in 100 μL of dihydrorhodamine 123 (DHR) 1x diluted in PBS Triton 0.1%. The cells were incubated with the DHR solution for a minimum of 15 min at room temperature in the dark. After incubation, cells were analyzed with FACS (Novocyte flow cytometer, Acea Biosciences, San Diego, USA). Data were collected using the Software NovoExpress (Acea Biosciences, San Diego, USA) and manually analyzed using Excel.
2.4 Statistical Analysis
Data presented are representative experiments performed at least in triplicates, as mean values ± SEM. Statistical analysis was performed with StatView 4.5 software (Abacus Corporation, Baltimore, USA) for Windows, the data were analyzed using one-way ANOVA followed by Fisher’s protected least significance difference [PLSD] post hoc test. Significance level was accepted at p < 0.05.
3. Results
3.1 Effect of Increasing Concentrations of Reduced Glutathione on Cell Index
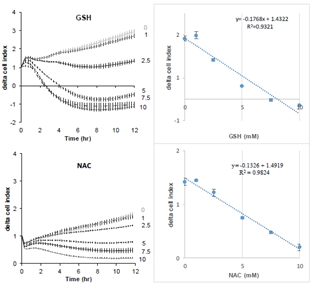
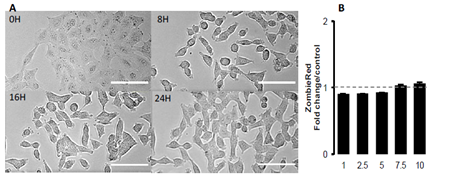
Figure 1 shows the effect of increasing concentrations of GSH on the cell index of lung epithelial cell A549. Cells showed a dose-dependent decrease of cell index in response to increasing GSH concentrations (Figure 1A). Exposure to increasing NAC concentrations also induced a dose-dependent reduction of cell index, although reduced compared to the effects of GSH (Figure 1B). The xCELLigence biosensor system allows the continuous measurement of cell index which is in fact an impedance, it depends on cell number and surface occupied by cells, and on adhesion strength of cells to the substrate. Significant decrease in cell index may sign cell death or cell adhesion reduction. To further understand the effect of glutathione, we observed whether glutathione decreased cell number. A 24 hour image acquisition showed that 10 mM glutathione did not induced cell death. Figure 2A shows micrographs obtained before and 8, 16, 24 hours after exposure to 10 mM GSH. No cell death was observed but instead a marked cell surface reduction over time is obvious at 8, 16, 24 hours (Figures 2A). Furthermore, cell labeling with Zombie Red, a fluorescent marker of cells with permeable cell membrane related to cell death induction, confirmed that glutathione did not altered cell integrity even at high concentrations (Figure 2B).
Figure 1: Real-time evolution of delta cell index in response to increasing concentrations of reduced glutathione (top) or NAC (down) on A549 pulmonary cells. Cell index was normalized at the time of treatment. Data are presented as mean cell indexes ± SEM during time (left panel) and correlation curves 8 hours after treatment (right panels), n=8 replicates.
Figure 2: Morphological changes induced by GSH in A549 cells. A: Contrast phase photomicrographs at times 0, 8h, 16h and 24h of a time-lapse in presence of 10 mM GSH. No image of dead cell is visible. Compared to time 0, cell surfaces were reduced at times 8h, 16h and 24h. Scale bar represents 100μm. B: Cell permeability to Zombie Red analyzed by fluorescence quantification in cytometry 2.5 hours after treatment, in a dose-dependent response to GSH (mM). Data are presented as mean of fold changes in Zombie Red fluorescence intensity in GSH treated cells versus control media (n=4).
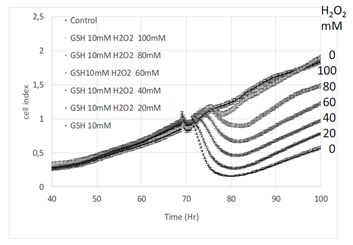
To state whether the observed effects resulted from reduced or oxidized gluthatione, GSH was challenged by hydrogen peroxide. Increasing concentrations of hydrogen peroxide were added in the culture medium in presence of 10 mM GSH. The addition of hydrogen peroxide decreased the effect of GSH proportionnally to its concentration (Figure 3). Interestingly ten times more hydrogen peroxide was necessary to completely neutralize the effect of 10 mM GSH.
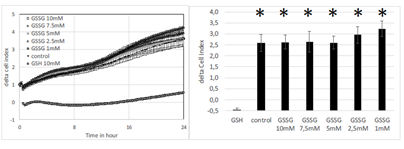
In another set of experiments, we investigated the effect of oxidized glutathione on cell index. There was no sigificant effect of oxidized glutathione on cell index (Figure 4, left panel). Delta cell index (final minus initial values after 24 hours) showed no significant difference according to the concentration of oxidized glutathione while GSH at 10 mM markedly decreased cell index on the same plate (Figure 4 right panel).
Figure 4: Effect increasing concentrations of glutathione either oxidized (1, 2.5, 5, 7.5 and 10 mM) or reduced (10mM) on real-time cell index evolution of A549 cells (left panel). Delta cell index (final-initial values of cell index after 24 hours) following addition of glutahthione. Addition of oxidized glutathione did not decrease cell index of A549 cells compared to control. Results are presented as mean ± SEM (n=8). Stars indicate significant difference compare to GSH at p<0.05. When not visible SEM are smaller than the symbol.
3.2 Effects of Increasing Concentrations of GSH on Cell Volume
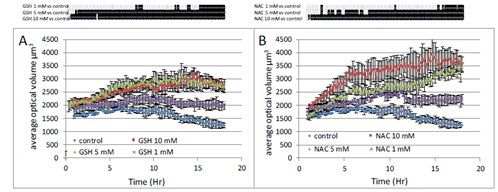
To further quantify cellular changes observed in response to GSH, we used the label-free single-cell analysis microscope Holomonitor (Phase Holographic Imaging, PHI, Lund, Sweden). The average optical volume of cells significantly increased in response to GSH (Figure 5A). That increase was dose-dependent and was already observable in response to 1 mM GSH. Similar results were obtained in response to NAC (Figure 5B).
Figure 5: Real-time analysis of A549 cell size modifications induced by GSH (A) or NAC (B). Three different concentrations have been tested 1, 5 and 10 mM. Proliferative 549 cells were monitored on Holomonitor microscope during 18 hours. Average optical thickness of cells were registered every 10 min. Data are presented as mean values ± SEM of 4 wells with 20 cells/well. Upper part, black lines indicate significative difference compared to control at p<0.05 following one-way ANOVA analysis and Fisher’s protected least significance difference post-hoc test.
3.3 Inhibition of Intracellular Synthesis of GSH did not impair its Extracellular Action
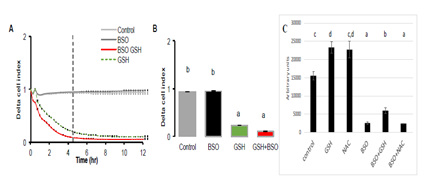
In the next experiment, buthionine sulfoximine (BSO, 10mM), the inhibitor of γ-glutamylcysteine synthetase was added during 24 hours to A549 cell culture (Figure 6). The inhibitor alone did not change cell proliferation. It had no effect on GSH action since the same inhibitory effect was observed in response to 10 mM in presence as well as in absence of BSO. Indeed, cell index reached values close to zero after GSH addition despite the presence of BSO. The fact that the inhibitor of γ-glutamylcysteine synthetase did not alter the response to GSH is of importance, since it demonstrates that the increase in intracellular GSH concentration is not required to reduce the cell index. This is confirmed by the measure of intracellular concentration of GSH which was significantly decreased after BSO (Figure 6C). Decreased intracellular GSH concentration by BSO did not hampered its effect on cell index when added in the culture medium.
Figure 6: Realtime analysis of the effect of GSH (10 mM) in presence of γ-glutamylcysteine synthetase specific inhibitor, buthionine sulfoximine (BSO) on 549 cells. A549 cells were pre-incubated with BSO (10 mM) during 24 hr. Then GSH 10 mM was added either alone or in presence of BSO. A: the graph shows a similar response between cells pre-incubated with BSO or not, suggesting that the decrease in cell index is not dependent of the intracellular concentration of GSH. Similarly, BSO had no effect on control. B: histogram of delta cell indexes of control cells or cells exposed to BSO alone or GSH + BSO. C: Intracellular GSH con-centrations after 24 hours exposure of A549 cells to GSH or NAC (10 mM) or 24 hours to BSO (10mM) and then 24 hours to BSO+GSH or BSO+NAC. Results are presented as mean ± SEM. Different letters indicate significative differences after one way ANOVA followed by Fisher PLSD at p<0.05.
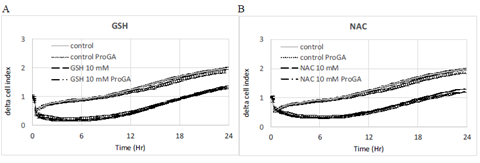
Figure 7: Effect of ProGA, a γ-glutamylcyclotransferase inhibitor (GCCT) involved in glutathione metabolic cycle. The inhibition of GGCT decreases the intracellular concentration of GSH. ProGA (100 μM) has no effect on control, GSH (A) or NAC (B). Data are presented as mean delta cell indexes +/-SEM (n=8).
Pro-GA is a pro-drug type of N-glutaryl-L-alanine, which penetrates into cells and inhibits the γ-glutamylcyclotransferase (GGCT) which catalyzes the chemical reaction (5-L-glutamyl)-L-amino acid to produce 5-oxoproline and L-amino acid. 5-oxoproline is a precursor of glutamate. The inhibition of GGCT decreases the intracellular production of GSH. Results show that the ProGA has no effect on delta cell index either in control or on the effect of GSH or NAC (Figure 7) on cell index.
3.4 Effects of Increasing GSH Concentrations on Cell Adhesion
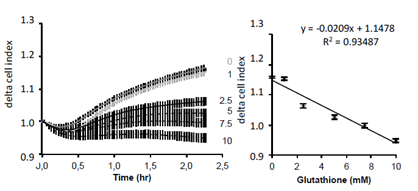
Since the previous experiment argued for an extracellular effect of GSH, we next tested whether it may affect cell adhesion. Cell adhesion monitoring on xCELLigence has been previously demonstrated and can be assessed in short time experiments [13, 14]. After trypsination, increasing concentrations of GSH were added to cell suspension in DMEM. Then cell adhesion was measured on xCELLigence biosensor. Results show an inverse correlation between GSH concentration and cell adhesion, the highest GSH concentrations corresponding to the lowest cell adhesion (Figure 8).
Figure 8: Realtime analysis of GSH effect on A549 cell adhesion. A549 cells were loaded at 5000 cells/cm2. Results are presented as mean delta cell indexes ± SEM (normalization to time of loading) during 2.5 hours (left panel). Corelation curve presented in right panel indicates a strong corelation between GSH concentrations and the decrease in adhesion measured by the cell index (n=8).
3.5 Effects of Increasing Concentrations of GSH on Cell Cytoskeleton
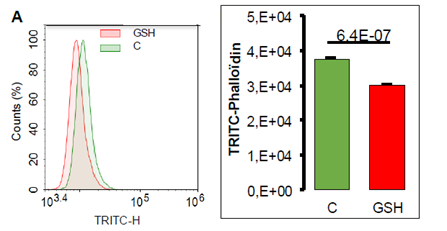
The decreased cell adhesion by GSH may reflect intracellular modifications such as actin polymerization. To test that hypothesis we used phalloïdin, the toxin found in cap mushroom, known to bind specifically at the interface of F-actin subunits. FACS analysis of A549 cells labeled with fluorescent TRITC-phalloïdin shows a decreased incorporation of fluorescently labeled molecule following 24 hour GSH treatment in A549 cells attesting a decrease in F-actin (Figure 9).
Figure 9: Quantification of TRITC-phalloïdin by cytometry in A549 cells exposed to GSH 10 mM during 24 hours. A- Representative histogram of cell number repartition according to fluorescence incorporation. B- TRITC-phalloïdin fluorescence quantification according to treatment (mean values +/SEM, n=4) with significant Student t-test p-value (p<0.05).
3.6 Effects of Exposure to Increasing GSH Concentrations on Oxidative Stress and its Intracellular Concentration
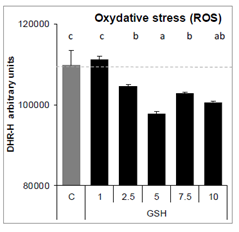
Exposure of A549 cells to GSH for 24 hours reduced oxidative stress from 2.5 to 10 mM, compare to control cells (Figure 10).
4. Discussion
The present results show a marked effect of GSH on cell volume. Following the addition of GSH in the culture medium, the decrease in cell index is fast and marked reaching almost basal values, occurring within 2-3 hours (Figure 1A). The decrease in cell index is dose-dependent to GSH concentration (Figure 1). Similar effects are observed in response to NAC, although reduced in amplitude compare to GSH (Figure 1). GSH markedly reduced cell index, the visual control using microscopy certified the absence of dead cell (Figure 2A). Furthermore, cells maintained their membrane integrity, attested by Zombie red labeling (Figure 2B). Finally, the decrease in cell index is reversible. Indeed, after longer time exposure to GSH, cell indexes slowly increase (Figure 3, 4 and 7). After washing out, the cell index increased markedly without fully reaching the control values (not shown). On xCELLigence, the cell index depends on the surface occupied by cells but also on cell adhesion strength. Since cell number is constant the only one explanation for the decreased cell index is that cell adhesion is affected by GSH. Real-time analysis using the quantitative phase contrast microscope Holomonitor M4, confirmed that GSH did not kill cells but resulted in a marked increase in average optical cell volume (Figure 5). That increase is dose-dependent. A designed experiment on xCELLigence biosensor dedicated to the measure of cell adhesion shows a dose-response to GSH on A549 cell adhesion, thus strongly arguing for a diminished cell adhesion force induced by GSH, which is confirmed by a reduction of F-actin required for integrin clustering needed for cell adhesion (review in [15]). Whether GSH regulates cell adhesion through extracellular action rather than increased intracellular contents was supported by the extremely fast cell adhesion force reduction observed in real-time experiments. Indeed, a significant effect was detected within few minutes even at low concentrations after GSH addition. In order to test a possible effect of intracellular glutathione synthesis, buthionine sulfoximine (BSO), a specific inhibitor of γ-glutamylcysteine synthetase, was used to block the first step of intracellular glutathione synthesis. BSO at 10 mM significantly decreased intracellular GSH concentration, even after incubation with 10 mM gluthatione (Figure 6C). BSO alone did not significantly change the cell index of A549 cells (Figure 6). Pre-incubation of A549 during 24 hours with BSO before GSH addition, did not change the decrease in cell index produced by GSH alone, despite the very low intracellular GSH concentration (Figure 6C). It implies that GSH exerts its reducing effect on cell adhesion independently of its intracellular concentration. A second inhibitor was used to state the effect of intracellular GSH. Pro-GA inhibits the γ-glutamylcyclotransferase (GGCT) which produces 5-oxoproline a glutamate precursor. Here again, the inhibition of intracellular GSH production had no impact on the effect of GSH on cell index, arguing for an extra-celullar action (Figure 7A). Similar results are observed with NAC (Figure 7B). Since GSH can be easily oxidized, the effect of oxidized glutathione was also tested on cell index. Results are clear, oxidized glutathione did not decrease cell index (Figure 4). The reduction of cell index is triggered by GSH (Figure 4). In another set of experiments, GSH was oxidized by increasing concentrations of hydrogen peroxide (Figure 3). A perfect dose-response was obtained on cell index by GSH. It is noticeable that ten times more hydrogen peroxide was necessary to fully antagonize the effect of GSH. This may lie from the fact that hydrogen peroxide is highly reactive and not specific to GSH. Concerning the mechanism involved in the action of GSH on cells, data from the literature show that both GSH and N-acetylcysteine (NAC) are disulphide breaking agent [16, 17]. NAC produces similar effects as GSH on cell index, average optical volume (Figure 1 and 5) and phalloïdin labeling (results not shown). Disulfide bonds formed by the oxidation of two cysteine residues to give cystine are essential for the stability of secreted and plasma-membrane proteins (reviewed in [18]). Their cleavage is also of most importance to regulate secreted proteins such as thrombospondin, an extracellular glycocoprotein involved in cell-matrix adhesion. The role of disulfide bounds in the stability of focal adhesion proteins are largely depicted in the control of cell surface receptors [19] as well as the role of extracellular protein disulfide isomerases in the regulation of integrins, in platelet adhesion and thrombosis [10] and more recently in cancer cell migration and invasiveness [8, 20]. In breast cancer cells, the regulation of disulfide exchanges, mostly involving integrins, controls transendothelial migration of cancer cells. Such mechanism has been demonstrated using several free thiols blocking agents and/or protein disulfite isomerase inhibitors. The effect of reduced glutathione rises numerous questions. The GSH concentrations used in the present study are high. Some experiments have been performed with 10 mM but several experiments have tested dose-responses effects from 1 to 10 mM. Significant effects of GSH are observable at much lower concentrations than 10 mM. It is the case for xCELLigence cell index which is a highly sensitive method, allowing to detect and quantify cell adhesion modifications in shorter times (few minutes) than fluorescence imaging or cytometry in TRITC-phalloïdin labeled cells (2.5H). Several studies have reported rather high intracellular GSH concentrations, for example in liver cells it reaches 10 mM [3]. Plasma and extracellular pools of GSH are much lower than the intracellular pool, around 1-10 μM at the exception of bile 10 mM and alveolar lining fluid, 400-800 μM [3, 21, 22, 23]. Present results also rise question on the true extracellular GSH concentration. Indeed, if GSH combines with disulfide bridges on extracellular proteins, it is obvious that its extracellular concentration drops, but then the extracellular GSH concentration takes into account only free GSH, which cannot be used as a reference for GSH excreted by cells. Export of GSH out of cells was observed in several cell types: human lymphoid cells, skin fibroblasts and macrophages suggesting that it is a commune feature. It may reduce compounds in the immediate environment of the cell and might protect cells [23]. Present results demonstrate that it can also control cell adhesion. Cell adhesion is mediated through integrins, a family of a/b heterodimeric molecules responsible for cell–matrix and cell–cell interactions. Integrins are subject to redox dependent conformational changes resulting in alterations of their binding activity [6]. All integrins contain a large number of cysteine residues in their ectodomains. The breakage of disulfide bonds in integrins by reducing agents can induce their activation [10, 24, 25]. Integrin activation by thiol-disulfide was described on αVβ3, αIIbβ3, integrin subunit α11 and β1 integrin [20]. Furthermore, the protein disulfide isomerase (PDI) which catalyzes the formation and breakage of disulfide bonds between cysteine residues within proteins, can directly interacts with integrins, mediating disulfide-thiol exchange, resulting in conformational changes and activation. PDI can be found on the surface of several cell types, including fibroblasts [20]. More recently Passam et al. [26] showed that breaking the disulfide bond changed the aIIbb3 integrin’s structure so that it lets go of fibrinogen in activated platelet.
5. Conclusions
The present study demonstrates that GSH has a major impact on cell adhesion. That decrease in cell adhesion results in an increased cell volume. That rises the hypothesis that GSH produced by cells can exert a direct control on cell adhesion and cell volume. Such a hypothesis adds a new function to glutathione which will necessitate a re-evaluation of cell adhesion functions according to their redox-state.
References
- Lu SC. Regulation of glutathione synthesis. Mol. Aspects Med 30 (2009): 42-59.
- Pallardó FV, Markovic J, García JL, et al. Role of nuclear glutathione as a key regulator of cell proliferation. J.Mol Aspects Med 30 (2009): 77-85.
- Ballatori N, Krance SM, Marchan R, et al. Plasma membrane glutathione transporters and their roles in cell physiology and pathophysiology. Mol. Asp. Med 30 (2009): 13-28.
- Rosenberg N, Mor-Cohena R, Hazan Sheptovitsky V, et al. Integrin-mediated cell adhesion requires extracellular disulfide exchange regulated by protein disulfide isomerase. Experimental Cell Research 381 (2019): 77-85.
- Eble J A, de Rezende FF. Redox-relevant aspects of the extracellular matrix and its cellular contacts via integrins. Antioxid Redox Signal 20 (2014): 1977-1993.
- Lahav J, Gofer-Dadosha N, Luboshitza J, et al. Protein disulfide isomerase mediates integrin-dependent adhesion. FEBS letters 475 (2000): 89-928.
- Stojak M, Milczarek M, Kurpinska A, et al. Protein Disulphide Isomerase A1 Is Involved in the Regulation of Breast Cancer Cell Adhesion and Transmigration via Lung Microvascular Endothelial Cells. Cancers (Basel) 2 (2020): 2850-2872.
- Ball C, Vijayan KV, Nguyen T, et al. Glutathione regulates integrin alpha(IIb)beta(3)-mediated cell adhesion under flow conditions.Thromb Haemost 100 (2008): 857-863.
- Mor-Cohen R. Disulfide Bonds as Regulators of Integrin Function in Thrombosis and Hemostasis. Antioxid Redox Signal 24 (2016): 16-31.
- Haussinger D, Reinehr R, Schliess F. The hepatocyte integrin system and cell volume sensing. Acta Physiol (Oxf) 187 (2006): 249-255.
- Lambert IH, Hoffmann EK, Pedersen SF. Cell volume regulation: physiology and pathophysiology. Acta Physiol (Oxf) 194 (2008): 255-282.
- Griffith OW, Meister A. Potent and specific inhibition of glutathione synthesis by buthionine sulfoximine (S-n-butyl homocysteine sulfoximine). J. Biol. Chem 254 (1979): 7558-7560.
- Agaësse G, Barbollat-Boutrand L, Sulpice E, et al. A large scale RNAi screen identifies LCMR1 as a critical regulator of Tspan8-mediated melanoma invasion. Oncogene 36 (2017): 446-457.
- El Kharbili M, Robert C, Witkowski T, et al. Tetraspanin 8 is a novel regulator of ILK-driven β1 integrin adhesion and signaling in invasive melanoma cells. Oncotarget 7-8 (2017): 17140-17155.
- Kechagia JZ, Ivaska J, Roca-Cusachs P. Integrins as biomechanical sensors of the microenvironment. Nat Rev Mol Cell Biol 20 (2019): 457-473.
- Aldini G, Altomare A, Baron G, et al. N-Acetylcysteine as an antioxidant and disulphide breaking agent: the reasons why. Free Radic Res 52 (2018): 751-762.
- Koo H, Hahn SK, Yun SH. Controlled Detachment of Chemically Glued Cells. Bioconjug Chem 16 (2016): 2601-2604.
- Trivedi MV, Laurence JS, Siahaan TS. The role of thiols and disulfides on protein stability. Current protein and Peptide Science 10 (2009): 614-625.
- Hogg N, Laschinger M, Giles K, et al. T-cell integrins: more than just sticking points. J Cell Sci 16 (2003): 4695-4705.
- Popielarski M, Ponamarczuk H, Stasiak M, et al. Modifications of disulfide bonds in breast cancer cell migration and invasiveness. Am J Cancer Res 9 (2019): 1554-1582.
- Cantin AM, North SL, Hubbard RC, et al. Normal alveolar epithelial lining fluid contains high levels of glutathione. J. Appl. Physiol 63 (1987): 152-157.
- Stenzel JD, Welty SE, Benzick AE, et al. Hyperoxic lung injury in Fischer-344 and Sprague–Dawley rats in vivo. Free Radical Biol. Med 14 (1993): 531-539.
- Meister A, Anderson ME. Glutathione. Annu Rev Biochem 52 (1983): 711-760.
- Yan B, Smith JW. Mechanism of integrin activation by disulfide bond reduction. Biochemistry 40 (2001): 861-867.
- Zhang K, Pan Y, Qi J, et al. Disruption of disulfide restriction at integrin knees induces activation and ligand-independent signaling of α4β7. J Cell Sci 126 (2013): 5030-5041.
- Passam F, Chiu J, Ju L, et al. Mechano-redox control of integrin de-adhesion. Elife 7 (2018): e34843.


 Impact Factor: * 5.8
 Acceptance Rate: 71.20%
  Time to first decision: 10.4 days
  Time from article received to acceptance: 2-3 weeks