The Association between Mean Platelet Volume and Albuminuria in Patients with Type 2 Diabetes Mellitus at King Abdul-Aziz Medical City, Jeddah 2020
Abdullah M Alzahrani1,2, Alaa A Alesa2, Aisha E Yaghmour2, Muhammad Anwar Khan3, Abdullah A Alesa4
1Primary Health Care Department, Ministry of the National Guard - Health Affairs, Jeddah, Saudi Arabia
2College of Medicine, King Saud Bin-Abdul-Aziz University for Health Sciences, Ministry of National Guard, Jeddah, Saudi Arabia
3Medical Education department, College of Medicine, King Saud bin Abdulaziz University for Health Sciences, Jeddah,
4King Abdulaziz Medical City, Ministry of National Guard, Jeddah, Saudi Arabia
*Corresponding author: Abdullah A Alesa, College of Medicine, King Saud Bin Abdulaziz University for Health Sciences, Jeddah, Saudi Arabia
Received: 09 August 2021; Accepted: 17 August 2021; Published: 07 September 2021
Article Information
Citation: Abdullah M Alzahrani, Alaa A Alesa, Aisha E Yaghmour, Muhammad Anwar Khan, Abdullah A Alesa. The Association between Mean Platelet Volume and Albuminuria in Patients with Type 2 Diabetes Mellitus at King Abdul-Aziz Medical City, Jeddah 2020. Archives of Clinical and Biomedical Research 5 (2021): 702-713.
View / Download Pdf Share at FacebookAbstract
Background: Diabetic patients are at greater risk for many complications. They also are considered to be in hypercoagulable state. Larger platelets are associated with a prothrombotic states because larger platelets are more active. Patients with type 2 diabetes mellitus are usually found to have an elevated MPV. Albuminuria is a very important predictor for both cardiovascular complications and diabetic nephropathy. We aimed in this study to find the association between MPV in diabetic patients and microalbuminuria, HbA1c level, duration of DM, body mass index (BMI), hypertension, stroke, and ischemic heart disease.
Methods: A cross sectional quantitative study of diabetic patients. The data was collected retrospectively from the patients’ electronic files. It included 480 diabetic patients from June 2016 until December 2020. Sample size consisted of 480 patients and it included both male and female patients who are 18 years or older. The data that was collected included gender, duration of DM, HTN, IHD, history of stroke, MPV, albuminuria, BMI and HbA1c.
Results: There was no statistically significant association between MPV and most of the designated variables including Gender, IHD, Stroke, HTN and Albuminuria. Furthermore, there was no association between MPV and albuminuria according to blood sugar level. It was also found that the higher the albuminuria the higher the MPV; the mean MPV increases in patients with increased albuminuria.
Conclusions: MPV and albuminuria were positively correlated. MPV was higher in the controlled diabetes group. However, the association was not statistically significant.
Keywords
Mean Platelet Volume; Albuminuria; Diabetes; Body Mass Index; Glycemic control
Mean Platelet Volume articles; Albuminuria articles; Diabetes articles; Body Mass Index articles; Glycemic control articles
Article Details
1. Introduction
Type two diabetes mellitus is a chronic disorder that is defined as hyperglycaemia due to insensitivity to insulin. Diabetic patients are at greater risk for many complications including both microvascular and macrovascular complications. Furthermore, patients with diabetes are considered to be in hypercoagulable state [1]. A hypercoagulable states means that patients have a higher chance of developing blood clots. Mean Platelet Volume (MPV) is a test that assesses the average size of the platelets. MPV test is usually done as part of a complete blood count (CBC) and it is used as a marker for platelets activity. MPV testing is readily available in both inpatient and outpatients setting. It is easily done and it is a cost effective test. Larger platelets are associated with a prothrombotic states because larger platelets are more active [2]. Patients with type 2 diabetes mellitus are usually found to have an elevated MPV [3]. According to a study that was done at Kathmandu Institute of Science and Technology (KIST) medical college, the authors found that in both diabetic patients and patients with impaired fasting glucose, MPV was elevated [4]. Another study concluded that included 416 subjects concluded that MPV was higher in type 2 diabetic patients compared to non-diabetic patients [5]. Albuminuria test shows the amount of albumin found in the urine. It shows the rate at which albumin is excreted in 24 hour urine collection [6]. Albuminuria is a very important predictor for both cardiovascular complications and diabetic nephropathy [7]. A study that was done at Golestan Hospital shows that albuminuria correlates positively with duration of diabetes and with poorly controlled disease [8]. Papanas N et al reported that MPV was significantly higher in those with microvascular complications such as microalbuminuria [5]. Another study that included 354 diabetic patients shows that MPV was positively correlated with albuminuria [9]. Furthermore, a study that was done by Madhavan K et al and included 216 subjects, concluded that there was a positively correlated with albuminuria [10].
2. Materials and Methods
This is a cross sectional quantitative study of diabetic (DM) patients that followed up at the diabetic clinic at the primary health care centers in the Ministry of National Guard Health Affairs in Jeddah. The data was collected retrospectively from the patients’ electronic files that are documented on the BestCare database system. It included 480 diabetic patients from from June 2016 until December 2020. Sample size consisted of 480 patients and it included both male and female patients who are 18 years or older. The statistical analysis was done using the Statistical Package for Social Sciences (SPSS) software version 20.0. The data was presented as mean and standard deviation for continuous variables and frequencies and percentages for categorical variables. Comparing different variables was done by using Chi-square test, P value less than 0.05 was taken as significant. The ethical approval for this study was obtained from the Institutional Review Board of King Abdullah International Medical Research Center (KAIMRC) (RJ20/002/J).
3. Results
|
|
N |
Median |
IQR |
|
Albuminuria to Creatinine Ratio |
402 |
1.45 |
2.4 |
|
Duration of diabetes |
195 |
7 |
10 |
|
|
N |
Mean |
SD |
|
MPV |
480 |
8.44 |
1.3 |
|
Age |
480 |
57.88 |
12.06 |
|
BMI |
479 |
31.75 |
6.53 |
|
HBA1c |
480 |
7.78 |
1.75 |
|
|
|
N |
% |
|
Albuminuria |
|
|
|
|
<30 |
344 |
71.7 |
|
|
30-300 |
113 |
23.5 |
|
|
>300 |
23 |
4.8 |
|
|
Gender |
|
|
|
|
Male |
222 |
46.3 |
|
|
Female |
258 |
53.8 |
|
|
IHD |
|
|
|
|
Yes |
26 |
5.4 |
|
|
No |
454 |
94.6 |
|
|
Stroke |
|
|
|
|
Yes |
10 |
2.1 |
|
|
No |
470 |
97.9 |
|
|
HTN |
|
|
|
|
Yes |
267 |
55.6 |
|
|
No |
213 |
44.4 |
|
|
HbA1c |
|
|
|
|
≤7.0 |
209 |
43.5 |
|
|
>7.0 |
271 |
56.5 |
|
|
|
Total |
480 |
100 |
|
BMI |
|
|
|
|
<18.4 |
3 |
0.6 |
|
|
18.5-24.9 |
49 |
10.3 |
|
|
>25 |
425 |
89.1 |
|
|
|
Total |
477 |
100 |
Table 1: Demographics
Demographics are demonstrated in table 1. The study included 480 participants, 222 (46.3%) of which were males while the remaining 258 (53.8%) were female. The mean age of the subjects included was 57.88 years ± 12.06. Subjects had an average BMI of 31.75 kg/m2 ± 6.53. Subjects had an average HbA1c of 7.78 % ± 1.75 and an average MPV of 8.44 fl ± 1.30. it was found that 71.7 % of the subjects had an albuminuria level of <30 mg/g, 23.5% of the had levels between 30-300 mg/g, and 4.8% had levels higher that 300 mg/g. Of all the subjects included 55.6% were hypertensive, 5.4% had a history of IHD, and 2.1% had a history of stroke. There were 89.1 % with BMI over 30 which is considered obese, while only 10.3 % were within the normal level. Patients who had a controlled glycemic controlled represented by HbA1c of <7% were found to be 43.5. % while the remaining 56.5% of patients were found to have a poorly controlled glycemia with a HBA1C OF >7 percent.
|
|
HbA1c |
|
|
|||||
|
|
<7.0 |
>7 |
Odds Ratio |
p-value |
||||
|
|
n |
% |
n |
% |
|
|
||
|
Albuminuria |
<30 |
172 |
82.30% |
172 |
63.50% |
NA |
<0.001 |
|
|
30-300 |
34 |
16.30% |
79 |
29.20% |
||||
|
>300 |
3 |
1.40% |
20 |
7.40% |
||||
|
Total |
209 |
271 |
||||||
|
Gender |
Male |
79 |
37.80% |
143 |
52.80% |
0.544 |
0.001 |
|
|
Female |
130 |
62.20% |
128 |
47.20% |
||||
|
Total |
209 |
271 |
||||||
|
IHD |
Yes |
7 |
3.30% |
19 |
7.00% |
0.46 |
0.079 |
|
|
No |
202 |
96.70% |
252 |
93.00% |
||||
|
Total |
209 |
271 |
||||||
|
Stroke |
Yes |
3 |
1.40% |
7 |
2.60% |
0.549 |
0.383 |
|
|
No |
206 |
98.60% |
264 |
97.40% |
||||
|
Total |
209 |
271 |
||||||
|
HTN |
Yes |
120 |
57.40% |
147 |
54.20% |
1.137 |
0.488 |
|
|
No |
89 |
42.60% |
124 |
45.80% |
||||
|
Total |
209 |
271 |
||||||
|
BMI |
<18.4 |
2 |
1.00% |
1 |
0.40% |
NA |
0.197 |
|
|
18.5-24.9 |
16 |
7.70% |
33 |
12.30% |
||||
|
>25 |
190 |
91.30% |
235 |
87.40% |
||||
|
Total |
208 |
269 |
||||||
Table 2: Clinical characteristics of controlled and uncontrolled diabetes patients (Chi-square test).
It is shown in table 2 that 3.3% of people with good glycemic control has history of IHD while 7.0% of them had poor control. The association between IHD and glycemic control was not statistically significant (p-value 0.079). Regarding history of stroke, it was found that 1.4% of those with history of stroke had a good glycemic control and 2.6% with a poor control. It was also found that the association between stroke history and glycemic control was not statistically significant (p-value 0.383). Moreover, it has been shown that 57.4% of hypertensive patient had good control while 54.2% of them had poor control. The association between hypertension and glycemic control was not statistically significant (p-value 0. 488). Regarding albuminuria levels; in patients with levels <30 mg/g there was 82.3% with controlled glycemia compared to 63.5% with poor control. In those with albuminuria levels between 30 and 300 mg/g there was 16.3% with good glycemic controlled versus 29.2% with poorly controlled diabetes. Finally, in those with albuminuria levels over 300 mg/g there was 1.4% with controlled glycemia compared to 7.4% with poor control. There was a statistically significant association between the level of albuminuria and glycemic control (p-value <0.001). Table 2 also demonstrates that regarding gender differences, 37.8% of those with controlled glycemia were males while 62.2% of them were females. Poor glycemic control was present in 52.8% of male patients and in 47.2%of female patients. There was a statistically significant association between gender and glycemic control (p-value 0.001).Regarding BMI, it was shown in table 2 that in patients with average BMI, 7.7% had good glycemic control compared to 12.3% with poor control. In addition, in people with BMI >25 kg/m2; 91.3% had good glycemic control and 87.4% with poor control.
|
|
|
|
MPV |
95% CI |
|
||
|
0 |
|
N |
Mean |
SD |
Lower |
Upper |
p-value |
|
Gender |
Male |
222 |
8.45 |
1.41 |
-0.202 |
0.272 |
0.772* |
|
|
Female |
258 |
8.42 |
1.21 |
|||
|
IHD |
Yes |
26 |
8.62 |
1.04 |
-0.325 |
0.707 |
0.468* |
|
|
No |
454 |
8.43 |
1.32 |
|||
|
Stroke |
Yes |
10 |
8.04 |
1.11 |
-1.227 |
0.408 |
0.326* |
|
|
No |
470 |
8.44 |
1.31 |
|||
|
HTN |
Yes |
267 |
8.38 |
1.22 |
-0.354 |
0.123 |
0.341* |
|
|
No |
213 |
8.5 |
1.4 |
|||
|
HbA1c cat |
<7.0 |
209 |
8.45 |
1.18 |
-0.202 |
0.259 |
0.808* |
|
|
>7 |
271 |
8.42 |
1.39 |
|||
|
Albuminuria |
<30 |
344 |
8.36 |
1.25 |
8.23 |
8.5 |
0.157** |
|
|
30-300 |
113 |
8.6 |
1.42 |
8.34 |
8.86 |
|
|
|
>300 |
23 |
8.69 |
1.43 |
8.07 |
9.31 |
|
|
BMI |
<18.4 |
3 |
7.98 |
0.99 |
5.51 |
10.45 |
0.272** |
|
|
18.5-24.9 |
49 |
8.18 |
1.14 |
7.85 |
8.51 |
|
|
|
>25 |
425 |
8.47 |
1.32 |
8.35 |
8.6 |
|
*Independent t-test; **ANOVA
Table 3: Showing the association between the mean platelet volume (MPV) and all the other variables.
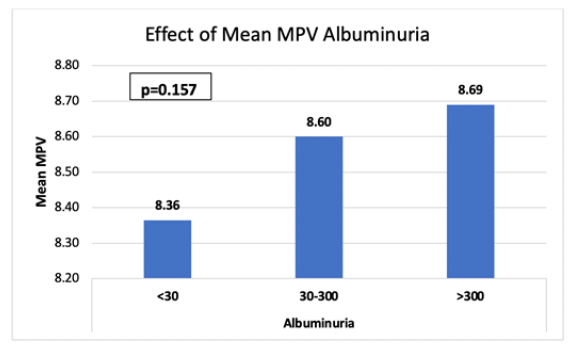
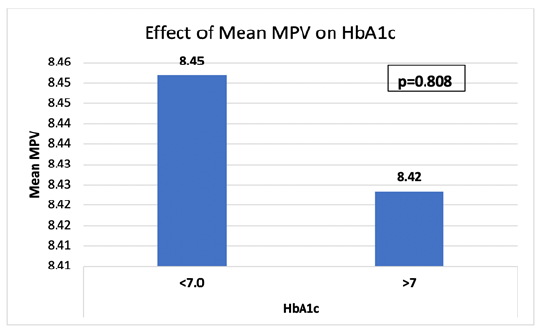
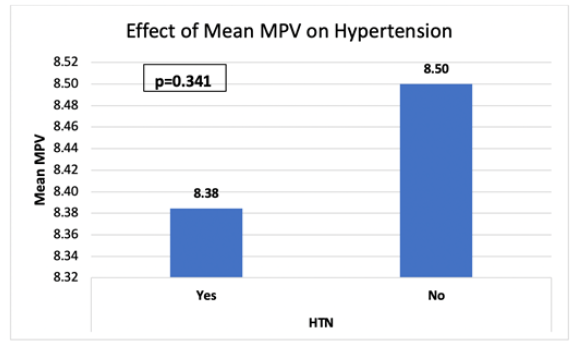
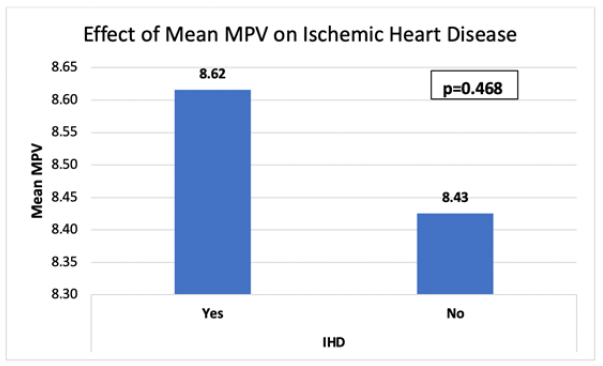
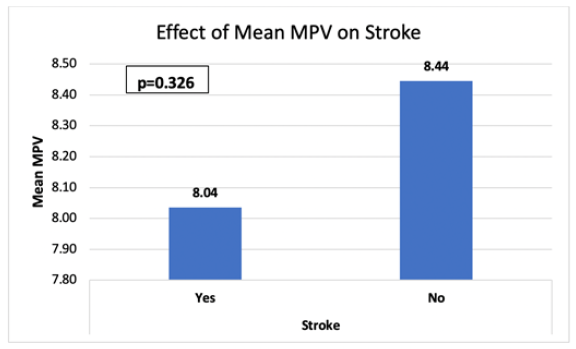
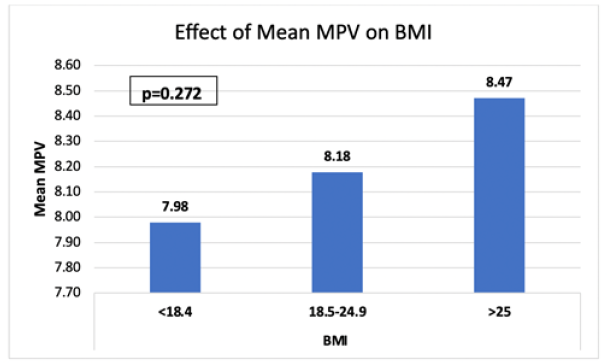
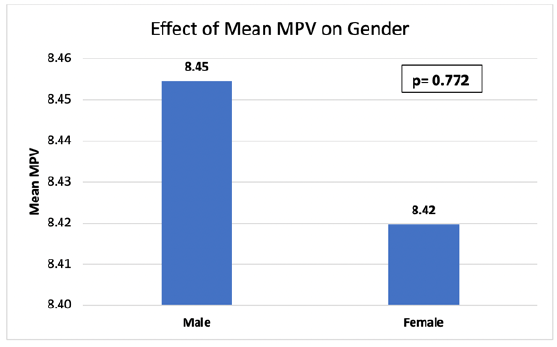
It can be clearly seen from this table that there is no statistically significant association between MPV and most of the designated variables including Gender, IHD, Stroke, HTN and Albuminuria. It also shows the no association between MPV and albuminuria according to blood sugar level. According to the table, for patients with albuminuria of <30 mg/g the mean MPV is 8.36. MPV is 71.7% in the non-controlled DM group, while the controlled group account for 63.5% of mean MPV with albuminuria of <30 gm/g. Whereas the patients with albuminuria levels ranging from 30 to 300 mg/g, the mean MPV is 8.69 with controlled HbA1c = 23.5% and with the non-controlled HbA1c= 29.2%. Regarding patients with albuminuria levels >300 mg/g the mean MPV is 8.69 with controlled HbA1c = 4.8% and with the non-controlled HbA1c= 7.4%.
|
N |
Pearson Correlation |
p-value |
|
|
Age |
480 |
-0.112* |
0.014 |
|
BMI |
479 |
0.103* |
0.025 |
|
HBA1c |
480 |
-0.036 |
0.433 |
|
N |
Spearman's rho |
p-value |
|
|
Albuminuria to Creatinine Ratio |
402 |
-0.049 |
0.331 |
|
Duration |
195 |
-0.117 |
0.102 |
Table 4: Shows the significant negative correlation between Age (P-Value 0.014), significant positive correlation between BMI (P-Value 0.025) with MPV. In contrast, HbA1c (P-Value= 0.433), Albumin/Creatinine Ratio (0.331) and the Duration of DM (P-Value 0.102) are not significantly correlated to MPV.
4. Discussion
This study was conducted to evaluate the impact of elevated MPV on albuminuria in patients with type 2 diabetes mellitus at King Abdul-Aziz Medical City, Jeddah. It also aims to study the association between MPV in diabetic patients and albuminuria, HbA1c level, duration of DM, body mass index (BMI), hypertension, stroke, and ischemic heart disease. The mean age in our study which included 480 patients was found to be 57.88 years ± 12.06. In a study by (Razak MK et al), the mean age was 57.55 years ±9.91. In another study by (Papanas N et al), the mean age was found to be 67.4 ± 9.5 years [5]. Our study consisted of 222 males and 258 females. The number of males and females was similar to those in the previously mentioned studies. In our study, hypertension was found to be present in 267 out of the 480 patients included. While in a study by (Virgin Joena M. et al., 2017) it was present in 118 out of the 269 patients they included [12]. Regarding IHD, in our study the frequency of IHD was found to be in 26 out of the 480 patients included. While in a study by (De Luca et al), it was found in 826 patients out of the 1016 patients included [13]. The mean BMI in our study was found to be 31.75 ± 6.53 kg/m2). The mean BMI in a study by (S Dindar et al) was found to be 30.62 ± 5.95 kg/m2 [14]. The mean BMI in our study was slightly lower compared to the mean BMI in a study by (S Dindar et al). The mean MPV in our study was surprisingly found to be higher in those with a HbA1c levels <7 while in a study by (Anandhalakshmi Swaminathan et al) it was found to be increased in patients with an uncontrolled diabetes [15]. Furthermore, another study by (Szeremeta M1 et al) was also found to be higher in those with uncontrolled diabetes compared to those with controlled diabetes [16]. Albuminuria was found to be positively correlated with MPV in our study. It was found that that the higher the albuminuria the higher the MPV. The mean MPV increases in patients with increased albuminuria. This was also the case in a study by (Ünübol M et al), they found that the mean MPV in patients with microalbuminuria was found to be 9 fl compared to the mean MPV in those without microalbuminuria which was found to be 8.5 fl [9]. Our results shows that poor glycemic control was present in 52.8% of male patients and in 47.2%of female patients. The association between gender and glycemic control was statistically significant. In a cross-sectional study that included 1,482 diabetic patients and they concluded that glycemic control was not significantly associated with age [17]. In our study, the mean BMI was almost the same in the controlled (8.45) and the uncontrolled (4.42) DM group. Also, the study showed no statistically significant association of HTN, IHD and stroke with the uncontrolled diabetic group and MPV, which is different from the finding of a similar study done in 2019 under the title “The relationship between mean platelet volume and albuminuria in patients with type 2 diabetes mellitus” showing that the MPV in uncontrolled diabetic group is statistically significantly higher and statistically significant positive correlated with albuminuria as well as HTN, IHD and stroke [11] significant negative correlation between BMI and MPV, while the correlation of MPV with age is significantly positive. In contrast to what was found in the research published in 2014 “Mean Platelet Volume (MPV) as an inflammatory marker in type 2 diabetes mellitus and obesity”, which showed, higher BMI and MPV in patients with uncontrolled DM [18]. The results declare no significant correlation between MPV and HbA1c, albumin/Creatinine ratio, Duration of DM contrary to the research done in 2014 which showed strong correlation between MPV and poorly controlled DM [11].
4.1 Limitation and strengths
One major strength that this study lies in its relatively large sample seize as the data was collected from 480 diabetic patients. Another point that can count as a major strength for this study is that wide duration for the data collected.
The study has some limitations. They study is subject to biases and confounding that might have influenced our study estimates as the effect estimates in the model are based on interventional prospective observational studies. Another important limitation is the location of the study. As most of the data gathered are from the National Guard Hospital Patients only. Moreover, due to the exclusion criteria applied in data collection process, many diabetics with significant results of MPV value were excluded and the focus was only on selected group of diabetics, which might have affected our results. Also, no data regarding other conditions that are known to affect MPV value were collected in this study. For example, atrial fibrillation or obstructive sleep apnea are known to be associated with the MPV level and yet were not reported in this study.
4.2 Recommendations
Based on the study and the analysis of the results, this papers makes the following recommendations:
- Physician should promote healthy lifestyles
- Physician should promote glycemic control
We do not recommend the routine use of MPV as tool to predict or prevent complications in type 2 diabetics. Due to the conflicting evidence for its significance, we recommend future prospective research into the subject with a larger sample size. We recommend continuing to promote a healthy and active lifestyle and working vigilantly with our patients to insure good glycemic control.
5. Conclusion
Our results suggested that MPV and albuminuria were positively correlated. Additionally, MPV was higher in the controlled diabetes group. However, the association was not statistically significant.
Acknowledgments
We acknowledge the work of Jamanah Abdulaziz for her contribution in data collection.
References
- Lemkes BA, Hermanides J, DeVries JH, et al. Hyperglycemia: a prothrombotic factor? Journal of Thrombosis and Haemostasis 8 (2010): 1663-1669.
- Chu SG, Becker RC, Berger PB, et al. Mean platelet volume as a predictor of cardiovascular risk: a systematic review and meta-analysis. Journal of Thrombosis and Haemostasis 8 (2010): 148-156.
- Zuberi BF, Akhtar N, Afsar S. Comparison of mean platelet volume in patients with diabetes mellitus, impaired fasting glucose and non-diabetic subjects. Singapore medical journal 49 (2008): 114.
- Bhatta S, Singh S, Gautam S, et al. Mean platelet volume and platelet count in patients with type 2 diabetes mellitus and impaired fasting glucose. Journal of Nepal Health Research Council 16 (2018): 392-395.
- Papanas N, Symeonidis G, Maltezos E, et al. Mean platelet volume in patients with type 2 diabetes mellitus. Platelets 15 (2004): 475-478.
- Hadi HA, Al Suwaidi J. Endothelial dysfunction in diabetes mellitus. Vascular health and risk management 3 (2007): 853.
- De Zeeuw D, Remuzzi G, Parving HH, et al. Albuminuria, a therapeutic target for cardiovascular protection in type 2 diabetic patients with nephropathy. Circulation 110 (8): 921-927.
- Zakerkish M, Shahbazian HB, Shahbazian H, et al. Albuminuria and its correlates in type 2 diabetic patients. Iranian journal of kidney diseases 7 (2013).
- Ünübol M, Ayhan M, Güney E. The relationship between mean platelet volume with microalbuminuria and glycemic control in patients with type II diabetes mellitus. Platelets 23 (2012): 475-480.
- Madhavan K, Priyadarshini V, Sivaprakash V, et al M. Study on mean platelet volume in type 2 diabetes mellitus patients vs non diabetic patients.
- Razak MK, Akif AM, Nakeeb N, et al. The relationship between mean platelet volume and albuminuria in patients with type 2 diabetes mellitus. Diabetes & Metabolic Syndrome: Clinical Research & Reviews 13 (2019): 2633-2639.
- Virgin, Joena M, Prabhuswamy KM. Association between mean platelet volume and microalbuminuria in type 2 diabetes mellitus patients. International Journal of Medical Research and Review.
- De Luca G, Verdoia M, Cassetti E et al. Mean platelet volume is not associated with platelet reactivity and the extent of coronary artery disease in diabetic patients. Blood Coagulation & Fibrinolysis 24 (2013): 619-624.
- Dindar S, Cinemre H, Sengul E, et al. Mean platelet volume is associated with glycaemic control and retinopathy in patients with type 2 diabetes mellitus. West Indian Med J 62 (2013): 519-523.
- Swaminathan A, Amitkumar K, Ganapathy S, et al. Evaluation of mean platelet volume and other platelet parameters in subjects with Type-2 diabetes mellitus. National Journal of Physiology, Pharmacy and Pharmacology 7 (2017): 51-54.
- Szeremeta M, Kemona-Chetnik I, Dymicka-Piekarska V, et al. The relations between platelet count, mean platelet volume and HbA1C in patients with type 2 diabetes. Przeglad lekarski 66 (2009): 1049-1051.
- Shorr RI, Franse LV, Resnick HE, et al. Glycemic control of older adults with type 2 diabetes: findings from the Third National Health and Nutrition Examination Survey, 1988-1994. Journal of the American Geriatrics Society s48 (2000): 264-267.
- Aktas G, Kocak MZ, Taslamacioglu Duman T, et al. Mean Platelet Volume (MPV) as an inflammatory marker in type 2 diabetes mellitus and obesity. Bali Medical Journal 7 (2018).


 Impact Factor: * 5.8
 Acceptance Rate: 71.20%
  Time to first decision: 10.4 days
  Time from article received to acceptance: 2-3 weeks