The Influence of SSO on the Optimization Result of Nasopharynx Carcinoma Plan
Xiaolong Hua1, Jianhe Yu1, Lu Wang2*, Li Chen2, Yanshu Mu2, Wenjing Xu1, Qun Ren1, Chuanjun SONG1, Hongxia Xu1, Jiaqi Dai3
1Department of Oncology, Xinghua People's Hospital, Taizhou 225570, Jiangsu, China
2Department of Radiotherapy, Anshan Cancer Hospital, Anshan 114000, Liaoning, China
3Software Product Manager Room 1803, Elekta Instrument (Shanghai) Ltd, Pudong 200120, Shanghai, China
*Corresponding author: Lu Wang, Department of Radiotherapy, Anshan Cancer Hospital, Anshan 114000, Liaoning, China.
Received: 23 February 2023; Accepted: 21 March 2023; Published: 27 March 2023
Article Information
Citation: Xiaolong Hua, Jianhe Yu, Lu Wang, Li Chen, Yanshu Mu, Wenjing Xu, Qun Ren, Chuanjun SONG, Hongxia Xu, Jiaqi Dai. The Influence of SSO on the Optimization Result of Nasopharynx Carcinoma Plan. Archives of Clinical and Biomedical Research 7 (2023): 224-233.
View / Download Pdf Share at FacebookAbstract
Purpose: To study the influence of Monaco 5.4 treatment planning system (TPS) on the dosimetry of radiotherapy for nasopharynx carcinoma (NPC) under the condition of different segment shape optimization (SSO) times.
Methods: Fifteen patients with T3-4N0-2M0 stage NPC were enrolled, and each case was designed with SSO of 3, 5, 7 and 10 times, respectively. The dose results of the target area and major organs at risk (OARs) were statistically analyzed by DVH statistics. Moreover, the isodose lines of 70, 60 and 54 Gy were intercepted at the same plane in the transverse, coronal and sagittal views, then Monaco scripting was used for statistical analysis. MLCs Average mental complexity summary (MCS) values of each group were calculated and the different rate of dose coverage in the target area was compared. In addition, optimization time, delivery time, segments# and monitor unit (MU#) were obtained and analyzed using the optimization console. The plans were verified and analyzed using ArcCheck phantom.
Results: For target area D2, the results of the SSO7 group and the SSO10 group were similar and better than those of the SSO3 and SSO5 groups. Besides, the D2 results of the SSO3 group were markedly higher than those of the other three groups. Results of the maximum dose of the spinal cord, brain stem, and lens and the mean dose and V30 of parotid glands showed the same trend in major OARs. SSO7 and SSO10 shared similar dose results, which were significantly better than similar dose results shared by SSO3 and SSO5. In the dose deprogram distribution of 70, 60 and 54 Gy, partial 70 Gy dose spillover occurred in both SSO3 and SSO5 groups and it was more evident in the SSO3 group. However, no significant dose spillover was found in SSO7 and SSO10 groups. In the sub-field alignment comparison under the same angle, the alignment became more complicated and the sub-fields were smaller as the number of SSO times increased. The MCS value decreased with the increase in the SSO value; the results of the three groups except SSO3 were similar. The results of segment#, MU# and plan delivery time between different SSO groups were slightly different, while the plan optimization time changed significantly. The difference between the SSO3 group and the SSO10 group was more than 500 s. The results were compared in ArcCheck, and no significant difference was observed between the groups.
Conclusions: The user-defined SSO function of Monaco 5.4 TPS effectively balances the relationship between plan design efficiency and plan quality. An SSO of 7 is a better value for efficiency and quality in clinical radiotherapy for NPC.
Keywords
<p>NPC; SSO; VMAT; XVMC</p>
Article Details
Abbreviations:
NPC- Nasopharynx Carcinoma; SSO- Segment Shape Optimization; OAR- Organ at Risk; BEV- Beam Eye View; PGTV- Planning Gross Tumor Volume; PTV- Planning Target Volume; TPS- Treatment Planning System; XVMC- X-ray Voxel Monte Carlo; VMAT- Volumetric modulated Arc Therapy; QUANTEC- Quantitative Analysis of Normal Tissue Effects in the Clinic; CI- Conformity Index; HI- Homogeneity Index; OT- Optimization Time; DT- Delivery Time; MU- Monitor Units; MLC- Multi-Leaf Collimator; SCR- Secondary Cancer Risk
1. Background
Nasopharynx carcinoma (NPC) is known to be endemic in some regions of the world, especially in Southern China. Radiation therapy is the standard radical treatment for NPC because of its high radiosensitivity; besides, it is difficult to remove NPC using surgery [1-3]. Monaco of Elekta is one of the commonly used radiotherapy treatment planning systems (TPSs), and its X-ray voxel Monte Carlo (XVMC) algorithm is one of the commonly used photon Monte Carlo algorithms at present [4-15]. XVMC is the core algorithm that obtains the most suitable shape of the sub-fields for the plan through several segment shape optimization (SSO) times. Each SSO is an optimization cluster. It is similar to large volume iterative optimization, which contains several sub-optimizations of inter loops and outer loops. The quasi-annealing algorithm is followed within each optimization cluster and the quasi-genetic algorithm is followed between clusters [15,16,17]. We conducted a retrospective analysis of 100 cases of NPC from 2019 to 2020 and interpreted the optimization process using an optimization console function. Results showed that Monaco TPS 5.1 version was fixed for 5 times of SSO only. However, planning for NPC is one of the most complex types of radiotherapy plan design [5,6,7,8]. The nasopharynx is adjacent to important normal tissues such as the brainstem, spinal cord, lens and parotid glands. The target area is usually large and irregular [9,10,11]. Therefore, the effective design of a high-quality plan has become an important research topic. In the present study, the differences between different SSO plans were compared to provide a reference for the clinical design of NPC plans.
2. Materials and Methods
2.1 Data
In 2020, 15 patients with T3-4N0-2M0 NPC from Anshan Cancer Hospital were randomly enrolled, including10 males and 5 females, aged 18-55 years, with a median age of 38 years. Axial cinematic scanning was performed in free-breathing conditions, the axial thickness was 2.5 mm. All images were uploaded to Monaco 5.4 TPS, and the target area was contoured by radiotherapy physicians with over 5 years of working experience following NCCN2020 NPC treatment guidelines, and the target area was reviewed by chief physicians with over 10 years of working experience. The plan was designed by a senior clinical physicist with over 10 years of Monaco TPS experience.
2.2 Plan Design
Dual full volumetric modulated arc therapy (VMAT) can generate precise conformal dose distribution and be used in all plans. XVMC optimization was performed for 3, 5, 7 and 10 times of SSO under similar functions and TPS parameter settings. A fraction dose of 2 Gy in 30 fractions and the dose constraint of OARs were carried out according to the Quantitative Analysis of Normal Tissue Effects in the Clinic (QUANTEC) report. The dose results, conformity index (CI) and homogeneity index (HI) of the target area and major OARs of different SSO plans were statistically analyzed using dose-volume histogram (DVH) statistics [12]. Multi-leaf collimator (MLC) shapes were intercepted and compared at 30°, 120°, 240° and 330° in the beam-eye view (BEV) interface. The dose structures of planning gross tumor volume PGTV70 and planning target volume PTV60 target areas were established, and the prescription dose coverage rates were calculated by Formula (1). Since 54 Gy covers the structure of PTV60 and PTV54 target areas at the same time, the dose structure of 54 Gy was cut into two dose structures, PTV60-54Gy and PTV54-54Gy, at the interface layer of the two target areas, for calculation and evaluation respectively. Transverse, coronal and sagittal dose maps of 70, 60 and 54 Gy were intercepted and compared in the same image layer (1).

Where R (%) is the prescription dose coverage rate, VGy (cm3) is the volume of the assessed dose coverage and VTarget (cm3) is the volume of the assessed target area.
Optimization time (OT), delivery time (DT), segments# and MU# were obtained and analyzed using an optimization console. The plan test environment was a standard HP Z8 desktop server equipped by Elekta. All VMAT plans were delivered by a 6 MV Elekta Infinity Linac (Elekta, U.K.) equipped, application of agility handpiece (80 pairs of mlc, single sheet thickness 0.5cm).
2.3 Plan Complexity Analysis
According to Srivastava et al., Monaco scripting could be used to analyze TPS export files, thus the MLC movement distance leaf sequence variability (LSV) [13]. All segments of the product of the aperture area variability (AAV) and monitor unit (MU) were obtained, then average MCS values of each experimental group was calculated (2).

MUCPi,i+1 indicates MU delivered between two successive control points [namely, cpi and cp(i+1)], MUplan is the total MU of the plan.
2.3 Plan Verification
Background calibration on ArcCheck was performed. Data for 60 verification plans were collected and compared with TPS data, followed by normalization according to the global maximum dose. Dose below 10% was not included in the analysis, and gamma analysis was performed with 3% and 3 mm.
2.4 Statistical Analysis
Data were analyzed by SPSS 22.0 and paired t-test was performed on the dose results. A p-value of < 0.05 was considered statistically significant. In Monaco 5.1 TPS, SSO5 was the default value, thus the results of other groups were matched with those of the SSO5 group by paired t-test.
3. Results
3.1 Comparison of dose Results between Groups
The target dose results (Table 1) and the major OARs dose results data (Table 2) of 60 cases with the same parameters except SSO were read by the Monaco TPS DVH statistics function. Under the calculation method of target area priority, PGTV70 and PTV60 showed similar results in the prescription dose coverage percentage, while PTV54 had a significant difference. In the dose statistics of D2 and Dmean in each target area, the SSO3 result was significantly higher than that of the other groups; In addition, CI results showed significant differences and HI results showed different performance in different target areas. Results of major OARs dose analysis revealed that the maximum dose and volume dose optimization gradually decreased with the increase in the number of SSO, while the results of SSO7 and the SSO10 groups were similar.

Table 1: Effect of different SSO plans on target dose ()
Note: SSO3-SSO10 are 3-10 times of SSO plans respectively, D2 is the lowest dose achieved by 2% volume of the structure, Dmean is the mean dose, Vx is the percentage of the full volume of the organ at marked dose.
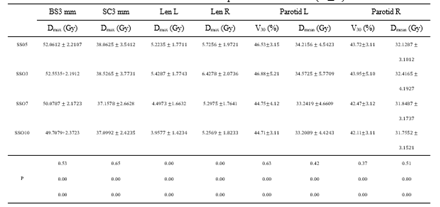
Table 2: Effect of different SSO plans on OARs dose ()
Note: BS3 mm is 3 mm of brain stem 3D external expansion; SC3 mm is 3 mm of spinal cord 3d external expansion.
3.2 Comparison of Dose Maps between Groups
In Monaco 5.4 TPS, the same layer was selected to intercept dose maps at the transverse, sagittal and coronal views of different SSO plans respectively, as shown in Figure 1. In the 70 Gy dose map distribution, there was dose spillover outside the PGTV70 target area in SSO3 and SSO5 groups; dose spillover was more significant in the SSO3 group than in the SSO5 group. In the dose map distribution of 60 and 54 Gy, the dose curve gradually tightened at the three views with the increase of SSO.
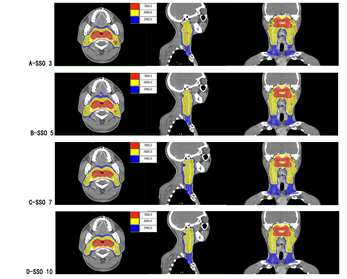
Figure 1: Color washing of different SSO plans.
Note: A-D are SSO3-SSO10 plan groups; from left to right showing transverse, sagittal and coronal.
Statistics and comparative analysis were performed on the prescription dose coverage rates of PGTV70 and PTV60 and the dose coverage rates of target areas PTV60-54 and PTV54-54 in the plan using formula (1), as shown in Figure 2. There were significant differences in dose coverage rates in SSO3, SSO5 and SSO7 groups. Although the SSO10 group had more advantages than the SSO7 group, the differences between the groups were significantly reduced.
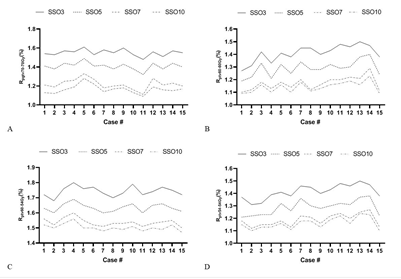
Figure 2: Dose coverage rate of different SSO plans.
3.3 Plan Complexity Analysis
LSV, AAV and MU data were obtained through the Monaco Scripting file, and the average MCS values of each experimental group were calculated according to Formula (2). The results are shown in Figure 3. The average MCS value of the SSO3 group was significantly higher than that of the other three groups, and the results of the SSO5-SSO10 groups were similar. The MCS value was one of the quantitative expressions of intensity modulation plan complexity; therefore, it could be considered that the complexity of the intensity modulation plan of SSO3 was significantly lower than that of the other experimental groups.
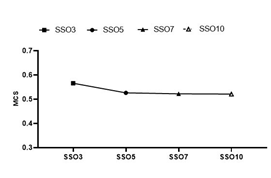
Figure 3: Analysis of the MCS value of different SSO plans.
3.4 Comparison of Characteristic Parameters of Monaco TPS between Groups
The number of segment#, MU#, OT and DT was obtained from the console window of Monaco 5.4 TPS, as shown in Figure 4. Segment# and DT increased and MU# decreased with the increase in SSO, but the amplitude was very small. However, OT changed significantly, and the difference between adjacent groups was more than 100 s. Besides, the difference between SSO3 and SSO10 groups was more than 500 s.
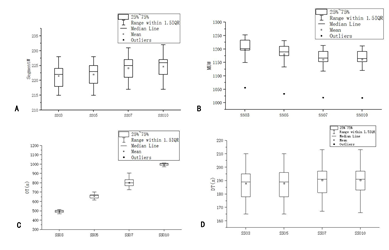
Figure 4: Comparison of XVMC parameters of different SSO.
3.5 Comparison of Validation Results between Groups
Each SSO group plan was verified using ArcCheck and results were analyzed with Sun Nuclear. Patient validation analysis was performed with 3%/3 mm Gamma [14] (Figure 5). Results of all the plans in each group met the clinical requirements, and there was little difference between different SSO plans in the same group.
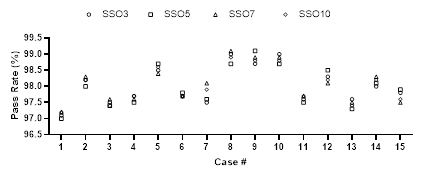
Figure 5: Comparison of verification results of different SSO plans.
4. Discussion
The XVMC algorithm is the core of Monaco TPS. Optimization processes of the plan can be obtained and analyzed by the optimization console function. It was found that the whole optimization process requires several SSO times to achieve final dose distribution. In version 5.1, the SSO optimization process consists of one sub-field generation optimization (the first SSO), three sub-field alignment optimizations (the second to the fourth SSO) and one sub-field selection and merger optimization (the fifth SSO). In version 5.4, the sub-field alignment optimization has been upgraded from a fixed number of 7 times to a user-defined time (The selectable range is 1~20). This has promoted a change in planning design efficiency and plan quality. Since each SSO is equivalent to an iterative optimization of a large volume, the formula of dose influenced by the number of iterations proposed by Llacer et al. in 2001 can be referred to derive formula (3) of dose influenced by the number of SSO [18,19]. When the accumulated dose of the current beam being evaluated is closer to the accumulated dose of adjacent units, the value of the influence rate will approach 0, and the closer it approaches 0, the more uniform the dose distribution will be. Therefore, a smaller value of the influence rate is the recommended and accepted value scheme of SSO.

Note: Where is the influence rate of SSO on dose; is the dose filtration factor; j and is the current beam and the adjacent unit, respectively; is the dose receiving the weight of the adjacent unit; NSSO is the optimization times of SSO; Dj is the dose of the target to be evaluated; is the dose of the adjacent unit.
Analysis of dose results in this study indicated that both the assessment values of the target area and major OARs improved to varying degrees with the increasing number in SSO, that is, the difference between the dose of the evaluated grid and the dose of the adjacent grid gradually decreased with the increase in the number of SSO, and the influence rate value obtained according to formula (3) will gradually decrease. Hence, the increase in the number of SSO times will promote the development of plan results towards better plan quality. In the analysis of dose maps at the same layers, a similar conclusion can be drawn. Whereas SSO3 had a dramatic 70 Gy dose spillover outside the structure of the PGTV70 target area, SSO5 had a small amount of spillover. Moreover, SSO7 and SSO10 had no 70 Gy dose spillover and were tightly wrapped around PGTV70. A similar trend was also found in the comparison of dose coverage in the target area. In the two studies conducted by Llacer et al. in 2003 and 2004, the number of iterations and initial intensity in intensity modulation optimization have guiding significance for the quality of the plan; however, when the number of iterations is large enough, the plan reaches the optimum, and the plan results cannot be further optimized by continuing calculation [20,21]. Conversely, low and high-frequency changes with low eigenvalues appear, which is not conducive to the implementation of treatment plans. SSO3-SSO10 plans in this study, the results of both the target area and major OARs, or dose maps at the same layers, demonstrated that the increase in the number of SSO times improved the quality of the plan, but there was no bottleneck or small and high-frequency changes with low eigenvalues to SSO; thus, 10 times of SSO did not reach the limit of XVMC optimization. More SSO times will help improve the quality of the plan further. However, the indicators of the target area and major OARs of SSO7 and SSO10 are pretty close, and the dose maps distribution is similar. Therefore, more SSO times will have less improvement on the quality of the NPC plan, and there may be an optimization bottleneck of small and high-frequency changes with low eigenvalues. In addition, as the number of SSO times increased from 3 to 10 times, the MCS value showed a decreasing trend, mainly because the sub-field configuration area gradually decreased with the increase in SSO optimization times. Srivastava et al. showed that quantitative analysis of MCS could be used as a condition for quantitative analysis of the complexity of intensity modulation plans. MCS decreased with the increase of SSO, suggesting that the complexity of intensity modulation plans was gradually increasing in this study. Few isolated island sub-fields appeared in the 10 times of SSO; therefore, to meet the requirements of complex NPC plans, MLC positioning accuracy and the stability of electron gun current needed to be higher, and the emergence of isolated island sub-field would be a big challenge to the success of clinical plans. However, all the ArcCheck verification results of the 3-10 times SSO met the acceptance criteria of the clinical plan in the current study, and the results were similar. Therefore, the 3-10 times of SSO were all suitable for the application of the NPC clinical plan. A comparison of NPC plans with different SSO times showed that although segment# and DT exhibited an increasing trend, there was no significant difference. This could be attributed to the same restriction on the number of sub-fields for all plans in the Monaco TPS parameter setting. However, MU# showed a decreasing trend, which could be explained by two main reasons. MCS and the sub-field alignment area decreased and the irradiation area decreased with the increase in the number of SSO, resulting in the decrease in the demand for MU#. In addition, as the number of SSO increased, the calculation accuracy of proton stopping power increased, that is, the energy per unit particle was more fully utilized, reducing the demand for MU# [22]. This could help to decrease secondary cancer risk (SCR) in VMAT due to low doses to healthy tissues induced by scattering and leakage radiation from the gantry [23,-26]. OT showed the most significant difference, and the difference between adjacent groups was greater than 100 s. The average OT of the SSO10 group was more than 1000 s, but the improvement effect of SSO10 on the plan quality was not significant compared with that of SSO7, and it did not get a good plan quality speed-benefit ratio. Besides, the high number of SSO times required better hardware support for Monaco services, especially memory for floating-point storage and release.
5. Conclusion
In summary, more SSO times may help to improve the plan quality for the clinical plan design of NPC. However, 7 times SSO are recommended under the premise of balancing efficiency of the plan design and plan quality.
Availability of Data and Materials
The datasets used and analyzed during the current study are available from the corresponding author on reasonable request.
Acknowledgements
This study was supported by Grant No.20200789 from the Key Medical Research Project of Hebei Province.
Contributions
Xiaolong HUA set up experimental ideas and wrote papers. Jiaqi DAI designed the experiment. Jianhe YU and Qun REN countered the cases and reviewed them. Li CHEN and Yanshu MU analyzed and sorted out the experimental data. Chuanjun SONG, Wengjing XU and Hongxia XU carried out experiments and collated data. Lu WANG analyzed the experimental data and drafted the paper.
Ethics Declarations
Ethics Approval and Consent to Participate
This research study was conducted retrospectively from data obtained for clinical purposes. Ethical approval was waived by the local Ethics Committee of Xinghua People's Hospital in view of the retrospective nature of the study and all the procedures being performed were part of the routine care.
Consent for Publication
Not applicable.
Competing Interests
There are no conflicts of interest in connection with this work, and the material described is not under consideration for publication elsewhere.
References
- Yu MC. Diet and nasopharyngeal carcinoma. Prog Clin Biol Res 346 (1990): 93-105.
- Chan AT, Teo PM, Johnson PJ. Nasopharyngeal carcinoma. Ann Oncol 13 (2002): 1007-1015.
- Wani S Q, Khan T, Wani SY, et al. Nasopharyngeal Carcinoma: A 15Year Study with Respect to Clinicodemography and Survival Analysis. Indian Journal of Otolaryngology & Head & Neck Surgery 68 (2016): 1-11.
- Ma C, Mok E, Kapur A, et al. Clinical implementation of a Monte Carlo treatment planning system. Med Phys 26 (1999): 2133-2143.
- Denis F, Garaud P, Bardet E, et al. Final Results of the 94–01 French Head and Neck Oncology and Radiotherapy Group Randomized Trial Comparing Radiotherapy Alone With Concomitant Radiochemotherapy in Advanced-Stage Oropharynx Carcinoma[J]. Journal of Clinical Oncology 22 (2004): 69-76.
- Shibata T. Treatment Planning of IMRT for Head and Neck Malignancies [M]. Springer Japan (2015).
- Teoh M, Clark CH, Wood K, et al. Volumetric modulated arc therapy: a review of current literature and clinical use in practice. Br J Radiol 84 (2011): 967-996.
- Srivastava SP, Cheng CW, Das IJ. The dosimetric and radiobiological impact of calculation grid size on head and neck IMRT. Pract Radiat Oncol 7 (2017): 209-217.
- Shanmugaratnam K, Chan SH, de-Thé G, et al. Histopathology of nasopharyngeal carcinoma: correlations with epidemiology, survival rates and other biological characteristics. Cancer 44 (2015): 1029-1044.
- Zhou X, Ou X, Xu T, et al. Effect of dosimetric factors on occurrence and volume of temporal lobe necrosis following intensity modulated radiation therapy for nasopharyngeal. Radiat Oncol Biol Phys 90 (2014): 261-269.
- Beetz I, Steenbakkers RJHM, Chouvalova O, et al. The QUANTEC criteria for parotid gland dose and their efficacy to prevent moderate to severe patient-rated xerostomia. Acta oncologica (Stockholm, Sweden) 53 (2014).
- Rose PG, Bundy BN, Watkins EB, et al. Concurrent cisplatin-based radiotherapy and chemotherapy for locally advanced cervical cancer. N Engl J Med 340 (1999): 1144-1153.
- Raju PS, Basta K, Werner DG, et al. A comparative analysis of Acuros XB and the analytical anisotropic algorithm for volumetric modulation arc therapy. Rep Pract Oncol Radiother 26 (2021): 481-488.
- Fraser I. Quality assurance in radiotherapy. Irish Medical Journal 81 (1988): 5.
- Aubry, Beaulieu J, Sévigny F, et al. Multiobjective optimization with a modified simulated annealing algorithm for external beam radiotherapy treatment planning. Medical physics 33 (2007): 4718-4729.
- Cotrutz C, Lahanas M, Kappas C, et al. A multiobjective gradient-based dose optimization algorithm for external beam conformal radiotherapy. Physics in Medicine and Biology 46 (2001): 2161-2175.
- Lahanas M, Schreibmann E, Baltas D. Multiobjective inverse planning for intensity modulated radiotherapy with constraint-free gradient-based optimization algorithms. Physics in Medicine & Biology 48 (2003): 2843.
- Llacer J, Solberg TD, Promberger C. Comparative behaviour of the dynamically penalized likelihood algorithm in inverse radiation therapy planning. Phys. Med. Biol 46 (2001): 2637-2663.
- Webb S. Optimizing radiation therapy inverse treatment planning using the simulated annealing technique. International Journal of Imaging Systems & Technology 6 (2010): 71-79.
- Llacer J, Deasy JO, Portfeld TR, et al. Absence of multiple local minima effects in intensity modulated optimization with dose-volume constraints. Physics in Medicine & Biology 48 (2003): 183-210.
- Llacer J, Agazaryan N, Solberg TD, et al. Degeneracy frequency response and filtering in IMRT optimization [J]. Phys Med Biol 49 (2004): 2853-2880
- Wang L, Zhang S, Zhan X, et al. The effect of statistical uncertainty on SBRT program in non-small cell lung cancer. Cancer prevention and treatment 33 (2020): 33-40.
- Lee B, Lee S, Sung J, et al. Radiotherapy-induced secondary cancer risk for breast cancer: 3D conformal therapy versus IMRT versus VMAT. J Radiol Prot 34 (2014): 325-331.
- Kourinou KM, Mazonakis M, Lyraraki E, et al. Scattered dose to radiosensitive organs and associated risk for cancer development from head and neck radiotherapy in pediatric patients. Phys Med 29 (2013): 650-655.
- Lee HF, Lan JH, Chao PJ, et al. Radiation-induced secondary malignancies for nasopharyngeal carcinoma: a pilot study of patients treated via IMRT or VMAT. Cancer Manag Res 10 (2018): 131-141.
- Sakthivel V, Mani GK, Mani S, et al. Radiation-induced second cancer risk from external beam photon radiotherapy for head and neck cancer: impact on in-field and out-of-field organs. Asian Pac J Cancer Prev 18 (2017): 1897-1903.


 Impact Factor: * 5.8
 Acceptance Rate: 71.20%
  Time to first decision: 10.4 days
  Time from article received to acceptance: 2-3 weeks