A Comparative Analysis of COVID-19 Epidemic Between Azerbaijan And Nigeria Using SIR Model
Adeoke, O.A. Gasimli, B.U. Valiyeva, A. Khalilov, R.I. and *Huseynova, N.F.
Department of Biophysics and Biochemistry, Faculty of Biology, Baku State University, Baku, Azerbaijan
*Corresponding Author: Nigar Faig Huseynova, Department of Biophysics and Biochemistry, Faculty of Biology, Baku State University, Baku, Azerbaijan.
Received: 24 November 2022; Accepted: 1 December 2022; Published: xxxxx
Article Information
Citation: Adeoke OA., Gasimli BU, Valiyeva A, Khalilov RI, and Huseynova NF. A Comparative Analysis of COVID-19 Epidemic Between Azerbaijan And Nigeria Using SIR Model. Journal of Environmental Science and Public Health. 6 (2022): 341-346.
View / Download Pdf Share at FacebookAbstract
Coronavirus disease (Covid-19) is the latest infectious disease to have stormed the world all at once. This study aimed to simulate and compare the trends of the Covid-19 epidemic between Azerbaijan and Nigeria using SIR model. Data about the number of infections, recoveries, and deaths were obtained from Azerbaijan’s Report News Agency and the Nigerian Centre for Disease Control (NCDC) respectively. Applying data from February 2020 to May 2022, we predicted the epidemic on a case-by-case national basis over a period of twenty-seven months. We optimized the parameters using the forward Euler method and created an algorithm on Excel software. Our simulation showed Covid-19 epidemic in Azerbaijan peaked on 11 September 2020 when 37.8% of its population was infected, while in Nigeria it peaked on 14 January 2021 when 25.2% of its population was infected. The difference in peak time is most likely due to higher temperatures limiting the daily spread of Covid-19 in Nigeria (warmer climate) unlike in Azerbaijan (colder climate).
Keywords
<p>COVID-19, Epidemic, SIR model, Azerbaijan, Nigeria.</p>
Article Details
1. Introduction
The Coronavirus epidemic situation broke out in December 2019, as China reported cases of pneumonia with an uncertain cause in Wuhan City. The first case in China was reported on 12 December 2019, and the Chinese authorities finished and reported the sequencing of the virus to the United Nations on 7 January 2020. On 23 January, the Chinese government announced the shutting down of Wuhan City to control the further spread, especially during the Chinese Spring Festival. This epidemic continues to spread among other cities in China and starts to cause infections around the world. On 11 February 2020, the World Health Organization (WHO) codenamed Coronavirus Covid-19 officially and announced the epidemic situation as a pandemic on 11 March 2020 [1]. On 28 February 2020, Azerbaijan confirmed the first positive case of Covid-19 within its border (a day after Nigeria did). Data used for this study spanned from 27 February 2020 to 27 May 2022 (a period of twenty-seven months). We relied on publicly profiled data (by the Azerbaijan Report News Agency and NCDC) of confirmed cases and mortality to provide a SIR-model comparative analysis of SARS-CoV-2 transmission between Azerbaijan and Nigeria. The choice of countries in this research was due to their marked differences in terms of population density and climatic conditions. According to 2022 United Nations data, Azerbaijan has a population of 10,351,040, making 0.13% of the total world population while Nigeria has a population of 218,989,714, making 2.64% of the total world population [9]. We sought to assess the possible role climate and national geography might have played in SARS-CoV-2 transmission.
2. SIR Model:
The SIR Model is one of the disease models that track and predict epidemics. It represents each population using a single system of three different functions: the function of the susceptible group, the infected group, and the removed group. In our application, the removed group consists of both recovered individuals as well as the deaths caused by Covid-19. While forming this model, the following assumptions were made:
- once recovered, individuals will no longer be susceptible
- deaths will only be caused by the infection
- there will be no births introduced to the population
- each individual has the same chance of susceptibility, infection, and removal.
This model will be represented by a system of ordinary differential equations (ODE) [2]. The system of ODEs that represent the changes across the population is given by

Figure 1: The SIR Equation Model.
In these equations, the parameters β (the infection rate) and γ (the recovery or removal rate of infectives) [3] are constants: β controls the transition between S and I, equation (1), while γ controls the transition between I and R, equation (3) [4]. Based on earlier stated assumptions of SIR model, the initial condition of this model must satisfy the condition S(0) +I(0) +R(0) = N, where N is the population size. Basic reproduction number (R0) is the average number of people who will catch the disease from a single infected person, the basic reproduction number R0=β/γ [5].
2.1Comparing Data:
On 28 February 2020, Azerbaijan confirmed the first positive case of Covid-19 within its border (a day after Nigeria did). We, therefore, compared data from both countries from February 2020 to May 2022 (a period of twenty-seven months). We optimized the parameters (S, I, R) using the Forward Euler method, and created an adaptive algorithm (one that varies output based on changing input values).
2.3 Modelling the ODE:
We first used an ordinary differential equation solver that will return the rate of change of each population into the algorithm.
For the susceptible population, we have:
dS/dt = (-βSI)
dS = (-βSI).dt
Si+1 – Si = (-βSiIi).dt
Si+1 = Si – (βSiIi).dt …………………………………………………………….….. eqn 4
For the infected population, we have:
dI/dt = (βSI – уI)
dI = (βSI – уI).dt
Ii+1 - Ii = (βSiIi - уIi).dt
Ii+1 = Ii + (βSiIi - уIi).dt …….………………………………………….………….…. eqn 5
For the removed population, we have:
dR/dt = уI
dR = (уI).dt
Ri+1 - Ri = (уIi).dt
Ri+1 = Ri + уIi.dt ……………………………..………………………………... eqn 6
In this model, the infection parameter (βAzerbaijan) is 0.49, and the removed parameter (γAzerbaijan) is 0.15, while the infection parameter (βNigeria) is 0.30, and the removed parameter (γNigeria) is 0.12. The two values give the basic reproduction number R0, where R0 = β/γ.
o For Azerbaijan, R0 = βAzerbaijan/γAzerbaijan
R0 = 0.49/0.15 = 3.26
o For Nigeria, R0 = βNigeria/γNigeria
R0 = 0.30/0.12 = 2.5
2.4 Creating algorithm:
Then we construct a function to represent the SIR model. It allows passing in the parameters, β, and γ, as well as the three populations at a given time. For the first time interval (i.e. when dt = 1) code is as follows:
Susceptible Si+1=B2-($E$4*B2*C2)*$E$2
Infected Ii+1= C2+($E$4*B2*C2-$E$6*C2)*$E$2
Removed Ri+1 = 1-B3-C3
To better capture the Covid-19 dynamics, we represented both populations as 1.0; thus, expressing S, I, and R in percentages. Usually, if the R0 value is greater than one, the infection rate is greater than the recovery rate, and thus the infection will grow throughout the population [6]. If R0 is less than one, the infection quickly will die out since people are healing faster than they are spreading it. Basic reproduction number (R0) for Covid-19 is 1.4-5.7
3. Results and Discussion
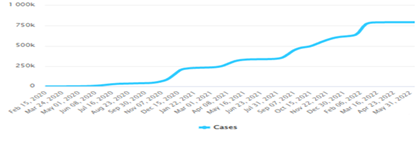
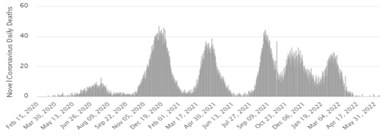
From the simulation of the SIR model, the first day starts with less infection then the infection rate increases exponentially with the increasing number of newly infected people until it peaks. This infection rate is called the ‘epidemic curve’. Oftentimes, epidemiologists are said to be making attempts to flatten the curve, this means lowering SARS-COV-2 transmission. It is observed that Covid-19 cases and deaths were lower in Nigeria than in Azerbaijan (A1-A4). We deemed more rapid testing to have accounted for higher reported cases in the latter. This is because we had assumed an identical strain of coronavirus was spread amidst both populations.
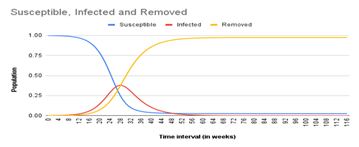
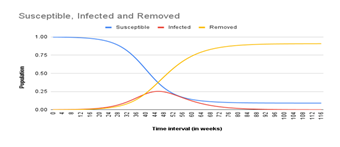
Also, as seen in Figure 2 and 3, the epidemic peak in Azerbaijan was at “week 28” while in Nigeria it was at “week 46”. In both cases R0 > 1 which explains why at least one-quarter of both populations were infected in the first 52 weeks of spread. The subsequent drop in infection could be attributed to herd immunity among the remaining susceptible, immune resistance in those fully recovered, and government containment strategies such as social distancing, mask-wearing, hand washing, etc
4. Conclusion
Our simulation predicted that the Covid-19 epidemic in Azerbaijan peaked on 11 September 2020 when 37.8% of its population was infected (Fig 2), while Nigeria peaked on 14 January 2021 when 25.2% of its population was infected (Fig 3). The difference in peak time is most likely due to higher temperatures limiting the daily spread of Covid-19 in Nigeria (warmer climate) unlike in Azerbaijan (colder climate). Our research model only gives a rough analysis of the Covid-19 epidemic; in reality, the trend might have been slightly different because of some factors we did not consider such as the introduction of vaccines in early 2021, unlikelihood of some of the assumptions made, and possibility of different virus strains.
5. References
- Yimeng Duan. Simulations of the COVID-19 Epidemic in Nigeria Using SIR Model. J. Phys.: Conf. 2021, Ser 1893(1)(2021).
- Kaw AK, Kalu EE, Nguyen D. Numerical Methods with Applications; 1st ed; University of South Florida, Florida, USA 10 (2009).
- Wu J, Tang B, Xiao Y, et al.An updated estimation of the risk of transmission of the novel coronavirus (2019-nCov). Infect. Dis. Model 5 (2020): 248-255.
- Rüdiger S, Plietzsch A, Sagués F, et al. Epidemics with mutating infectivity on small-world networks. Sci Rep 10 (2020): 1–11.
- Khalilov RI, Aslanova GA. A time-dependent SIR model for COVID-19 in Azerbaijan. J. L Sci & Bio 2 (2020): 116-212.
- Jung SM, Akhmetzhanov AR, Hayashi K, et al. Real-time estimation of the risk of death from novel coronavirus (COVID-19) infection: Inference using exported cases. J. Clin. Med 9 (2020): 523.
- Worldometer, Available online: https://www.worldometers.info/coronavirus/country/azerbaijan/(accessed on 30 June 2022)
- Worldometer, Available online: https://www.worldometers.info/coronavirus/country/nigeria/(accessed on 30 June 2022)
- Worldometer, Available online: https://www.worldometers.info/population/ (accessed on 30 June 2022)
- Report News Agency, Available online: https://report.az/en/ (accessed on 14 June 2022)
- NCDC Coronavirus microsite, Available online: https://covid19.ncdc.gov.ng/ (accessed on 14 June 2022)


 Impact Factor: * 3.6
 Acceptance Rate: 76.49%
  Time to first decision: 10.4 days
  Time from article received to acceptance: 2-3 weeks