Bone Developmental Toxicology Studies of Cadmium Chloride in Juvenile Sprague Dawley Rats
Shuyan Wang1,2#, Haimei Zhu2#, Qi Zhao1,2, Shenning Li2, Caiyun Li2, Yunliang Qiu1,2*, Yan Chang1,2*
1China State Institute of Pharmaceutical Industry, 285 Copernicus Road, Pilot Free Trade Zone, Pudong, Shanghai 201203, P.R. China;
2Shanghai InnoStar Bio-tech Co., Ltd., 199 Guoshoujing Road, Pilot Free Trade Zone, Pudong, Shanghai 201203, P.R. China;
#Shuyan Wang and Haimei Zhu contribute equal to this work.
*Corresponding Author: Yan Chang, China State Institute of Pharmaceutical Industry, 285 Copernicus Road, Pilot Free Trade Zone, Pudong, Shanghai 201203, P.R. China;
Yunliang Qiu, Shanghai InnoStar Bio-tech Co., Ltd., 199 Guoshoujing Road, Pilot Free Trade Zone, Pudong, Shanghai 201203, P.R. China.
Received: 07 March 2024; Accepted: 14 March 2024; Published: 28 March 2024.
Article Information
Citation: Shuyan Wang, Haimei Zhu, Qi Zhao, Shenning Li, Caiyun Li, Yunliang Qiu, Yan Chang. Bone Developmental Toxicology Studies of Cadmium Chloride in Juvenile Sprague Dawley Rats. Journal of Environmental Science and Public Health. 8 (2024): 22-31.
View / Download Pdf Share at FacebookAbstract
Cadmium (Cd) exposure is able to reduce the accumulation of bone mass and exert influence on bone maturity and differentiation. Children are in a critical period of bone maturity and differentiation. This study used juvenile rats to assess Cd effects on bone development. Four groups of 8 male and 8 female juvenile Sprague Dawley (SD) rats were treated with 0 (vehicle, deionized water), 0.5, 1.5, or 5.0 mg/kg/day cadmium chloride orally once daily for 9 weeks, on Postnatal Days (PND) 8 to 70. Bone development parameters, bone metabolism parameters, bone mineral density (BMD), and bone histomorphology were measured. The results showed that Cd accumulation in bone and blood caused severe damage to bone. Body weights, crown-rump lengths, bone lengths and weight gains in the 5.0 mg/kg/day group were statistically lower than those in the vehicle control group. The results of micro computed tomography (Micro-CT) and histological analysis revealed that the bone microstructure of the 5.0 mg/kg/day group has been significantly disrupted, especially trabecular, and the BMD of femur and tibia were reduced. Thus, cadmium chloride impaired bone development in juvenile rats, which may provide references for the toxicity of cadmium chloride and therapeutic target for Cd-associated bone damage in children.
Keywords
<p>Bone, Bone developmental toxicity, Juvenile rats, Cadmium chloride, Environmental</p>
Article Details
Abbreviations
Cd, Cadmium; SD, Sprague Dawley; PND, Postnatal Days; PNW, Postnatal Weeks; BMD, Bone Mineral Density; Micro-CT, Micro Computed Tomography; Ca, Calcium; P, Phosphorus; BTMs, Bone Turnover Markers; DEXA, Dual Energy X-ray Absorptiometry; WHO, World Health Organization; ELISA, Enzyme Linked Immunosorbent Assay; PTH, Parathyroid Hormone; CT, Calcitonin; IGF-I, Insulin Growth Factor-I; OC, Osteocalcin; CTX-I, Type I Collagen Cross-linked C-Telopeptide; ICP-MS, Inductively Coupled Plasma Mass Spectrometry; LLOQ, Lower Limit of Quantification; ROI, Region of Interest; H&E, Hematoxylin and Eosin.
1. Introduction
It has been reported that cadmium (Cd) is one of the most hazardous nonessential metal pollutants since it is released from many sources [1]. Nowadays, the level of cadmium exposure is high due to the fast growth of industrial activities in numerous developing countries[2-4]. The biological half-life of this metal pollutant in the human living organisms can be as long as 10–30 years. Previous studies have indicated that even low levels of Cd exposure are able to reduce the accumulation of bone mass and exert influence on bone maturity and differentiation. Children are in a critical period of bone maturity and differentiation. If children are exposed to the environment of cadmium pollution, which will have a serious effect on bone growth and development in children [5, 6, 7].
Food and tobacco are the main source of Cd exposure in general population [8, 9]. Once absorbed, Cd can retain in the human body and accumulate throughout life due to its long half-life [9]. Kidney, liver, lung, heart and bone are the most important target organs for Cd toxicity [9, 10]. Exposure to Cd has been linked to bone loss, low bone mass, osteoporosis, and increased risk of bone fractures [11]. Cd also directly affects the activity of osteoblasts and osteoclasts [12], resulting in imbalance of bone resorption and bone formation [13]. Studies have showed that Cd can cause severe skeletal damage for human and animals even at a low exposure level [14, 15]. Newborn male Wistar rats were administrated daily for 49 days with CdCl2 (1 mg/kg), the BMD and trabecular structure of the rats femurs were reduced [11]. Administration of 0.5 mg/kg/day of CdCl2 for 5 days, after a month, urine Cd and BMD values equivalent to those observed in humans living in areas highly contaminated with Cd, or exposed to Cd at their workplace [16]. However, to our knowledge, although studies in the literature have reported adverse effects of Cd on bone toxicity in adults and adult animals, the bone developmental toxicity of Cd in juvenile animals have been rarely reported.
Currently, there are several evaluation methods of bone toxicity have been reported in the literatures. I. Bone strength, performing testing of both axial and appendicular sites in bone quality studies, tests can include compression tests of vertebrae or vertebral bodies, bending tests of long bones, and femoral neck loading tests[17]. II. Bone metabolism parameters, including the level of calcium (Ca) and phosphorus (P), bone metabolism hormone, bone turnover markers (BTMs) which have become an auxiliary method to help clinicians diagnose bone metabolic diseases in recent years [18]. III. BMD, especially measured by dual energy x-ray absorptiometry (DEXA), which was the gold standard for diagnosing osteoporosis recommended by the World Health Organization (WHO) [19, 20]. IV. Bone histomorphology, by which the cells and microstructure of bone are observed under microscope, electron microscope and other high-resolution scanning technique.
In this study, we selected juvenile rats as a model animal, and used different evaluation methods to evaluate a variety of parameters which including bone development parameters, bone structure and microstructure, BMD and bone metabolism parameters. So, the aim of this study was to systematically investigate a serious effect on bone growth and development in children exposed to cadmium.
2. Materials and Methods
2.1 Animals
20 male and 20 female SD rats at the age of 8~9-weeks old were procured from a local supplier (Zhejiang Viton Lihua Laboratory Animal Technology Co., Ltd., license number SYXK (Shanghai) 2014-0009). All animals were housed in steel cages at 23~26 °C and a humidity of 40%~70% and exposed to a 12 h light-dark cycle. They had access to a standard rodent laboratory diet and drinking water ad libitum. The animals were housed according to the welfare of experimental animals.
2.2 Experimental design
During mating, 20 female and 20 male SD rats were randomly paired. The litter design was performed on PND4 according to principles of fostering design[21], the same-sex rats from different dams were put into each group and each of these rats was given the same dose level. Three groups of 8 male and 8 female juvenile rats were oral gavage administered 0.5, 1.5, 5.0 mg/kg cadmium chloride (Shanghai Titan Technology Co., Ltd., China) once daily for 9 weeks, the animals in the vehicle control group were treated with vehicle (deionized water), from PND 8 to 70 (corresponding to the development time of human bones) [20], at a dosing volume of 5 mL/kg[22]. Dose selection was based on an early dose range-finding study.
2.3 Sample collection
On PND71, rats were weighed and sacrificed by anesthesia using sodium pentobarbital (Alfasan International B.V.). The blood was collected and serum was separated via centrifuged at 1000 g for 15 minutes at 2-8 °C, and stored at -80 °C for further enzyme linked immunosorbent assay (ELISA) assessments. Bones were removed, cleared of soft tissues and weighed, left and right femurs preserved in formalin 10 % for Micro-CT analysis and histology analysis respectively; right tibias were stored in ETOH 70% for BMD analysis; left humerus were quickly frozen with liquid nitrogen and stored at -80 °C for Ca, P and Cd contents test.
2.4 Bone development parameters analysis
Body weight of each rat was measured once daily on PND7-PND49, then twice weekly thereafter till PND70. After weaning on PND21, food intakes and crown-rump lengths were recorded once weekly. After euthanasia, the lengths and weights of left femurs were measured by vernier caliper and precision balance, respectively.
2.5 Parathyroid Hormone (PTH), Calcitonin (CT), and Insulin Growth Factor-I (IGF-I) assay
The levels of PTH, CT and IGF-I in serum were measured by ELISA kits (Rat ELISA Kit, Cusabio, China), according to the protocols provided with the ELISA kits.
2.6 Osteocalcin (OC) and Type I Collagen Cross-linked C-Telopeptide (CTX-I) assay
The levels of osteocalcin and CTX-I in serum were measured by ELISA methods (Rat ELISA Kit, Cusabio, China). ELISA steps were performed according to the protocols provided with the ELISA kits.
2.7 Ca, P and Cd in the blood and bone analysis
Bone Cd, P, and Ca and blood Cd were determined by inductively coupled plasma mass spectrometry (ICP-MS) (iCAP-Q, Thermo, USA). Left humeri were collected and put into a digestion jar, and 1.5 mL nitric acid and 4.5 mL nitric acid were added. Microwave digestion was performed according to the following procedure: from room temperature to 190 °C for 25 min; kept 190 °C for 40 min; from 190 °C to room temperature for 15 min. After the sample was cooled to room temperature, the solution was transformed to 50 ml volumetric flask and diluted to scale, 45Scandium and 115Indium were used as the internal standard elements of Ca, P and Cd, and the standard detection mode (STD) was selected, the lower limit of quantification (LLOQ) was 50 ng/g. The content of Cd in the blood was also determined by microwave digestion, the digestion procedure and other steps were the same as above, LLQQ was 25 ng/ml. The level of Ca and P in the blood measured by automatic biochemical analyzer (HITACHI-7180, Japan).
2.8 Micro-CT analysis
Trabecular bone and bone microarchitecture of the left femurs were measured by a high-resolution Micro-CT scanner using specific software (Skyscan 1076 scanner, Belgium). Briefly, each scan was performed with a current of 250 µA, a source voltage of 40 kV, a rotation step of 0.6, and a full rotation of over 180. The pixel size was 18.26 µm, and the exposure time was 240 ms. Three-dimensional (3D) microstructural image data were reconstructed using NRecon software (SkyScan). Morphometric parameters of the trabecular bone in the femur were calculated using the SkyScan CT Analyzer (CTAn) software. Semi-automated contouring was used to select the region of interest (ROI) in the trabecular bone within the distal femur. The bone volume fraction (BV/TV), bone surface density (BS/TV), trabecular thickness (Tb.Th), trabecular number (Tb.N), trabecular separation (Tb.Sp) , etc. were measured, the BMD were determined according to the guidelines for assessment of bone microstructure in rodents using micro-CT.
2.9 Bone histology analysis
The right femurs were fixed in formalin 10% and decalcified in formic acid containing 5% formaldehyde for 72 h. Tissues were dehydrated in successive grades of ethanol series (70% and 95%) and finally cleared in xylene. Samples were then embedded in paraffin and sectioned at 3 µm longitudinally. The obtained sections were stained with hematoxylin and eosin (H&E). The stained sections were mounted on slides and evaluated by the microscope (Olympus, Tokyo, Japan) with the 10×1.25 objective lens.
2.10 Statistical Analysis
Data were presented as mean ± SD (application name: SPSS 21), which be analyzed to compare all treated groups to the control group via the methods below: ① Data within groups were evaluated for homogeneity of variance by Levene's test. For data whose variances were homogeneous (P>0.05), a one-way analysis of variance (ANOVA) was performed on the data; for nonhomogeneous data (P≤0.05), Dunnett T3 test was performed for comparison between groups (0.05 and 0.01 levels). ② Differences between the treated groups and the vehicle control group were further tested by LSD test for pairwise comparisons (at the 0.05 and 0.01 levels) only when the ANOVA is significant (P≤0.05); otherwise no further analyses were performed.
Data between the cadmium chloride (5.0 mg/kg/day) treatment group and the vehicle control group were analyzed by independent sample t-test. The difference is statistically significant if the "P" value is <0.05, and statistically highly significant if the "P" value is <0.01.
3. Results
3.1 Effect of the cadmium chloride on body weight and food consumption of juvenile animals
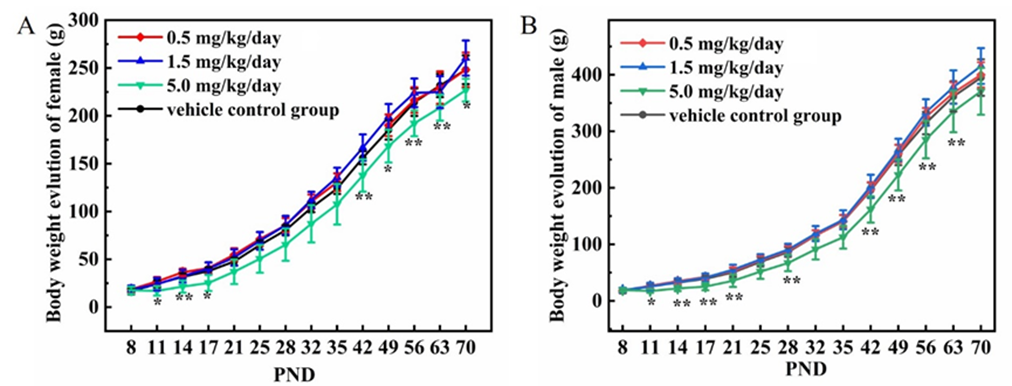
The body weight results were presented in Figure 1 A-B. Compared to the vehicle control group, oral treatment with cadmium chloride at 5.0 mg/kg/day caused lower body weight gains during the treatment period (P<0.05 or P<0.01); no notable changes in body weights were noted in cadmium chloride treated groups at 0.5 and 1.5 mg/kg/day.
Figure 1: Effect of cadmium chloride on body weights in juvenile SD rats. A: female rats; B: male rats. Values are expressed as mean ± SD. 7 female rats and 9 male rats at vehicle group, 8 rats per sex at 0.5 and 1.5 mg/kg/day groups, 8 female rats at 5 mg/kg/day group, 7 male rats at 5 mg/kg/day group during PND16-PND17, 6 male rats at 5 mg/kg/day group starting with PND18. * P < 0.05 and ** P < 0.01 indicate significant difference and highly significant difference compared to the vehicle control group, respectively.
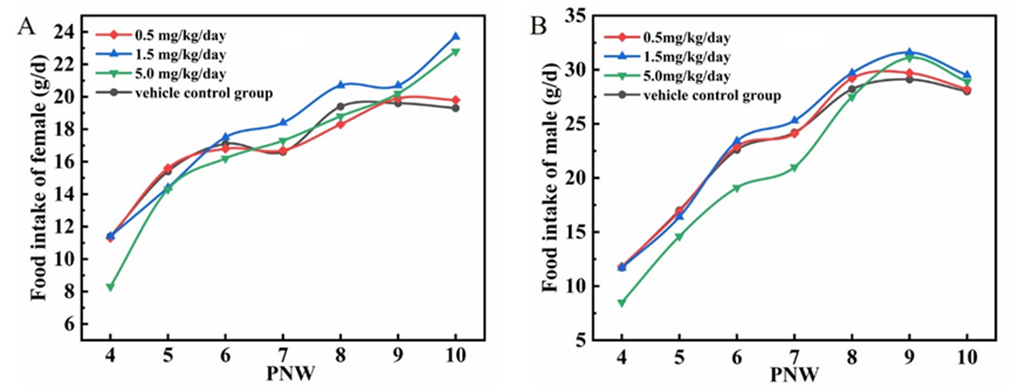
The food consumption results were presented in Figure 2 A-B. Compared to the vehicle control group, the food consumption at 5.0 mg/kg/day group after weaning were lower. However, the food consumption at all treated groups were gradually approached the vehicle control group from Postnatal Weeks (PNW) 6, even higher on PNW10.
3.2 Effect of the cadmium chloride on crown-rump lengths of juvenile animals
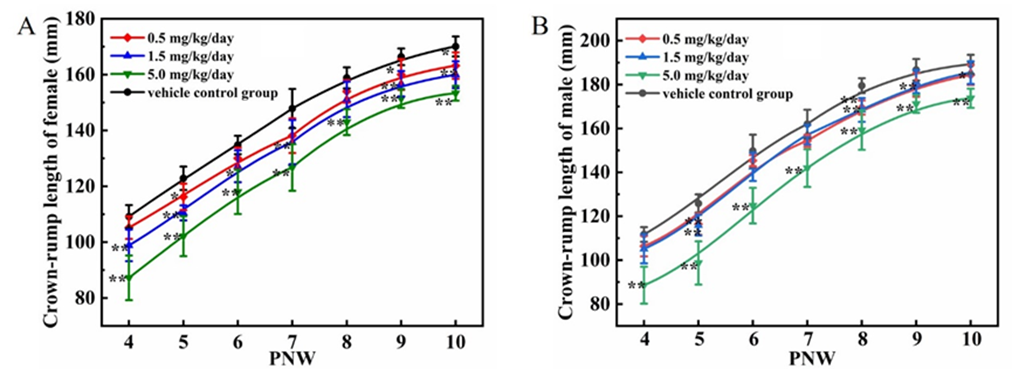
The results of crown-rump lengths were presented in Figure 3 A-B. Compared to the vehicle control group, decreases in the crown-rump length gains were observed in all cadmium chloride treated groups (P<0.05 or P<0.01).
Figure 3: Effect of cadmium chloride on crown-rump lengths in juvenile SD rats. A: female rats; B: male rats. Values are expressed as mean ± SD. 7 female rats and 9 male rats at vehicle group, 8 rats per sex at 0.5 and 1.5 mg/kg/day groups, 8 female rats and 6 male rats at 5 mg/kg/day. * P < 0.05 and ** P< 0.01 indicate significant difference and highly significant difference compared to the vehicle control group, respectively.
3.3 Effect of the cadmium chloride on the bone weights and lengths of right femur
The results of bone weights and lengths were presented in Table 1. Compared to vehicle control group, it showed that the bone weights at 5.0 mg/kg/day treatment group were decreased (P<0.05 or P<0.01). Moreover, oral treatment with cadmium chloride caused the bone lengths decreased significantly (P<0.05 or P<0.01).
Table 1:Effects of CdCl2 on length and weight of right femur between vehicle control group and treatment groups.
|
Parameters |
Groups (mg/kg/day) |
||||
|
0 |
0.5 |
1.5 |
5 |
||
|
Bone weights(g) |
Female |
0.84±0.04 |
0.82±0.06 |
0.83±0.07 |
0.74±0.03** |
|
Male |
1.16±0.18 |
1.09±0.06 |
1.10±0.03 |
1.04±0.09* |
|
|
Bone lengths(mm) |
Female |
32.89±2.23 |
32.33±0.71** |
31.78±0.52** |
30.83±0.27** |
|
Male |
35.94±0.57 |
35.86±0.64 |
35.19±0.50* |
34.02±0.94* |
|
Note: Mean ± SD, 7 female rats and 9 male rats at vehicle group, 8 rats per sex at 0.5 and 1.5 mg/kg/day groups, 8 female rats and 6 male rats at 5 mg/kg/day. *P < 0.05 and ** P < 0.01 relative to corresponding vehicle control.
3.4 Effect of cadmium chloride on the bone metabolism hormone in the serum
The results of CT, PTH and IGF-I were presented in Figure 4 A-C. Compared to the vehicle control group, the CT of female rats at 5 mg/kg/day group were significantly increased (P<0.01); whereas there were no significant changes in male rats. Obviously, the PTH were increased at 1.5 and 5 mg/kg/day groups (P<0.05 or P<0.01); moreover, there were a dose-dependent relationship between the PTH concentration and cadmium chloride exposure in male rats (Figure 4 B). There is no effect of cadmium chloride on the concentration of IGF-I.
3.5 Effect of cadmium chloride on the BTMs in the serum
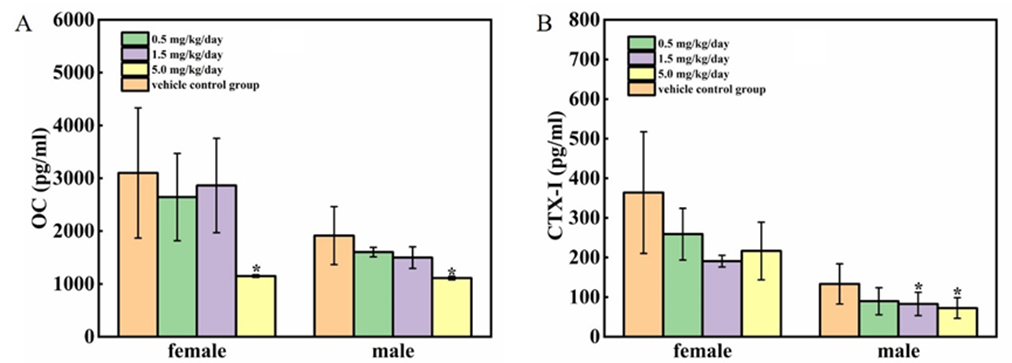
The results of osteocalcin (OC) and CTX-I were presented in Figure 5 A-B. Compared to the vehicle control group, the concentration of osteocalcin (OC) at all treated groups were decreased, but only had significance at 5 mg/kg/day group (P<0.05); The concentration of CTX-I was also decreased, and there were significant differences in male rats at 1.5 and 5 mg/kg/day groups (P<0.05).
3.6 Effect of cadmium chloride on the concentration of Ca, P, Cd in the humerus
The concentration of Ca, P and Cd in the bone were presented in Figure 6 A-C. The concentration of Ca and P at all treated groups were decreased to some extent, among which male rats at 1.5 mg/kg/day group were significantly lower than at 0 mg/kg/day group (P<0.05). Not surprisingly, the bone Cd at all treated groups were significantly increased (P<0.01), moreover, the bone Cd were increased dose-dependently.
Figure 6: Effect of cadmium chloride on the content of Ca, P, Cd in the humerus. KCause the Cd of humerus in the vehicle control group were below the test line (50 ng/g), no data were available in Figure 6 C. Values are expressed as mean ± SD from 5 animals from each group. *P < 0.05, **P < 0.01. Compared to the male control group, #P < 0.05,##P < 0.01.
3.7 Effect of cadmium chloride on the concentration of Ca, P, Cd in the serum
The results of Ca, P and Cd in the serum were presented in Figure 7 A-C. Compared to the vehicle control group, the concentration of serum Ca at 1.5 mg/kg/day group were significantly increased (P<0.05 or P<0.01), but were still within the range of historical controls in our laboratory and had not dose-dependent, and were considered no biological significance; Serum P of the male rats exposed to all treated groups were significantly increased (P<0.01). Serum Cd at all treated groups were significantly increased (P<0.05 or P<0.01).
Figure 7: Effect of cadmium chloride on the concentration of Ca, P, Cd in the serum. KBecause Cd in the serum was below the minimum detection limit (25 pg/mL) at vehicle control group, no data were available in Figure 7 C. Values are expressed as mean ± SD from 5 animals from each group. Compared with the control group, *P < 0.05, **P < 0.01. Compared to the male control group, # P < 0.05,## P < 0.01.
3.8 Effect of cadmium chloride on the bone microstructure measured by Micro-CT
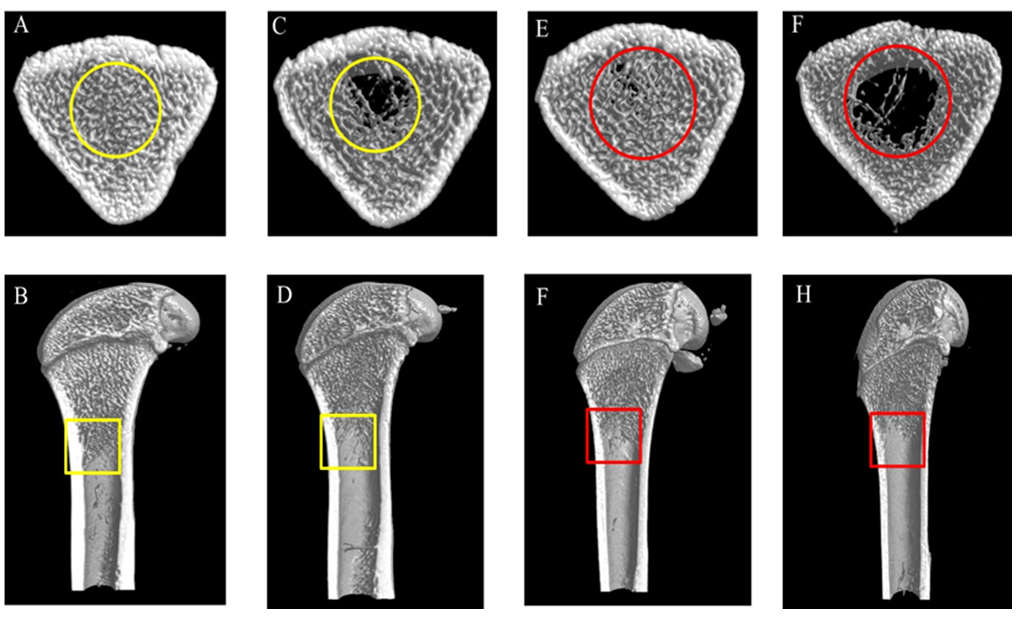
The results of bone microstructure indexes were presented in Table 2, which verified the changes of 3D bone images in Figure 8. The BV, BV/TV, BS, BS/TV, Tb.Th, Tb.N, and BMD were lower at 5.0 mg/kg/day group than at corresponding vehicle control group (P<0.05 or P<0.01). Moreover, the BS/BV and Tb.Sp at 5.0 mg/kg/day group were higher than at corresponding vehicle control group (P<0.05 or P<0.01).
Table 2: Effects of CdCl2 on the parameters of femur microstructure detected by Micro-CT
|
Parameters |
Groups (mg/kg/day) |
|||
|
Females |
Males |
|||
|
0 |
5 |
0 |
5 |
|
|
TV (mm^3) |
26.55±1.85 |
25.95±1.96 |
39.92±1.87 |
38.63±2.85 |
|
BV (mm^3) |
9.46±1.58 |
4.86±1.16** |
4.33±1.34 |
2.24±0.75# |
|
BV/TV (%) |
36.00±7.70 |
18.70±3.87** |
10.92±3.62 |
5.74±1.49# |
|
TS (mm^2) |
59.13±1.87 |
58.50±1.38 |
76.33±2.29 |
74.63±2.93 |
|
BS (mm^2) |
268.44±16.61 |
174.93±26.79** |
168.32±35.79 |
110.12±30.79# |
|
BS/BV(1/mm) |
28.91±4.35 |
36.51±3.11* |
39.73±3.63 |
49.81±4.30# |
|
BS/TV(1/mm) |
10.15±0.89 |
6.74±0.90** |
4.24±1.01 |
2.82±0.58# |
|
Tb.Th (mm) |
0.127±0.015 |
0.103±0.007* |
0.100±0.007 |
0.085±0.005# |
|
Tb.N (1/mm) |
2.815±0.311 |
1.810±0.270* |
1.080±0.284 |
0.669±0.141# |
|
Tb.Sp (mm) |
0.228±0.022 |
0.492±0.162* |
0.729±0.140 |
1.252±0.245# |
|
BMD (g/cm3) |
0.608±0.065 |
0.492±0.162** |
0.345±0.038 |
0.280±0.019** |
Note: Mean ± SD, n = 5 rats/group. Compared with the control group, *P < 0.05, **P < 0.01. Compared to the male control group, # P < 0.05,## P < 0.01.
3.9 Effect of cadmium chloride on the 3D microarchitecture in the right femur
The 3D microarchitecture of the right femurs had been depicted in Figure 8 A-H. Compared to the vehicle control group, the bone microstructure at 5.0 mg/kg/day were seriously damaged, the number of trabecular at the distal right femur were sharply reduced and hollowed, trabecular number in the femoral shaft were also reduced.
3.10 Effect of the cadmium chloride on the bone histology of juvenile rats
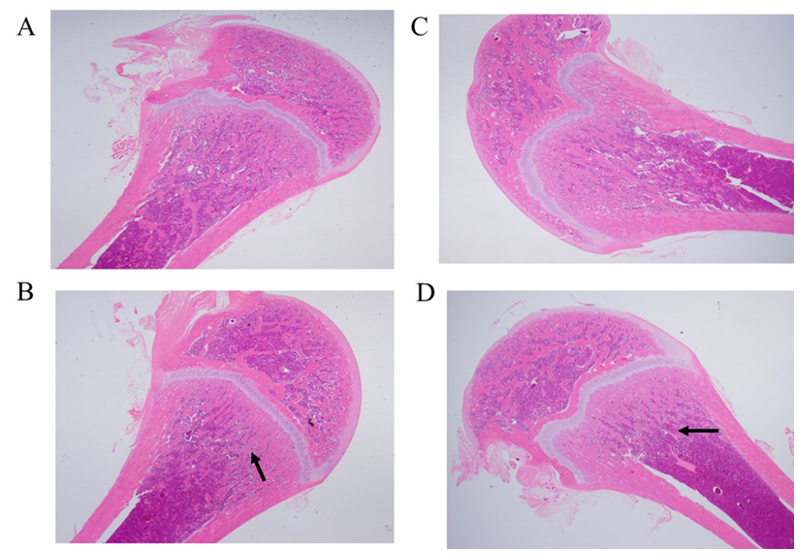
The results of bone histological analysis were depicted in Figure 9 A-D. Compared to the vehicle control group, a slightly decrease of trabecular number in the epiphyseal of juvenile rats in the 5.0 mg/kg/day group (arrow mark, HE, 10×1.25). However, no obvious lesions were found in the left femur at 0.5 and 1.5 mg/kg/day groups.
4. Discussion
It is well known that Cd is a toxic metal that is widely present in the environment, many different forms of exposure to cadmium have been shown over the past century [23, 24]. The Cd is absorbed mainly through the respiratory tract and a smaller extent via the gastro-intestinal tract, while skin absorption is relatively rare. Cd is characterized by a strong cumulative effect in humans and animals and its content in living organisms increases with age. Children encounter the chronic and low-dose Cd exposure frequently in early life, the Cd is retained in the body and has a potentially negative impact on human health. Bone loss and increased susceptibility to fractures caused by Cd is the most frequent degenerative disease [25]. Several studies have demonstrated that low bone mineral density was induced by cadmium exposure in rat bone tissue [26, 27]. How cadmium affects bone in children during rapid growth and bone accrual is not clear. The aim of this study was to better understand the underlying toxicity characteristics of Cd-associated bone damage in juvenile rats.
It has been reported that continuous Cd intake may affect the growth and development, physiological state and food consumption of animals [28]. In our study, the body weights, right femur weights at 5 mg/kg/day were significantly decreased, however, there were no significant change at 0.5 and 1.5 mg/kg/day groups. Furthermore, the crown-rump lengths and right femur lengths in all treated groups were decreased, these data suggest that crown-rump lengths and bone lengths are more suitable for evaluating bone developmental toxicity. The food consumption at all treated groups were decreased, but as rats age increased, the effect of cadmium chloride on their food consumption gradually decreased. These above results are partly consistent with the results reported by Zhang et al [28].
PTH stimulates osteoclasts to lyse bone mineralized matrix and increase serum Ca concentration, CT inhibits bone absorption and reduces blood Ca concentration [29]. In our study, except for the PTH levels in the male cadmium chloride exposure group did not change significantly, the PTH and CT levels in the other treatment groups increased to varying degrees. There were consistent with the results of serum Ca levels remained unchanged [29]. IGF-I is an essential hormone in pediatric muscle and bone development. The effect of cadmium chloride on the level of IGF-I also had no significant change in our study.
Approximately 99% of total body Ca is found in bone in the form of hydroxyapatite [30]. Our research showed that Cd accumulation in the left humerus and blood were significantly higher, the bone Ca and P status of the rats in the treated groups were slightly disordered, but the blood Ca and P content of rats did not change. We speculated that the accumulation of cadmium chloride does make the Ca and P imbalance, but due to the regulation of serum Ca and P by PTH and CT and bone damage repair reaction, there were no obvious changes in serum Ca and P.
Bones are constantly remodeled throughout life to maintain robust structure and function[31]. The bone remodeling/modeling process is accomplished by precise coordination of resorption, synthesis, and mineralization of the bone matrix by osteoclasts and osteoblasts [31]. OC, the most abundant non-collagen protein synthesized by mature osteoblasts, is generally regarded as a specific makers of bone formation [32]. OC secreted osteocalcin through carboxylation, most of them were deposited in the bone matrix, and a few of them entered the blood circulation [33]. CTX-I, a collagen degradation product released by osteoclasts, is considered as a marker of bone resorption. when the bone matrix is degraded, CTX-I enters the blood circulation together with the degraded bone matrix. In our study, the level of OC and CTX-I in the serum were lower in the cadmium chloride treatment group than vehicle control group. The results suggested a decrease in both bone formation and bone resorption, but the trend of CTX-I was inconsistent with the previous report [32]. We speculated that this may be due to the fact that CTX-I is only detected at the end of treatment, and the bone damage repair response plays a role, which is a compensatory regulation of the organism. Therefore, we suggest that several more BTMs detection points should be set up during the bone development of juvenile animals, but due to the small size of juvenile animals, it is not possible to collect too many blood samples at one time.
Trabecular bone is an extension of the cortical bone in the medullary cavity which can reflect the mechanical property of the bone [34]. Many studies have reported that relatively low exposure to Cd cause significant damage to bone tissue, especially trabecular bone [35, 36]. Our study found that trabecular number in the epiphyseal of the 5 mg/kg/day group had a slight decrease on HE staining, while it had not significantly change at 0.5 and 1.5 mg/kg/day. The 3D images obtained by micro-CT were clearly shown osteoporosis with reduced trabecular number and loose shape at 5 mg/kg/day group. Moreover, bone microstructure parameters detected by micro-CT also indicated that 5 mg/kg/day cadmium chloride exposure did cause serious damage to the bone, destroyed the bone microstructure. Meanwhile, micro-CT was used to analyze the BMD of the right femur. The results showed that decreased BMD in the 5 mg/kg/day group was detected.
In summary, our results demonstrate that chronic cadmium exposure during early childhood might affect bone remodeling and growth in a pre-adulthood phase. This study comprehensively evaluated the bone developmental toxicity, which indicated cadmium-related associations with the changes of bone biomarkers before adolescence may have long-term consequences in the form of bone mass and bone health in adulthood, for example, osteoporosis in adulthood. In addition, the relationship between bone markers and bone microstructure parameters was not so clear in our study, which may be due to the small number of rats. All these issues need to large number animals and be further explored.
5. Conclusion
Cadmium exposure remains a threat to human health especially in children worldwide. Children are in a critical period of growth and development and living in rapidly industrializing environment face additional risks for exposure to cadmium. Reducing cadmium exposure is necessary to prevent bone development toxicity in human in early life. It must be prioritized to promote lifelong health and well-being.
Authors contributions
#SW and #HZ contributed equally. YC and YQ designed the research. HZ and YL performed the experiments. SL and HZ prepared all figures. SW and HZ wrote the main manuscript text. YC and YQ revised the manuscript text and figures and provided scientific suggestions. All authors analyzed the data, reviewed the manuscript, and read and approved the final manuscript.
Acknowledgment
This study was supported by grants from Shanghai INNOSTAR Bio-Tech Co., Ltd.
Funding
This work was supported by the 13th Five-Year Major Project (2018ZX09201017-008).
Conflict of interest statement
The authors declare that they have no competing interests.
References
- Satarug S, Vesey DA, Gobe GC. Kidney cadmium toxicity, diabetes and high blood pressure: The perfect storm. Tohoku J Exp Med 241 (2017): 65–87.
- Olsson IM, Bensryd I, Lundh T, et al. Cadmium in blood and urine--impact of sex, age, dietary intake, iron status, and former smoking-association of renal effects. Environ Health Perspect 110 (2002): 1185-1190.
- Chen X, Zhu G, Jin T, et al. Effects of cadmium on bone mineral density in the distal and proximal forearm: two female population studies in China. Biol Trace Elem Res 156 (2013): 45-48.
- Orisakwe OE. Lead and cadmium in public health in Nigeria: physicians neglect and pitfall in patient management. N Am J Med Sci 6 (2014): 61-70.
- Mhungu F, Chen K, Wang Y, et al. Probabilistic Risk Assessment of Dietary Exposure to Cadmium in Residents of Guangzhou, China-Young Children Potentially at a Health Risk. Int J Environ Res Public Health 19 (2022): 9572.
- Sripada K, Lager AM. Interventions to reduce cadmium exposure in low- and middle-income countries during pregnancy and childhood: A systematic review. J Glob Health 12 (2022): 04089.
- Malin Igra A, Vahter M, Raqib R, et al. Early-Life Cadmium Exposure and Bone-Related Biomarkers: A Longitudinal Study in Children. Environ Health Perspect 127 (2019): 37003.
- Reyes-Hinojosa D, Lozada-Perez Ca, Zamudio Cuevas Y, et al. Toxicity of cadmium in musculoskeletal diseases. Environ Toxicol Pharmacol 72 (2019): 103219.
- Knani L, Bartolini D, Kechiche S, et al. Melatonin prevents cadmium-induced bone damage: First evidence on an improved osteogenic/adipogenic differentiation balance of mesenchymal stem cells as underlying mechanism. J Pineal Res 67 (2019): e12597.
- Boughammoura S, Ben Mimouna S, Chemek M, et al. Disruption of Bone Zinc Metabolism during Postnatal Development of Rats after Early Life Exposure to Cadmium. Int J Mol Sci 21 (2020): 1218.
- Graniel-Amador MA, Torres-Rodríguez HF, Jiménez-Andrade JM, et al. Cadmium exposure negatively affects the microarchitecture of trabecular bone and decreases the density of a subset of sympathetic nerve fibers innervating the developing rat femur. BioMetals (2020): 1-10.
- Ma Y, Ran D, Cao Y, et al. The effect of P2X7 on cadmium-induced osteoporosis in mice. J Hazard Mater (2020): 124251.
- Chen X, Ren S, Zhu G, et al. Emodin suppresses cadmium-induced osteoporosis by inhibiting osteoclast formation. Environ Toxicol Pharmacol 54 (2017): 162-168.
- Rodriguez J, Mandalunis PM. Effect of cadmium on bone tissue in growing animals. Exp Toxicol Pathol 68 (2016): 391-397.
- Brzóska MM, Roszczenko A, Yn-Sidorczuk MG, et al. Zinc supplementation can protect from enhanced risk of femoral neck fracture in male rats chronically exposed to cadmium. Exp Toxicol Pathol 63 (2011): 491-498.
- Chen X, Zhu G, Jin T, et al. Bone-prognostic status after cessation of cadmium exposure for one month in male rats. Arch Environ Contam Toxicol 62 (2012): 165-175.
- Guideline I. Nonclinical safety testing in support of development of paediatric pharmaceuticals 11 (2020): 1-39.
- Szulc P. Bone turnover: Biology and assessment tools. Best Pract Res Clin Endocrinol Metab 32 (2018): 725-738.
- Kim HS, Jeong ES, Yang MH, et al. Bone mineral density assessment for research purpose using dual energy X-ray absorptiometry. Osteoporos Sarcopenia 4 (2018): 79-85.
- Bergh C, Söderpalm A-C, Brisby H. Preoperative dual-energy X-ray absorptiometry and FRAX in patients with lumbar spinal stenosis. J Orthop Surg Res 13 (2018): 1-7.
- Kim NN, Parker RM, Weinbauer GF, et al. Points to Consider in Designing and Conducting Juvenile Toxicology Studies. Int J Toxicol 36 (2017): 325-339.
- Hoberman AM, Barnett JF. Juvenile Toxicity Study Design for the Rodent and Rabbit. Pediatric nonclinical drug testing: principles, requirements, and practices Wiley (2012): 141-182.
- Rahimzadeh MR, Rahimzadeh MR, Kazemi S, et al. Cadmium toxicity and treatment: An update. Caspian J Intern Med 8 (2017): 135–145.
- Ou L, Wang H, Wu Z, et al. Effects of cadmium on osteoblast cell line: Exportin 1 accumulation, p-JNK activation, DNA damage and cell apoptosis. Ecotoxicol Environ Saf 208 (2021): 111668.
- Marcu FL, Bogdan FL, Mutiu G, et al. The histopathological study of osteoporosis. Rom J Morphol Embryol 52 (2011): 321-325.
- Uwagie-Ero EA, Abiaezute CN, Nwaehujor CO, et al. Osteocyte viability and bone density in cadmium chloride-induced osteoporosis ameliorated with Pilostigma thonningii stem bark-extracted D-3-O-methy-chiroinositol. Animal Model Exp Med 2 (2019): 25-33.
- Rodríguez J, Mandalunis PM. Effect of cadmium on bone tissue in growing animals. Exp Toxicol Pathol 68 (2016): 391-397.
- Zhang T, Gao X, Luo X, et al. The effects of long-term exposure to low doses of cadmium on the health of the next generation of mice. Chem Biol Interact 312 (2019): 108792.
- Bhattarai Hk, Shrestha S, Rokka K, et al. Vitamin D, Calcium, Parathyroid Hormone, and Sex Steroids in Bone Health and Effects of Aging. J Osteoporos 2020 (2020): 1-10.
- Morelli Mb, Santulli G, Gambardella J. Calcium supplements: Good for the bone, bad for the heart? A systematic updated appraisal. Atherosclerosis 296 (2020): 68-73.
- Alford AI, Kozloff KM, Hankenson KD. Extracellular matrix networks in bone remodeling. Int J Biochem Cell Biol 65 (2015): 20-31.
- Li Jq, Zhang Hy, Yang C, et al. An overview of osteocalcin progress. J Bone Miner Metab 34 (2016): 367-379.
- Greenblatt MB, Tsai JN, Wein MN. Bone Turnover Markers in the Diagnosis and Monitoring of Metabolic Bone Disease. Clin Chem 63 (2017): 464-474.
- He S, Zhuo L, Cao Y, et al. Effect of cadmium on osteoclast differentiation during bone injury in female mice . Environ Toxicol 35 (2020): 487-494.
- Satarug S, Vesey DA, Gobe GC. Current health risk assessment practice for dietary cadmium: Data from different countries . Food Chem Toxicol 106 (2017): 430-445.
- Duranova H, Martiniakova M, Omelka R, et al. Changes in compact bone microstructure of rats subchronically exposed to cadmium . Acta Veterinaria Scandinavica 56 (2014): 1-8.





 Impact Factor: * 3.6
 Acceptance Rate: 76.49%
  Time to first decision: 10.4 days
  Time from article received to acceptance: 2-3 weeks