Municipal Solid Waste Characterization as a Measure towards Sustainable Waste Management in Abuja, Nigeria
Aderoju Olaide M1,2 * , Guerner Dias A1
1Department of Geosciences, Environment and Spatial Planning, Faculty of Sciences, University of Porto, Portugal
2National Space Research and Development Agency (NASRDA), Abuja, Nigeria
*Corresponding Author: Aderoju Olaide, Department of Geosciences, Environment and Spatial Planning, Faculty of Sciences, University of Porto, Portugal
Received: 08 February 2020; Accepted: 18 February 2020; Published: 1 April 2020
Article Information
Citation:
Aderoju Olaide M , Guerner Dias A. Municipal Solid Waste Characterization as a Measure towards Sustainable Waste Management in Abuja, Nigeria. Journal of Environmental Science and Public Health 4 (2020): 43-60.
View / Download Pdf Share at FacebookAbstract
The constant generation of Municipal Solid Waste (MSW) is a global concern in terms of quantity and its variety. The composition of MSW is influenced by the level of income; the season of the year; population; culture and lifestyle of people living in that community. Nigeria, in particular, is currently struggling with the menace of the upsurge in the quantity MSW in her major cities, but concern only with its collection, transportation, and disposal, however neglecting the prospect of material recovery from MSW for recycling. On this note, the study aimed to characterize MSW from identified dumpsites and at household level in Abuja Municipal Area Council (AMAC) and Bwari area council, Abuja, Nigeria towards a sustainable and efficient MSW management. The methodology used in this study was carried out in both wet and dry seasons, and each season entails; the use of American Standard Test Method [1] to determine the composition of unprocessed MSW at dumpsites 3 days in a week for 4 weeks and, the segregation of MSW into colored bags representing waste category at the household level was done for 2 weeks. The use of a stratified and random sampling method was employed to administer the questionnaires for data acquisition. The results show that the level of income played a significant role in the constituents of MSW generated at district level. In conclusion, food waste/organics and plastic waste are the predominant MSW categories in AMAC, and Bwari area council, Abuja, Nigeria. The characterization of MSW is essential for a long-term effect and sustainable solid waste management plans in order to design an appropriate and efficient waste management system for the society.
Keywords
<p>Characterization; Dumpsite; Household; Municipal Solid Waste; Recycling</p>
Article Details
1. Introduction
The continuous generation of Municipal Solid Waste (MSW) in the world in terms of quantity and variety is inevitable. Hence, it has become an environmental concern that requires urgent attention globally. According to UNU-WIDER [2], solid waste management in developing countries has received less attention from policymakers and academics than that paid to other environmental problems. Globally, the solid waste generation has soared in the past few decades, resulting in the overstretching of waste management facilities, and the inability of waste management authorities to cope with the volume of solid waste generated [3]. The estimate of global MSW generation is about 1.3 billion tons/year and increases by 1% yearly [4]. In 1990 for instance, each individual in the world produced an average of 250 kg of MSW [5]. In the European Union countries, over 250 x 106 tonnes of MSW are produced each year, with an annual growth of 3% [6] ). Nigeria, in particular, is currently struggling with the menace of the upsurge in the quantity MSW in her major cities whereby the burden of collection, transportation, and disposal is overwhelming with little attention by the authorities. MSW consists of domestic waste generated by urban residents (households) with the addition of co mmercial wastes, but typically excludes industrial hazardous waste and domestic sewage sludge [7]. Typically, MSW possesses three characteristics, namely: the weight of the waste generated, density and its constituents which its variation among countries is a function of the level of industrial development [8]. According to [9], waste composition is also influenced by external factors, such as geographical location, the population’s standard of living, energy source, and weather. Also, Bichi and Amatobi in 2013 [10] reported that the composition and characteristics of municipal solid waste are influenced by certain factors, which include the area (residential, co mmercial, etc.), the economic level (differences between high and low-income areas), the season and weather (differences in the amount of population during the year, tourist places) and culture of people living or doing business in the area. Waste characterization consists of collecting waste at its source and directly sorting it out into defined types of materials [11,12]. Several studies have been carried out using different approach of characterizing MSW in different parts of the globe. The two most widely used methods for waste characterization are the materials flow method (industrial method of waste generation estimation through production, import and export of goods) and site-specific sampling via sorting and weighing refuse by category [13]. The knowledge of the sources and types of waste in an area is required in order to design and operate appropriate solid waste management systems [14, 15] in their research revealed that a comprehensive characterization of MSW is crucial to the long-term efficient and economical planning for solid waste management. This study considered the MSW in households in every district of the study area, and major disposal sites for proper investigation and identifying the predominant components in the waste stream in the study area. On this note, the study aimed to characterize MSW from household, and identified dumpsites in Abuja Municipal Area Council (AMAC) and Bwari area council, Abuja, Nigeria towards a sustainable and efficient MSW management. Furthermore, MSW characterization plays an important role in the determination of the possible environmental impacts on nature as well as on society [16]. Therefore, the characterization of MSW in Abuja is a vital step towards achieving a sustainable solid waste management program as it will enable an efficient recycling and recovery of useful materials.
2. Materials and Methods
The methodology employed in this research is an analytical approach. This study utilizes statistic analysis in describing the composition of waste streams. Data were gathered through field investigation of households in AMAC, and on-site characterization of MSW in 4 main dumpsites as identified by the Abuja Environmental Protection Board (AEPB) within the study area.
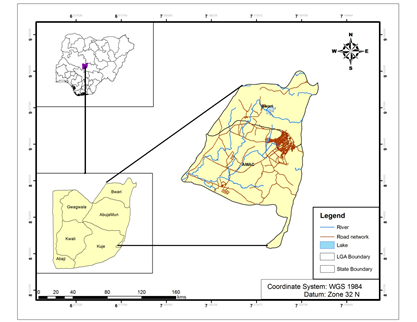
Figure 1: Study area map.
2.1 Study area
Abuja is the capital city of Nigeria, which is located in the center of Nigeria in the Federal Capital Territory (FCT) within latitude 7° 25' N and 9° 20’ N of the equator and longitude 5° 45' E and 7° 39' E of the meridian. The Federal Capital Territory has a land area of 7,753.85 km2 square kilometers. It has a population of about 2,238,800 persons [17]. Abuja lies within the Guinea savannah vegetation belt and experiences two seasons, namely dry and wet seasons. These regions comprise the Precambrian Basement Complex and sedimentary rocks, which both have very strong influence on the morphological characteristics of the local soil [18]. Abuja experiences an average daily minimum and maximum temperature of 20.5ºC and 30.8ºC respectively. It has a mean rainfall and humidity of about 119.2 mm and 58.4%, respectively, with the highest in August and lowest between November and March respectively.
2.2 Data use and data source
The data type used for this study was both from primary and secondary data sources. The primary data source is from the field investigation of sampled households and the waste characterization of the dumpsites while the secondary data source is base maps obtained from the National Space Research and Development Agency (NASRDA), Abuja.
2.3 Dumpsite field characterization
The four major dump sites visited for the collection of samples, and MSW segregation during the field investigation were; Kubwa, Dutse, Gosa and Karshi dumpsites. In each of the dumpsites visited, fresh samples of MSW were collected twice daily (mornings and evenings) from transporting trucks carrying it, and emptying it into the dump sites. Each of the fresh samples was collected up to a fixed mass of 50 kg for each collection and sampling was carried out in accordance to the ASTM test method D5231- 92 (2016). This method was used to evaluate the mean composition of unprocessed MSW samples collected. After every collection, samples were weighed up to a fixed weight of 50kg separately and emptied on a tarpaulin laid on the floor for the purpose of manual sorting into different components. Each of the different components was weighed individually depending on the component’s category. The use of a trained collector as well as two scavengers on-site carried out the sorting, weighing and categorizing of MSW for the four mentioned dumpsites. It was ensured that sample of waste stream collected were thoroughly mixed. The MSW segregation exercise was carried out continuously 3 days in a week for 4 weeks at each dumpsite location.
The tools used were: hand shovel; hand rake; hand gloves; gas mask; tarpaulin; and a digital bench scale. The weight of the sorted MSW was measured with a digital bench scale whereby the average weight and the percentage for each category of MSW was computed. The duration of the entire field investigation was done during the wet and dry season, and each field investigation lasted for 8 weeks.
2.4 Districts income classification
Abuja, is clearly delineated into districts, thereby the type of infrastructures present, defines the inhabitants as high or low income earners. The high income earner’s district is clearly described as: a well planned residence and good housing facilities; better security services; accessibility to good health facilities; education (private or public); coordinated markets/shopping malls; good water and sanitation services among others. Also, studies have revealed that high income areas of any community are distinguished by the quantity and type of MSW they generate.
Districts that shortfall of the above mentioned facilities and services are occupied by populace of low-income. According to [3], the type of residual waste high-income earners produce are more of inorganic materials such as plastics and paper packages, while low-income earners produce more of food waste and vegetables which is relatively organic in nature.
2.5 Household characterization; sampling methods and msw sample size
In this study, structured questionnaire was administered through the use of a stratified and random sampling method for data acquisition. Structured questionnaires have been used to study MSW characterization, collection method, and recycling by previous researchers such as [19, 20] among others. Notification flyers were distributed to specific households to be sampled for the purpose of sensitization. However, before embarking on sampling of households on MSW characterization, the decision on sample size is required [21], stated that in the planning of a sample survey; a stage is always reached where a decision must be made about the size of the sample specifically, when samples are too large it simply implies a waste of resources, and too small a sample diminishes the utility of the results [22]. The study area (AMAC and Bwari area council), was divided into strata which represent the districts such that each district is a stratum. Notification flyers with details of the significance of the field survey based on research preamble and benefits was distributed in the study area districts. There were 2500 flyers distributed to households, but just 1479 households indicated interest in their household be surveyed.
In each stratum, households were surveyed randomly for 2 weeks in dry and wet seasons with the aim of a definitive and representative sample size for the whole study area. Coloured bags (see Table 2) representing different and defined MSW components were distributed to households to be surveyed with a good education on the procedure on how to separate their waste into the colored bags. The formula of sampling for continuous variable measurements reported by Cochran [21] has been widely used by many researchers [23]. The estimation of minimal sample size for a representative household sample analysis in this study is calculated by [21, 22];

Where: n = required sample size; Z = confidence interval; p = percentage of households selected in the choice, expressed as decimal; d = confidence interval or accepted margin of error expressed as a decimal. For surveys of the population (N), it is imperative we reach at least 5% of households in the study area. The required sample size (n) of household is selected from the 16 strata (districts) of the study area, in order to ensure the results representativeness, information reliability resulting from the study to validate the final result. Before choosing a sample size when we have a large number of samples, thus we need to attain a 95% confidence interval thereby the margin of error is ± 5%.
This study area is quite large with the number of households greater than 50,000 which in turn require a number of representative households for sampling. With over a 20% rate of non participation to the survey, we found n ≥ 385 households which indicates that a minimum 385 households or moreshould be sampled to arrive at an accurate result. During the survey investigation, 1479 households were sampled, but the number successive sampled households were 939 due to some inconsistencies on the part of some households.
The (Table 1) shows the number of sampled households and number of successful sampled households.
|
Strata ( Districts) |
NSH |
NSSH |
|
Asokoro |
55 |
32 |
|
Maitama |
50 |
29 |
|
Wuse |
158 |
117 |
|
Garki and Garki II |
177 |
122 |
|
Kubwa |
142 |
103 |
|
Dutse |
75 |
49 |
|
Gwarinpa |
100 |
61 |
|
Durumi |
80 |
57 |
|
Bwari |
63 |
38 |
|
Kado /Life Camp |
100 |
46 |
|
Karu / Nyanya |
100 |
72 |
|
Utako / Jabi |
100 |
52 |
|
Wuye |
60 |
32 |
|
Mpape |
68 |
37 |
|
Airport |
106 |
69 |
|
Mabushi / Jahi |
45 |
23 |
Number Sampled Households (NSH) = 1479; Number Successive Sampled Households (NSSH) = 939.
Table 1: Distribution of surveyed household.
|
S/N |
MSW Type |
Description |
Bag Colour |
|
1 |
Paper |
All Papers |
White |
|
2 |
Plastics |
All Plastics |
Blue |
|
3 |
Food Waste/Organics |
All food and Yard Waste |
Black |
|
4 |
Metals |
All Metals |
Yellow |
|
5 |
Other waste |
Mixture |
Green |
Table 2: Descriptions of waste component categories.
3. Results and Analysis
The tables and charts in this section displayed the results of the analyzed MSW characterization of 4 major dump sites (Gosa, Karshi, Kubwa andDutse), and from households within AMAC and Bwari area council of Abuja. The statistical method used to describe the characterization of MSW components in these dumpsites are pie charts while histogram was used to describe the characterization of MSW generated in households of different districts of the study area.
|
Waste type |
Average mass (kg) (Dry) |
Waste mass (%) (Dry) |
Average mass (kg) (Wet) |
Waste mass (%) (Wet) |
|
|
Food Waste |
23.5 |
47 |
25.73 |
51.46 |
|
|
Glass/Ceramics |
1.05 |
2.1 |
1.75 |
3.5 |
|
|
Textile |
0.785 |
1.57 |
0.485 |
0.97 |
|
|
Metals |
1.7 |
3.4 |
1.92 |
3.84 |
|
|
Paper |
6.6 |
13.2 |
4.65 |
9.3 |
|
|
Plastics |
9.3 |
18.6 |
9.21 |
18.42 |
|
|
Rubber |
1.6 |
3.2 |
2.005 |
4.01 |
|
|
Others |
5.465 |
10.93 |
4.25 |
8.5 |
|
|
Total |
50 kg |
100 |
50 kg |
100 |
Table 3: Characterization of Gosa dumpsite (wet and dry season).
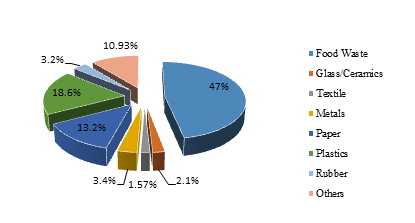
Figure 2: Gosa dumpsite composition (dry season).
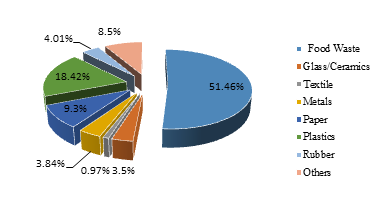
Figure 3: Gosa dumpsite composition (wet season).
In (Table 3) the mass and percentage composition of fresh mixed waste at the Gosa dumpsite for wet and dry seasons includes: (47% and 51.46%) food waste/organic; (18.6% and 18.42%) plastic; (13.2% and 9.30%) paper, (3.4% and 3.84%) metals, (2.1% and 3.5%) glass/ceramics; (1.57% and 0.97%) textile; (3.2% and 4.01%) rubber; (10.93% and 8.5%) other waste. Indeed, food waste /organic is the highest composition while textile was the lowest composition for Gosa dumpsite. The (Figures 2 and 3) display the statistics of the wet and dry season MSW of Gosa dumpsite.
|
Waste type |
Average mass (kg) (Dry) |
Waste mass (%) (Dry) |
Average mass (kg) (Wet) |
Waste mass (%) (Wet) |
|
|
Food Waste |
23.35 |
46.7 |
25.005 |
50.01 |
|
|
Glass/Ceramics |
1.55 |
3.1 |
1.57 |
3.14 |
|
|
Textile |
0.53 |
1.06 |
1.005 |
2.01 |
|
|
Metals |
1.895 |
3.79 |
1.87 |
3.74 |
|
|
Paper |
6.35 |
12.7 |
5.025 |
10.05 |
|
|
Plastics |
9.95 |
19.9 |
10.175 |
20.35 |
|
|
Rubber |
1.615 |
3.23 |
1.375 |
2.75 |
|
|
Others |
4.76 |
9.52 |
3.975 |
7.95 |
|
|
Total |
50 kg |
100 |
50 kg |
100 |
Table 4: Characterization of Karshi dumpsite (wet and dry season).
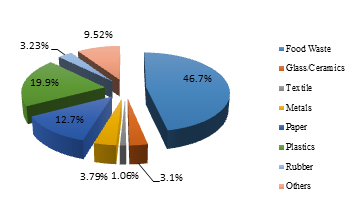
Figure 4: Karshi dumpsite composition (dry season).
The (Table 4) shows the composition of the fresh mixed waste at the Karshi dumpsite for the dry and wet season in mass and percentage. This includes: (46.7% and 50.01%) food waste /organic; (19.9% and 20.35%) plastic; (12.7% and 10.05%) paper; 3.79% and 3.74%) metals; (3.1% and 3.14%) glass/ceramics; (1.06% and 2.01%) textile; (3.23% and 2.75%) rubber; (9.52% and 7.95%) other waste. The (Figures 4 and 5) display the statistics of the wet and dry season MSW of Karshi dumpsite.
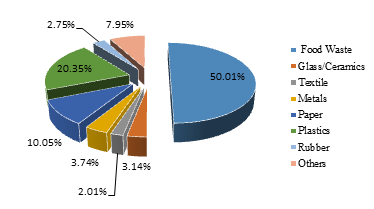
Figure 5: Karshi dumpsite composition (wet season).
The (Table 5) shows the mass and percentage composition of the mixed fresh waste at the Kubwa dumpsite for the dry and wet season. This includes: (47.30% an d50.5%) food waste (organic); (19.09% and 20.06) plastic; (14.00% and 10.20%) paper; (3.31% and 3.09%) metals; (2.79% and 3.25%) glass/ceramics; textile (1.80% and 2.11%); rubber (3.15% and 3.3%) and (8.56% and 7.5%) other waste. The (Figures 6 and 7) display the statistics of the wet and dry season MSW of Kubwa dumpsite.
|
Waste type |
Average mass (kg) (Dry) |
Waste mass (%) (Dry) |
Average mass (kg) (Wet) |
Waste mass (%) (Wet) |
|
Food Waste |
23.65 |
47.3 |
25.25 |
50.5 |
|
Glass/Ceramics |
1.395 |
2.79 |
1.625 |
3.25 |
|
Textile |
0.9 |
1.8 |
1.055 |
2.11 |
|
Metals |
1.655 |
3.31 |
1.545 |
3.09 |
|
Paper |
7 |
14 |
5.1 |
10.2 |
|
Plastics |
9.545 |
19.09 |
10.25 |
20.05 |
|
Rubber |
1.575 |
3.15 |
1.65 |
3.3 |
|
Others |
4.28 |
8.56 |
3.75 |
7.5 |
|
Total |
50 kg |
100 |
50 kg |
100 |
Table 5: Characterization of Kubwa dumpsite (wet and dry season).
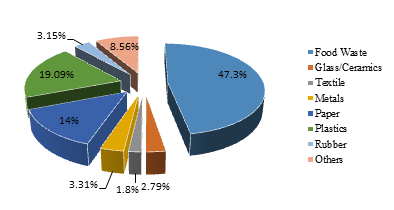
Figure 6: Kubwa dumpsite composition (dry season).
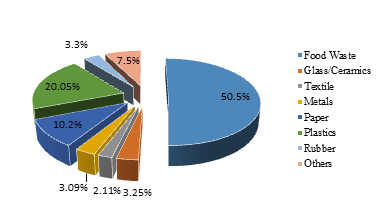
Figure 7: Kubwa dumpsite composition (wet season).
|
Waste type |
Average mass (kg) (Dry) |
Waste mass (%) (Dry) |
mass (kg) (Wet) |
Waste mass (%) |
|
(Wet) |
||||
|
Food Waste |
25.13 |
50.26 |
25.58 |
51.16 |
|
Glass/Ceramics |
1.09 |
2.18 |
1.445 |
2.89 |
|
Textile |
0.61 |
1.22 |
0.6 |
1.02 |
|
Metals |
1.325 |
2.65 |
1.675 |
3.35 |
|
Paper |
5.415 |
10.83 |
4.75 |
9.5 |
|
Plastics |
8.885 |
17.77 |
9.525 |
19.05 |
Table 6: Characterization of dutse dumpsite (wet and dry season).
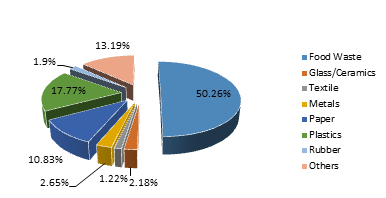
Figure 8: Dutse dumpsite composition (dry season).
The (Table 6) shows the mass and the percentage composition of the mixed fresh waste during dry and wet season at the Dutse dumpsite. This comprises of: (50.26% and 51.16%) food waste (organic); (17.77% and 19.05%) plastic; (10.83% and 9.5%) paper; (2.65% and 3.35%) metals; (2.18% and 2.89%) glass/ceramics; (1.22% and 1.02%) textile; rubber (1.9% and 2.83%) and (13.19% and 10.20%) other waste. The (Figures 8 and 9) display the statistics of the wet and dry season MSW of Dutse dumpsite.
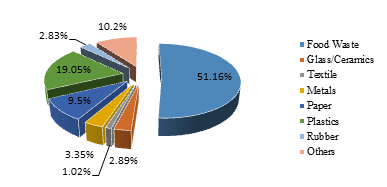
Figure 9: Dutse dumpsite composition (wet season).
In (Table 1), it was shown that out of 1479 households sampled in the study area, it was only 939 households that were successfully sampled. The patterns of distribution of the surveyed households show that it was carried out in all the districts of AMAC and Bwari area council.
Consequently, the (Table 7) shows the average composition of MSW of households in the listed districts of AMAC and Bwari area council of Abuja.
|
S/N |
Districts |
Plastic (kg) Ave |
Paper(kg) Ave |
Food/organic (kg) Ave |
Metal (kg) Ave |
Other waste (kg) Ave |
|
1 |
Asokoro |
1.09 |
0.885 |
2.185 |
0.74 |
1.21 |
|
2 |
Maitama |
0.995 |
0.91 |
2.2 |
0.635 |
1.3 |
|
3 |
Wuse |
1.05 |
0.955 |
2.51 |
0.81 |
1.15 |
|
4 |
Garki and Garki II |
1.125 |
0.89 |
2.57 |
0.775 |
1.05 |
|
5 |
Kubwa |
0.605 |
0.35 |
2.05 |
0.575 |
1.05 |
|
6 |
Dutse |
0.5 |
0.28 |
1.81 |
0.36 |
0.76 |
|
7 |
Gwarinpa |
0.68 |
0.47 |
1.92 |
0.64 |
0.95 |
|
8 |
Durumi |
0.615 |
0.445 |
2.02 |
0.65 |
0.905 |
|
9 |
Bwari |
0.48 |
0.25 |
1.75 |
0.275 |
0.665 |
|
10 |
Kado /Life Camp |
0.65 |
0.35 |
1.67 |
0.5 |
0.825 |
|
11 |
Karu / Nyanya |
0.65 |
0.5 |
2.05 |
0.4 |
0.94 |
|
12 |
Utako / Jabi |
0.505 |
0.44 |
1.245 |
0.375 |
0.635 |
|
13 |
Wuye |
0.56 |
0.4 |
1.65 |
0.35 |
0.65 |
|
14 |
Mpape |
0.59 |
0.37 |
2.06 |
0.3 |
0.87 |
|
15 |
Airport Road |
0.6 |
0.45 |
2.215 |
0.485 |
0.995 |
|
16 |
Mabushi / Jahi |
0.525 |
0.335 |
1.76 |
0.32 |
1.03 |
Table 7: Mean household composition of MSW in AMAC and Bwari area council districts, Abuja.
Furthermore, the (Table 8) also shows the percentage composition of MSW in AMAC and Bwari area council districts.
|
Districts |
Plastic Ave (%) |
Paper Ave (%) |
Food / Organic Ave (%) |
Metal Ave (%) |
Other waste Ave (%) |
||
|
Asokoro |
17.839 |
14.485 |
35.761 |
12.111 |
19.804 |
||
|
Maitama |
16.474 |
15.066 |
36.424 |
10.513 |
21.523 |
||
|
Wuse |
16.216 |
14.479 |
38.765 |
12.509 |
17.761 |
||
|
Garki |
17.551 |
13.855 |
40.094 |
12.09 |
16.381 |
||
|
Kubwa |
13.067 |
7.559 |
44.276 |
12.419 |
22.678 |
||
|
Dutse |
13.477 |
7.547 |
48.787 |
9.704 |
20.678 |
||
|
Gwarinpa |
14.592 |
10.086 |
41.202 |
13.747 |
20.386 |
||
|
Durumi |
13.269 |
9.6 |
43.582 |
14.025 |
19.525 |
||
|
Bwari |
14.035 |
7.309 |
51.169 |
8.041 |
19.444 |
||
|
Kado / Life Camp |
16.27 |
8.761 |
41.802 |
12.516 |
20.651 |
||
|
Karu / Nyanya |
14.317 |
11.013 |
45.154 |
8.811 |
20.704 |
||
|
Utako / Jabi |
15.781 |
13.75 |
38.906 |
11.719 |
19.844 |
||
|
Wuye |
15.512 |
11.08 |
45.706 |
9.695 |
18.006 |
||
|
Mpape |
14.081 |
8.831 |
49.165 |
7.159 |
20.764 |
||
|
Airport Road |
12.645 |
9.484 |
46.681 |
10.221 |
20.969 |
||
|
Mabushi / Jahi |
13.224 |
8.438 |
44.332 |
8.06 |
25.945 |
||
Table 8: Percentage composition of MSW in AMAC and Bwari area council districts.
4. Discussion of Results
In the study area, the predominant component in the MSW found in dumpsites is food waste/ organic wastes. According to (Figures 2- 9) it was shown that food waste/organic and plastics are the most dominant of the MSW composition at the aforementioned dumpsites during the wet and dry seasons. Also, (Figure 10) shows the mean composition of MSW in households for different districts in AMAC and Bwari area council have food waste/organic with the highest percentage in each of the district. This justifies the findings of Oyebola and Babatunde in 2008 [24] which was reported that the higher percentage of putrescibles (food waste/ organic) in developing countries may be attributed to the consumption of unprocessed food than processed food with high consumption in developed countries. Similarly, in 1999, the World Bank affirmed that all low and middle income countries have a high percentage of compostable organic matter in their urban waste stream, ranging from 40% to 85% of the total.
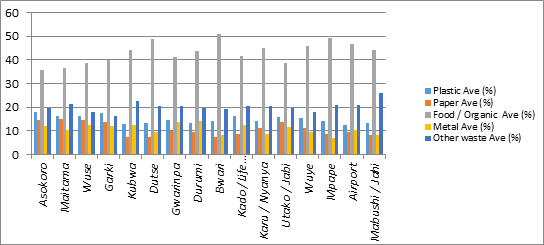
Figure 10: Percentage composition of household waste in AMAC and Bwari area council, Abuja.
4.1 Dumpsites analysis
The determination of the mean composition of MSW was based on the collection and manual sorting of a number of samples of MSW in 4 major dump sites for a duration of 7 days for each of the seasons (dry/wet). In addition, it was observed that there were variations in the quantity of the composition of MSW at dump site locations (Gosa; Kubwa; Karshi and Dutse). This is as a result of the level of income of the districts with which their waste streams are being disposed at particular dumpsites. For instance, Gosa dumpsite is being fed with the MSW from the high income districts of AMAC (Asokoro; Maitama; Wuse; Garki; Jabi/Utako; Life Camp; Gwarinpa among others). Food waste / organic constitutes the largest component by weight. It was deduced that food waste / organic increases in quantity at dumpsites during the wet season compared to the dry season. The (Tables 2, 3, 4 and 5) shows the dry / wet season average percentage estimation of food / organic in dumpsites of AMAC and Bwari Area Council, for instance: Gosa (47% / 51%); Karshi (46% / 50.01%); Kubwa (47.3% / 50.50%) and Dutse (50.26% / 51.16%). This increase is attributed to the consumption of freshly harvested crops and farm produce during the raining season. Furthermore, there is usually an increase in farm yard waste, garden waste, and excess grasses/weeds removed from the environs of homes, schools, etc. Again, it was observed that there was a decrease in the quantity of paper during the wet seasons as compared to the dry seasons. The (Tables 3, 4, 5 and 6) show that in the dry / wet seasons, the average percentage composition of paper in the dumpsites is: Gosa (13.2% / 9.30%); Karshi (12.70% / 10.05%); Kubwa (14.00% / 10.20%) and Dutse (10.83% / 9.5%). The characteristic of the quantity of other waste in terms of seasonal variation is similar to that of paper. In other words, the (Tables 3, 4, 5 and 6) shows that there was a decrease in the quantity of other waste in all 4 dumpsites during the wet seasons as compared to the dry seasons and the average percentage composition is: Gosa (10.93% / 8.50%); Karshi (9.52% / 7.95%); Kubwa (8.56% / 7.5%) and Dutse (13.19% / 10.20%). However, there was an increase in the quantity of plastics during the wet seasons as compared to the dry seasons in all the dumpsites expect Gosa and the average percentage composition is: Gosa (18.6% / 18.42%); Karshi (19.9% / 20.35%); Kubwa (19.09% / 20.05%) and Dutse (17.77% / 19.05%). Again, in Gosa (3.4% / 3.84%) and Dutse (2.65% / 3.35%), the quantity of metals in the dry season is less compared to the wet season however; it is the opposite in Karshi (3.79% / 3.74%) and Kubwa (3.31% / 3.09%). With respect to textile and rubber wastes, the irregularity in terms of quantity varies in all the four dumpsites. The trend of the other wastes was deduced to be higher % during the dry season compared to the wet seasons. For instance: Gosa (10.93% / 8.5%); Karshi (9.52% / 8.5%); Kubwa (8.56% / 7.5%); and Dutse (13.19% / 10.20%) respectively.
4.2 Household analysis
The study shows that the attribute of MSW generated in households is associated with the level of income and the size of the household. A total of 939 households was successfully sampled, and are spatially distributed in 16 districts of AMAC andBwari area council see (Table 1). This analysis shows that the level of income and the status of the economy have a direct impact on the composition of MSW in the study area. The level of income on the other hand, determines the variation in the composition of the MSW in individual households and hence, the percentage composition of MSW for each district in the study area shows that Asokoro and Maitama for instance, have the lowest % value of food waste/organic waste at 35.761% and36.424%, while Bwari, Mpape and Dutse have the highest % values of food waste/organic at 51.169%, 49.165% and 48.787% respectively. Again, paper waste is generated in higher % in high income districts as a result of packaging from new products and services, and lower % in low income districts (see Figure 10). Plastic waste is the most very co mmonly available in all the districts of AMAC and Bwari area council. This is as a result of plastic such as post-consumer PET bottles and waste plastic bags/boxes for packaging of items is excess in high income districts, while waste plastic bags (nylon) for packaging and sachet water packs are more in low income districts. Metal waste is highly demanded by scavengers for their livelihood hence, the scavengers visit homes to sort out metals from waste bins or sometimes purchase metal waste from the house owners.
5. Conclusion and Recommendations
The level of income has been identified as a factor that influences the composition of MSW generation in the study area. The percentage composition of MSW for districts like Asokoro, Maitama, Wuse, and Utako/Jabi (high income districts) has the lowest % value of (food waste / organic waste) while in low income districts like Bwari, Mpape and Dutse have the highest % values. However, paper waste has higher % in high income district in comparison to low income districts as the inhabitants tend to invest more packaged products and services. Unlike plastic wastes, that are generated in high quantity in both high income and low income districts. Metal wastes vary from one household to another because of the scavengers. This study has shown that the waste stream from the study area has huge material resources that can be recovered. Therefore, through composting of food waste/organic waste; paper, plastics and metal recycling; and converting waste to energy for homes and other infrastructures, a sustainable MSW management in AMAC and Bwari area council can be achieved. All the authorities and stakeholders should work in synergy with the implementation of policies to achieve an effective and sustainable Waste Management (ISWM) program. Furthermore, waste segregation should be encouraged in the society to promote recycling and resource recovery. Lastly, the use of both the formal and informal private sectors in MSW management is vital to provide a wider range of efficient collection of MSW, hence it should be encouraged.
Acknowledgement
We wish to express our sincere appreciation to the Petroleum Technology Development Fund (PTDF) for their funding support with the award number (PTDF/ED/PHD/AOM/1303/17). Also, our appreciation goes to the Head of Director of the Environmental science andTechnology program, Faculty of Sciences, University of Porto, Portugal for his continuous support and encouragement. We appreciate the support of the Abuja Environmental Protection Board (AEPB) and WISMA Environmental services Limited for granting us access to the major disposal sites.
References
- ASTM D 5231-92 (Reapproved 2016): Standard Test Methods for Determination of the Composition of Unprocessed Municipal Waste; ASTM International (2016): 6.
- UNU-WIDER. Solid wastes, poverty and the environment in developing country cities: challenges and opportunities. Working Paper No. 2010/23, United Nations University, World Institute for Development Economics Research, Helsinki (2010).
- Nnaji CC. Status of municipal solid waste generation and disposal in Nigeria. Management of Environmental Quality: An International Journal 26 (2015): 53-71.
- World Bank. “What a waste”: a global review of solid waste management, urban development series knowledge papers (2012).
- Beede DN, Bloom DE. Economics of the generation and management of Municipal Solid Waste (MSW). NBER Working Papers 5116. National Bureau of Economic Research, Inc (1995).
- Al-Salem SM, Lettieri P, Baeyens J. Recycling and recovery routes of plastic solid waste (PSW): a review; Waste Management 29 (2009): 2625-2643.
- James A. Riegel’s Handbook of Industrial Chemistry. CBS Publishers and Distributor, India (1997).
- World Bank. What a Waste: Solid Waste Management in Asia. The World Bank Report. Washington, D.C. USA (1999).
- World Health Organization. Solid Waste Management in South- East Asia. WHO House, New Delhi, India (1984).
- Bichi M, Amatobi D. Characterization of household solid wastes generated in suburban areas of Kano in Northern Nigeria. American Journal of Research Co mmunication 1 (2013): 165-171.
- Brunner PH, Ernst WR. Alternative Methods for the Analysis of Municipal Solid Waste. Waste Management andResearch 4 (1986): 147-160.
- Martin JH, Collins AR, Diener RG. A Sampling Protocol for Composting, Recycling, and Re-use of Municipal Solid Waste. Journal of Air and Waste Management Association 45 (1995): 864-870.
- AbdAlqader A, Hammad J. Municipal Solid Waste Composition Determination Supporting the Integrated Solid Waste Management Gaza Strip , International Journal of Environment Science and Development 3 (2012): 172-176.
- Tchobanoglous G, Theisen H, Vigil S. Integrated Solid Waste Management: Engineering Principle and Management Issue. International Ed. McGram - Hill Book Co. Singapore (1993).
- Oumarou M, Dauda M, Abdulrahim A, et al. Characterization and generation of municipal solid waste in north central Nigeria. International Journal of Modern Engineering Research 2 (2012): 3669-3672.
- Alamgir M, Donald CMc, Roehi KE, etal. Integrated management and safe disposal of MSW in least developed Asian countries-A feasibility study, Waste Safe. Khulna University of Engineering and Technology, Asia Pro Eco-Progra mme of the European Commission (2005).
- National Population Commission Nigeria (2012).
- Ola Balogun. The Federal Capital Territory of Nigeria; A Geography of its development (Ibadan University Press Publishing house: University of Ibadan, 2001) (2001).
- Achi A, Adeofun E, Gbadebo A, et al. “An assessment of solid waste management practices in Abeokuta, south west Nigeria”, Journal of Biology and Chemical Research 29 (2012): 177-188.
- Egun NK. The waste to wealth concept: waste market in Delta State, Nigeria. Greener Journal of Social Science 2 (2012): 206-212.
- Cochran W. Survey Sampling. John Wiley (1977): 2332.
- Ahmed S. Methods in Sample surveys. Department School of Hygiene and Public health, John Hopkins University (2009).
- Meizah K, Obiri-Danso K, Kadar Z, et al. Municipal Solid Waste Characterization and Quantification as a measure towards effective Waste Management in Ghana. Waste Management 46 (2005): 15-27.
- Oyebola O, Babatunde A. Characterization of domestic and market solid wastes at source in Lagos metropolis, Lagos, Nigeria. African Journal of Environmental Science and Technology 3 (2008): 430-437.


 Impact Factor: * 3.6
 Acceptance Rate: 76.49%
  Time to first decision: 10.4 days
  Time from article received to acceptance: 2-3 weeks