Evaluation of Glycemic Index of Some Cameroonian Local Meals: A Contribution to the Management of Metabolic Syndrome
Nyangono Biyegue Christine Fernande1,2,*, Ntentie Françoise Raïssa2,3, Dakam William2,4, Magne Naoussi Diana1, Ngobe Ewanke Elisabeth Martine1, Nga Mang Glwadys Nadege1, Guimatio Teugou Michelle1, Salamatou1, Dang A Bep Eunice1, Ngondi Judith Laure2
1University of Douala, Higher Teacher’s Training School for Technical Education, PO Box 1872 Douala, Cameroon
2University of Yaounde I, Laboratory of Nutrition and Nutritional Biochemistry, PO Box 812 Yaounde, Cameroon
3University of Maroua, Higher Teachers’ Training College, PO Box 55 Maroua, Cameroon
4University of Douala, Faculty of medicine and pharmaceutical sciences, PO Box 2701 Douala, Cameroon
*Corresponding author: Nyangono Biyegue Christine Fernande, University of Douala, Higher Teacher’s Training School for Technical Education. PO Box 1872 Douala, Cameroon.
Received: 01 July 2021; Accepted: 11 July 2021; Published: 30 June 2022
Article Information
Citation: Nyangono Biyegue Christine Fernande, Ntentie Françoise Raïssa, Dakam William, Magne Naoussi Diana, Ngobe Ewanke Elisabeth Martine, Nga Mang Glwadys Nadege, Guimatio Teugou Michelle, Salamatou, Dang A Bep Eunice, Ngondi Judith Laure. Evaluation of Glycemic Index of Some Cameroonian Local Meals: A Contribution of Management of Metabolic Syndrome. Fortune Journal of Health Sciences 5 (2022): 407-425
View / Download Pdf Share at FacebookAbstract
Aim of the study: This study aimed at proposing a strategy of the management of metabolic syndrome through the determination of the glycemic index of some Cameroonian local meals.
Methodology: The study was carried out amongsix traditional communities living in Yaounde (Cameroon): Mbo, Bamougoum, Eton, Bafia, Haussa, and Dschang communities. This study was carried out in two different stages: firstly, an ethno - food questionnaire was administered to 30 natives of each community to investigate the most and the less consumed traditional dishes. Secondly, 41meals were selected based on their frequency of consumption and cooked. One hundredgrams of each selected meals were used to assess their glycemic index on volunteers (4 volunteers per meal) who were freely consented.
Results: Out of the 41 meals selected, 35 of them had a glycemic index (GI) lower than 55. All meals of Haussa, Eton and Dschang communities had GI<55.Meals with the lowest GI were:HLFCo (GI: 1.21) and YCFSFCo (GI 1.51) for Bafia community; YSSC (GI : 3.03) for Dschang community; KM (GI: 4.17) for Mbo community; FLBMFR (GI: 4.17) and DOBMFCo (GI: 2.08) for Haussa community; BSOFCo (GI= 8.33) and YSEPC (GI: 4.17) for Bamougoum community; and YSSCaT (GI: 16.67) for Eton community.
Conclusion: Every community is rich in low GI meals whose consumption should be encouraged in the management of metabolic syndrome and its components.
Keywords
<p>glycemic index, metabolic syndrome, local meals</p>
Article Details
1. Introduction
Metabolic syndrome (MetS) is the cluster of risk factors that increases the risk of cardiovascular disease and type 2 diabetes [1]. These factors include dysglycemia, highblood pressure, elevated triglyceride levels, low level of high-density lipoproteincholesterol (HDL-C) and obesity [2]. Its origin is still little understood but genetic, environmental factors, insulin resistance and pro-inflammatory state playa keyrole [3].In Cameroon, the statistics are equally alarming. Thereis an increase in the prevalence from 1.5% to 13% between 2006 and 2008 [4, 5]. Foodstuffs rich in fatty and/or sugary foods, combined with low energy outgo, constitute one of the main aetiologies of the MetS. According to [6], the dietary changes thus observed are characterized in cities by an increase in the consumption of fat (especially animals), refined sugar, processed foods, salt and by a concomitant reduction in the consumption of dietary fiber, proteins from plants, with a gradual shift from traditional meals to modern lifestyle. Despite the resurgence of MetS in Cameroon, studies determining the associations between food and MetS are still limited due to a lack of data available on the eating habits of Cameroonians and data on the composition of the traditional dishes consumed[7] has shown that ignorance in the food composition is a barrier to adopting a healthy lifestyle.
Nutritional therapy is the adapted solution to fight against nutrition-related chronic diseases [8] and American Diabetes Association recommends low glycemic index (GI) foods as opposed to high GI which seems to be a risk factor for obesity and cardiovascular diseases (CVD) [9]. These low GI foods are mainly composed of non-nutritive bioactive components (tannins, phytic acid, and protease inhibitors) and bioactive complex carbohydrate which is involved in the prevention and management of MetS [10]. A meal is a complex mixture of compounds that makes difficult the determination of the GI. However, the GI of some mixed food has been established [11]. In Cameroon, till now, GIs of some traditional dishes eaten in the far North Region are known [12]. But, much remains to be done because Cameroon is an Africa in miniature, which implies a multitude of ethnic groups, and therefore a significant high dietary diversity of the country. In order to encourage the local resilience promoted by the WHO, the identification of local traditional dishes specific to each socio-cultural community and which exhibit nutritional values favourable to the care of people suffering from metabolic disorders is essential. The present work focused on the determination of the GI of several traditional meals consumed in 6 socio-cultural communities in Cameroon. This study is part of the research on strategies for the management of metabolic disorders, risk factors for cardiovascular diseases.
2. Methodology
The study carried out in 2015 was conducted in two phases: first an ethno-food survey which permitted to identify and select some local meals, and secondly by the determination of the glycemic index of these selected meals.
2.1 Ethno – Food Survey
The study was carried out in Yaounde, political capital of Cameroon, a metropolitan city with a wide ethnic diversity. The 6 halogen traditional communities randomly chosen among the most representative were: Mbo (Originated from the Littoral Region), Eton and Bafia (Originated from the Centre Region), Haussa (Originated from the Northern Regions), Bamougoum and Dschang (Originated from the West Region). Briefly, the ethno - food questionnaires were administered to 30 families’ native randomly chosen from each of those 6 communities. The different traditional dishes for each community were recorded as well as their frequency of consumption. After this step, an appointment was made with the different families to attend the cooking demonstrations of some traditional meals selected. The cooking methods were carefully followed up as well as the different cooking steps, the duration and the ingredients used. The aim was to document and learn how to prepare these traditional meals according to traditional technics with the aim of reproducing them in the laboratory for further works.2.2 Evaluation of glycemic index (GI) of local dishes2.2.1 Selection of traditional meals and preparationAfter the ethno-food survey, 41 dishes were selected based on their high-frequency of consumption as follows: Bamougoum community (07 local meals), Eton community (06 local meals), Mbo community (07 local meals), Haoussa community (09 local meals), Dschang community (06 local meals) and Bafia community (06 local meals).The meals selected after ethno-food survey have been prepared in the kitchen of the Department of Home Economics, Higher Teacher’s Training School for Technical Education, University of Douala, using the ingredients were purchased from the most popular markets of Douala city (Bepanda, Makepe-Missoke, and Central market). The 41 meals were cooking according to the cooking procedure learned by surveyor during the household cooking demonstrations. Meals were cooked the day of glycemic index experimentations and served as portions of 200g.2.2.2 Ethical ConsiderationsThis study is a part of project entitled “Nutrition and Health study” approved the National Ethics Committee N°2014/08/488/EC/CNERSH. It was conducted in strict compliance with the physical, moral and psychological integrity of all participants. Prior to participant enrolment, they were informed about the purpose of the study and data collection procedures and all volunteer participants signed an informed consent form.2.2.3 Screening and selection of the volunteersA call for participation has been launched via posters and radio announcements for the recruitment of volunteers. The objectives, protocol, and the importance of the study were explained to the volunteers who had responded positively to the announcement. They fist underwent screening for obesity, diabetes, and hypertension. Were excluded to the study; volunteers with digestive problems (chronic diarrhea, constipation, flatulence), on medication, allergies, and malnutrition, those with pancreatic dysfunction, and chronic patients (overweight or obesity, hyperglycemia, or diabetes, hypertension).Those who agreed to participate in the study signed a consent form and a total of 210 young people of both sexes aged between 18 and 30 years were enrolled to this study. They had been instructed to attend the experiment day in a fasting condition (about10- 12 hours).2.2.4 Glycemia Description of test groupsThe test meals were studied in comparison with white bread (200g) used as the reference food. The 210 volunteers were divided into 42 groups of 5each (41 test groups and one control group). The reference group ate 200g of white bread. For the test groups, 200g of cooked local dishes were consumed (Table 1). Test meals were served with drinking water.2.2.5 Ingestion of Test Meals and EvaluationGlycemic response to the various meals was measured using an experimental design described by FAO [13]. After 10 - 12 hours of fasting, blood glucose levels of all subjects were measured and over times (30, 60, and 120 minutes) after food intake. To perform this, the fingertips of the subjects were disinfected using ethanol (90%). With a sterile needle, a gentle pressure was applied to the pricked finger and a drop of blood was collected for the determination of blood glucose level the glucose oxidase method [14] using a glucometer (One touch Ultra 2)2.2.6 Determination of the Glycemic Index (GI) of the MealsThe blood glucose means at different times in the experiment were computed and used to plot the glycemic response curves over time (Glycemia = f (t)) for each meal. From a baseline, the incremental surface area below the curve was computed as well as the GI of each meal using the following formular: [13].GI (%) = [(incremental area of testedmeal)/(incremental area of reference food)]*1002.3 Statistical Analysis
The data were entered into an Excel worksheet 2010 and transferred to IBM Statistical Package for Social Sciences (SPSS) software version 22.0 for Windows for statistical analysis. The results were expressed as means ± standard deviation (SD). The Student t test and the analysis of variance (ANOVA) followed by a Post Hoc test (Least Significance Difference) were used to compare the means between continuous variables. The significance threshold was set at p<0.05.
3. Results
3.1Description of the selected traditional meals and their frequency of consumption
Tables 1 present the lists of selected local meals of different communities and their consumption rate.
Each meal is presented with its local name, the type of carbohydrate staples, the physical form of the meal, their attributed code derived from it name, their full ingredients list and the scientific name of the ingredient.
3.2 Effect of different traditional meals on blood glucose level response
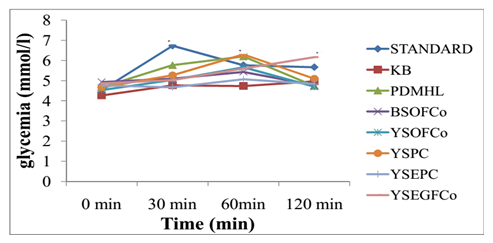
The Figure 1 shows the evolution of blood glucose level response at different times after the consumption of local meals from the Bamougoum community. At 30 min after food ingestion, there was a significantly increased of glycemia with the reference food (white bread) compared to other local meals. The glycemic peak of the YSEGFCo is observed at 120 min while that of the others were observed at 60 min.
Table1: List of selected local meals per community
*= P< 0,05: significant difference at different times based ont Test ofStudent; Standard: white bread; KB: kneaded banana; PDMHL: peeled dried maize and huckleberry leaves, BSOFCo: black soup, okra and fufu corn; YSOFCo: yellow sauce, okra and fufu corn; YSPC: yellow sauce and ppounded cocoyam; YSEPC: yellow sauce, eggplants and pounded cocoyam; YSEGFCo: yellow sauce, elephant grass and fufu corn.
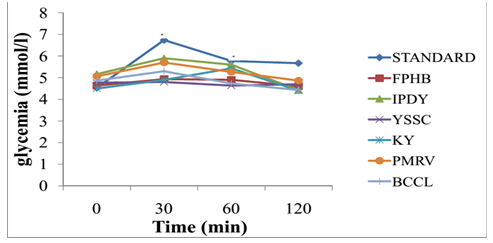
For Dschang community traditional meals, It appears that all these meals presented lower peaks over time compared to the reference food (white bread). The KY induced a peak after 60 min while others were at 30 min (figure 2).
*= P< 0,05: significant difference at different times based ont Test ofStudent; Standard: white bread; FPHB: Fresh peanut with huckleberry; IPDY: Crush irish potatoes with dried yams, YSSC: Yellow soup with sissongo leaves; KY: Kneaded yams; PMRV: Pounded macabo with Roasted vegetables; BCCL: Banana cake with chilli leaves.
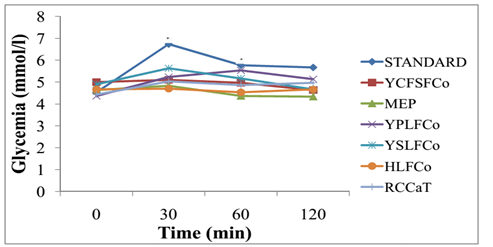
As concerning traditional meals eaten by the Bafia community the Figure 3 below shows that meals like MEP, YSLFCo, and RCCaT presented peaks at 30 min although lower than the standard. The YPLFCo was the only one with glycemic peak observed at 60 min. Furthermore, the lowest glycemic peaks were observed with YCFSFCo and HLFCo at 30 min.
*= P< 0,05:significant difference at different times based ont Test ofStudent; Standard: white bread; YCFSFCo: Young cocoa fruits sauce and fufu corn; MEP: Melon with eggplants, YPLFCo: Young palm leaves and fufu corn; YSLFCo: Young sissongo leaves and fufu corn; HLFCo: Huckleberry leaves and fufu corn,RCCaT: Roasted caterpillar and cassava tubers.
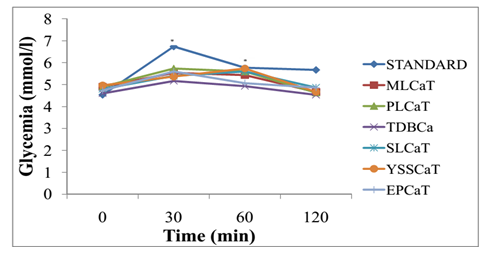
For meals from the Eton community, results presented on Figure 4 revealed that as for other meals, their peak remained lower than standard over time. Those with delay peak were SLCaT and YSSCaT at 60 min.
*= P<0.05:significant difference at different times based ont Test ofStudent; Standard: white bread; MLCaT: Melon leaves and cassava tubers; PLCaT: Paï leaves and cassava tubers, TDBCa: Termites dishes and bounded cassava; SLCaT:Saka’a leaves and cassava tubers; YSSCaT: Young sissongo sprouts and cassava tubers; EPCaT: Eggplants puree and cassava tubers.
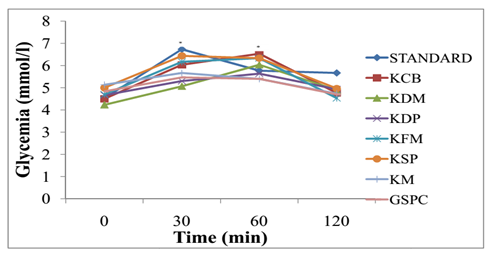
Figure 5 shows the variation of blood glucose response after the consumption of local meals from the Mbo community. It’s clearly appears that among the 7 meals studied, 4 of them presented a peaks at 60 min although which was higher than that of the standard.
*= P< 0,05:significant difference at different times based ont Test ofStudent; Standard: white bread; KCB: Koki cowpea beans; KDM: Koki dried maize, KDP: Koki dried plantain; KFM: Koki fresh maize; KSP: Koki sweet potato; KM: Koki macabo; GSPC: Green soup and pounded cocoyam.
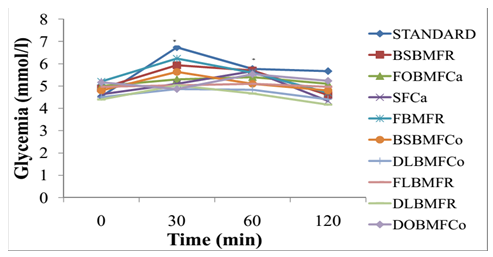
As concerning the Haussa community, among the nine meals studied. The glycemic peaks of the DOBMFCo and SFCa were noted at 60 min while that of the others were at 30 min. The FLBMFR glycemic peak was the weakest one (Figure 6).
*= P< 0,05: significant difference at different times based ont Test ofStudent; Standard: white bread; BSBMFR: baobab sauce/beef meat – fufu rice; FOBMFCa: fresh okra/beef meat – fufu cassava, SFCa: soye/beef meat – fufu cassava; FBMFR: Folere/beef meat- fufu rice; BSBMFCo:baobab sauce/beefmeat – fufu corn; DLBMFCo: dried lalo/beefmeat – fufu corn; FLBMFR: fresh lalo/beef meat- fufu rice;.DLBMFR: dried lalo/beef meat – fufu rice; DOBMFCo: Dried okra/beef meat – fufu corn.
3.3 Glycemic index of different traditional meals
Table 2 presents the glycemic index of all the selected meals by community. The GI was compared to the standard (white bread). Concerning Bamougoum community meals, the PDMHL (GI= 62.50) and the YSPC (GI=58.33) were both meals with the highest glycemic index (GI>55) meanwhile among those with the lower glycemic index (GI<55), BSOFCo (GI=8.33) and YSEPC (GI=4.17) exhibited the lowest values. For Dschang community, the results from table 2 show that all the local meals had low glycemic index (GI<55) with the YSSC having the lowest glycemic index (GI=3.03).As concerning meals eaten by Bafia community. It appears that only YPLFCo has high glycemic index (GI>55) while among those with low glycemic index, YCFSFCo and HLFCo exhibited the lowest glycemic index (GI=1.21 and GI=1.51 respectively) (p<0.05).For Eton community, all the meals had a significantly low glycemic index (GI<55) compared to the standard and the lowest one was YSSCaT (GI=16.67). For Mbo community, it appears from the table 2 that three meals had high glycemic index (GI>55) namely: KCB, KDM and KDP. Among the four with low glycemic index, KM presented the significantly lowest glycemic index (GI=4.17). Among the 9 selected meals eaten by Haussa community, it is interesting to note that all of them had a low glycemic index (IG<55) and those with the lowest glycemic index were the FLBMFR (GI=4.17) and the DOBMFCo (GI=2.08).
Table 2: Incremental areas and glycemic index of local meals from
|
Name of local meals |
Coded meal |
Incremental area |
Glycemic index (GI) (%) |
Classification |
|
Bamougoum community |
||||
|
White bread (Reference) |
WB |
0.24±0.03a |
100.0a |
|
|
Kneaded banana (kentiè tam) |
KB |
0.11±0.14b |
45.83±6.02b |
GI<55 |
|
Peeled dried maize and huckleberry leaves (tchou’ou guessan djap) |
PDMHL |
0.15±0.01c |
62.50±2.72c |
GI>55 |
|
Black sauce and okra (messan na’a tchè’e) |
BSOFCo |
0.02±0.03d |
8.33±10.93d |
GI<55 |
|
Yellow sauceand okra (messan na’a tchu regan) |
YSOFCo |
0.11±0.01e |
45.83±4.26b |
GI<55 |
|
Yellow sauce (pé na’a tchu) |
YSPC |
0.14±0.02f |
58.33±8.30c |
GI>55 |
|
Yellow sauce and eggplants (na’a tchu chèchouo) |
YSEPC |
0.01±0.01g |
4.17±3.67d |
GI<55 |
|
Yellow sauce and elephant grass (messan na’a tchu sisson) |
YSEGFCo |
0.08±0.03h |
33.33±12.25e |
GI<55 |
|
Dschang community |
||||
|
Fresh peanut with huckleberry (Mebou’oh) |
FPHB |
0.06±0.03b |
18.18±7.37b |
GI<55 |
|
Crush irish potatoes with dried yams (Nguin) |
IPDY |
0.12±0.03c |
36.36±5.19c |
GI<55 |
|
Yellow soup with sissongo leaves (Apa’ah chouchoun) |
YSSC |
0.01±0.02d |
3.03±5.96d |
GI<55 |
|
Kneaded yams |
KY |
0.07±0.04e |
21.21±4.13b |
GI<55 |
|
Pounded macabo with Roasted vegetables (Kwa – ndzap) |
PMRV |
0.11±0.01f |
33.33±1.47c |
GI<55 |
|
Banana cake with chilli leaves (Menda’ah) |
BCCL |
0.09±0.03g |
27.27±6.42e |
GI<55 |
|
Bafia community |
||||
|
Young cocoa fruits sauce (kakaea daeu kepen ki bazi) |
YCFCFCo |
0.004±0.04b |
1.21±4.86b |
GI<55 |
|
Melon with eggplants (mereing daeu teréé) |
MEP |
0.04±0.005c |
12.12±0.79c |
GI<55 |
|
Young palm leaves (ndoong daeu kepen ki bazi) |
YPLFCo |
0.17±0.01d |
51.51±6.86d |
GI>55 |
|
Young sissongo leaves (mechongchong daeu kepen ki bazi) |
YSLFCo |
0.13±0.005d |
39.39±1.99e |
GI<55 |
|
Huckleberry leaves(Bitosso daeu kepen ki bazi) |
HLFCo |
0.005±0.05b |
1.51±4.86b |
GI<55 |
|
Roasted caterpillar (gouou daeu kidjane ki beudoun) |
RCCaT |
0.08±0.07c |
24.24±10.62f |
GI<55 |
|
Eton community |
||||
|
Melon leaves(Midjen) |
MLCaT |
0.05±0.003b |
20.83±10.39b |
GI<55 |
|
Paï leaves(Paï) |
PLCaT |
0.07±0.01b |
29.17±2.71b |
GI<55 |
|
Termites dishes (n-kongi – sil) |
TDBCa |
0.05±0.01b |
20.83±3.62b |
GI<55 |
|
Saka’a leaves |
SLCaT |
0.08±0.02b |
33.33±8.40b |
GI<55 |
|
Young sissongo sprouts (Misson) |
YSSCaT |
0.04±0.04b |
16.67±15.37b |
GI<55 |
|
Eggplants puree (Ipirik zon) |
EPCaT |
0.08±0.01b |
33.33±3.49b |
GI<55 |
|
Mbo community |
||||
|
Koki cowpea beans (Ekoki keun) |
KCB |
0.20±0.01a |
83.33±5.61a |
GI>55 |
|
Koki dried maize (Ekoki mbè) |
KDM |
0.20±0.03a |
83.33±12.79a |
GI>55 |
|
Koki dried plantain (Ekoki mpouh) |
KDP |
0.11±0.01b |
45.83±4.68b |
GI<55 |
|
Koki fresh maize (Ekoki etoumbè) |
KFM |
0.15±0.02c |
62.5±6.73c |
GI>55 |
|
Koki sweet potato (Ekoki alang) |
KSP |
0.13±0.02c |
54.17±7.07c |
GI<55 |
|
Koki macabo (Ekoki alang) |
KM |
0.01±0.02d |
4.17±7.66d |
GI<55 |
|
Green soup (Essouba) |
GSPC |
0.06±0.01e |
25.00±2.45e |
GI<55 |
|
Haussa community |
||||
|
Baobab soup -beef meat/fufu rice (touhon chincapa/kouka) |
BSBMFR |
0.08±0.004b |
33.33±1.57b |
GI<55 |
|
Fresh okra – beef meat/fufu cassava (touhon gourka/coubewa) |
FOBMFCa |
0.04±0.03c |
16.67±11.24c |
GI<55 |
|
Soye/fufu cassava (touhon gourka soye) |
SFCa |
0.06±0.01b |
25.0±5.65b |
GI<55 |
|
Folere – beef meat/fufu rice (touhon chincapa/yakouwa) |
FBMFR |
0.04±0.02c |
16.67±9.01c |
GI<55 |
|
Baobab soup – beef meat/fufu corn (touhon mascara/kouka) |
BSBMFCo |
0.06±0.02b |
25.0±6.45b |
GI<55 |
|
Dried lalo – beef meat/fufu corn (touhon mascara/lalo boucheche) |
DLBMFCo |
0.04±0.01b |
16.67±2.55c |
GI<55 |
|
Fresh lalo – beef meat/fufu rice (Touhon chincapa/lalo) |
FLBMFR |
0.01±0.01d |
4.17±5.49d |
GI<55 |
|
Dried lalo – beef meat/Fufu rice (touhon chincapa/lalo boucheche) |
DLBMFR |
0.04±0.01c |
16.67±3.95c |
GI<55 |
|
Dried okra – beef meat (touhon mascara/coubewa boucheche) |
DOBMFCo |
0.005±0.003d |
2.08±1.38d |
GI<55 |
For each column, values followed by different superscripts are significantly different (p < 0.05) based on ANOVA and Post hoc tests. (Least Significant Difference).
4. Discussion
The present study is a contribution to the research of the means of prevention and management of the metabolic syndrome, its individual components and the related consequences. This was done through the identification of local foods specific to each community with appreciable nutritional values especially in a context where WHO promotes local resilience as main strategies to fight against malnutrition. Overall, out of the 41 meals tested in this study, 8 had GIs <10; 7 had GIs between10-20; 19 had GIs between 20-50 and 7 had GIs >50 (Table 2).This gives a better appreciation of the quality of traditional meals commonly consumed in Cameroonian socio-cultural communities.
4.1 Glycemic index of local mealsThe glycemic index is a measure providing details on the biological response following the ingestion of carbohydrates. Regarding the composition of a meal (quality and quantity of various ingredients), the glycemic index can vary considerably [15]. Foods rich in proteins, lipids, water, carbohydrates, mineral salts and fibres would influence the kinetics of the glycemic index. Thus, the more protein a meal has, the more its glycemic index tends to drop. The nutrient composition of Cameroonlocal meals affect GI because it is influenced by ethnic belongings and dietary habits which define the nature and doses of ingredients and difference in preparation methods [16].
In this study, the table 2 show that there are significant difference (p<0.05) between the GI of the eaten meals (1.21 – 83.33): Bamougoum community (4.17 – 62.50), Dschang community (3.03 – 36.36), Bafia community (1.21 – 51.51), Eton community (16.67 – 33.33), Mbo community (4.17 – 83.33) and Haussa community (4.17 – 33.33). The high value of GI observed with KDM (83.33) and KCB (83.33) could be due to its high digestible carbohydrates content in KDM (Koki dried maize) and culinary process in KCB (Koki cowpea beans). In fact cowpea beans are rich in proteins, dietary fibres and antinutrients which would reduce glycemic response [17, 18].
Many reasons could explain the lower GI values (GI<20) observed in several eaten meals of our study: Mbo community (GI KM: 4.17), Haussa community (GI FOBMFCa: 16.67; GI FBMFR: 16.67; GI DLBMFCo: 16.67; GI FLBMFR: 4.17; GI DLBMFR: 16.67; GI DOBMFCo: 2.08), Eton community (GI YSSCaT: 16.67), Bafia community (GI HLFCo:1.51; GI YCFSFCo: 1.21), Dschang community (GI FPHB: 18.18) and Bamougoum community (GI BSOFCo: 8.33; GI YSEPC: 4.17). These reasons could be:
- The ingredients used for cooking and the cooking method [19].
- Hydrolysis of starch into amylose and amylopectin. In fact, foods rich in amylose have a lower GI than those rich in amylopectin[15].
- The presence of dietary fiber in most of our dishes. The latter would cause a systematic slowing of gastric emptying due to their gelling effect [15].
- The richness in proteins and lipids of the meals. Both lipids and proteins during the ingestion of a meal tend to delay contact between carbohydrate polymers and enzymes and then between monomers and the mucosa [15]. Proteins have an insulinotropic effect [20].
Studies [16] have shown that many of these local meals were rich in lipids. This could be due to the use of palm nuts pulp in the place of palm oil (common among the Central region of Cameroon). However, the three Northern Region of the country do not use palm oil or palm nut pulps but refined oils in all sauces and vegetables dishes .In west region, populations consumed dishes based on spices or groundnut with cereals and tubers like complements.
More local meals are also rich in fiber. High-fiber foods have been shown to have low glycemic indexes and are slowly digested during digestion in vitro [18]. In clinical studies or in the shorter term, it is the soluble fibres (viscous fermentable) which allow beneficial metabolic effects on the glycemic responses to insulin and lipid [21].However, according to several epidemiological studies, insoluble fibers (viscous and slowly fermentable) are particularly associated with a reduce risk of type 2 diabetes and cardiovascular diseases [22].
The beneficial physiological effects of dietary fibers would be attributed to their physicochemical properties (viscosity, solubility, formation of gels in aqueous solution) which increased gastric emptying and reduced absorption of nutrients, their degree of fermentation, their probiotic property, their potential to improving the absorption of certain minerals, modulating certain markers of inflammation, and with satietogenic effect [23].Note also that the eggplants used in the preparation of some of meals are very rich in phenolic compounds and flavonoids as revealed by a study[24]. This study show that the polyphenols and flavonoids contained in eggplant inhibited alpha-amylase and pancreatic alpha-glucosidase in a dose-dependent manner. The starch present in large quantities in the local dishes rich in eggplants of may not be hydrolyzed by alpha - pancreatic amylase and therefore the entry in the blood circulation will be delay which resulted in a low glycemic index of these dishes. In addition, most of the dishes, particularly those from the West Region (Dschang and Bamougoum communities) are rich in spices. According to the somes studies [25, 26], these spices are rich in flavonoids and have preventive effects on obesity, type 2 diabetes and metabolic syndrome. Note also that most of the dishes studied are made up of many ingredient. Therefore, all the elements of the dish mix in the food bowl and delay digestion by minimizing the different glycemic indexes.
The selected carbohydrate staples also have their effect on the GI of our different meals. In our study, the carbohydrate staples used were among others fufu rice, fufu cassava, fufu corn, pounded cocoyam, sweet potatoes, Macabo, plantain, cassava tubers, bundle cassava, Melon, pounded macabo, yams, unripe banana, irish potatoes.In general, the processing method, especially boiling may affect the glycemic index of the food. During the boiling process, wet heatcauses free sugar to leach into the liquid medium, and then more leaching of glucose monomers occurs during amylase amylopectin degradation. However, the loss of the readily digestible sugar to leaching had no direct implication on the amount of carbohydrate used to calculate the glycemic index, testing was calculated on the final cooked product. However, the degree of starch conversion may differ across cultivars [27]. The different carbohydrate contents of the foods may explain the differences in glycemic index and it was found that similar levels of carbohydrate content do not have similar glycemic index. Therefore, carbohydrate has stronger resistance to digestive enzymes and its digestion and absorption in the intestine is slow and incomplete. Under this kind of condition, low blood glucose is seen [27].
5. Conclusion
Results from this study revealed that in each community, there are meals with low glycemic indexwhich could therefore be recommended to peoplewith specific nutritional requirements such as diabetics, obeses or subjects with metabolic syndrome. Thus, the management of these diseases will be done without the need of modifying the traditional eating habits of everyone. This is in line with the WHO recommendations on local community resilience.
Acknowledgements
Wear every grateful to the people of Bamoug-oum, Dschang,Mbo, Eton,Haussa and Bafia communities living in Yaounde for their cooperation in this study, especially the housewives who accepted to provide us many information’s about the different local meals consumed.
References
- Mottillo S, Filion KB, Genest J, JosephL, PiloteL, Poirier P, RinfretS. The metabolic syndrome and cardiovascular risk a systematic review and meta-analysis.JAmColl Cardiol 56(2010): 111-32.
- Schmidt C and Bergström GML. The metabolic syndrome predicts cardiovascular events:Results of a 13-Year Follow-Up in Initially Healthy 58-Year-Old Men. Met Syndr and Related Dis 10 (2012).
- Cameron AJ,Magliano DJ,ZimmetPZ,WelbornT andShawJE. “The Metabolic Syndrome in Australia: Prevalence Using Four Definitions,” Diabetes Res. Clin. Pract 77(2007): 471-478.
- FezeuL, Balkau B, Kengne AP, et al. Metabolic Syndrome in a Sub-Saharan African Setting: Central Obesity May Be the Key Determinant. Atherosclerosis 193(2007): 70-76.
- Mandob ED, Ngondi JL, Fomekong GID and Agbor G. Prediction and prevalence of metabolic syndrome in overweight and obese subjects in Cameroun. Int J Biomed and pharmaceutical Sci 2(2008).
- Eisenman JC. Secular trends in variables associated with the metabolic syndrome of North American children and adolescents: a review and synthesis. Am J Hum Biol 15(2003): 786 – 94.
- Kiawi EE. Unwin knowledge, attitudes, and behaviour relating to diabtes and its main risks factors among urban residents in Cameroon: a qualitative survey. Cameroon: ethnic diseases 16(2006): 503 – 509.
- Lichtenstein AL. Diet and lifestyle recommandations Revision 2006. USA: A scientific statement from the American Heart Association Nutrition Commettee. Circulation 114(2006): 82 – 96.
- American Diabetes Association. An 18 randomized trial of low glycemic index diet and weight change in Brazilian women. The Am J Clin Nutr 86 (2008): 707 – 713.
- Singh J and Basu PS. Non-Nutritive Bioactive Compounds in Pulses and Their Impact on Human Health: An Overview. Food and Nutrition Sciences 3 (2012): 1664-1672.
- Atkinson FS, Foster-Powell K and Brand-Miller JC. International Tables of Glycemic Index and Glycemic Load Values: 2008. Diabetes Care 31(2008): 2281-2283.
- Koubala BB, Kansci G, Fifen ANP,Ngoufack AI, Dadjeu YCM. Effect of the various processed food of the Far North Cameroon on the glycemic index. Food and Nutrition Sciences(2014): 779 – 786.
- Carbohydrates in Human Nutrition: Report of a Joint FAO/WHO Expert Consultation. FAO Food and Nutrition Paper-66, Rome(1997): 14-18.
- Trinder P. Determination of Glucose in Blood Using Glucose Oxidase with an Alternative Oxygen Acceptor. Annals of Clin Biochem 6(1969): 24-27.
- Pucheu NG. Contribution à l’étude de l’index glycémique et ses applications chez les carnivores domestiques. Thèse de Doctorat. Toulouse. Ecole Nationale Veterinaire 70(2005).
- Nyangono BCF, Ntentie R, Bouelet NIS, Magne ND, Ngobe EEM, et al,.Macronutrient Values of Local Meals of Some Cameroonian Traditional Communities Living in Yaounde. J Food Nutr Sci 9 (2021): 57-63.
- Thompson LU, Button CL and Jenkins DJA. Phytic Acid and Calcium Affect the in vitro Rate of Navy Bean Starch Digestion and Blood Glucose Response in Humans.Am JClin Nutr 46(1987): 467-473.
- Jenkins DJA, Jenkins AL, Kendall CWC et al. Dietary Fiber, Carbohydrate Metabolism and Chronic Disease. In: McCleary, B.V. and Prosky, L., Eds. Advance Dietary Fiber Technology, Blackwell Science Ltd., London(2001): 162-167.
- Englyst NK et al, Rapidly available glucose in foods: an in vitro measurement that reflects the Glycemic responses. AM J Clin Nutr 69 (1999): 448 – 454.
- Nilsson ME. Glycemia and insulinemia in healthy subjects after lactose equivalent meals of milk and other foods proteins: the role of plasma amino acids and incretins. Am J Clin Nutr 80 (2004): 1246 – 1253.
- Brown et al. Cholesterol lowering effects of dietary fiber; a meta – analysis. Am J Clin Nutr 69 (1999): 30 – 42.
- Munter et al. Whole grain, bran and germ intake and risk of type 2 diabetes: a prospective cohort study and systematic review. Plos medicine (2007).
- Weickert MO and Feiffer AFH. Metabolic effects of dietary fiber consumption and prevention of diabetes.J Nutr 128 (2008): 439 – 442.
- Nwanna EE, Ibukun EO, Ganiyu O. Inhibitory effects of methanolic extracts of two eggplants species of South – Western Nigeria on starch hydrolysing enzymes linked to type – 2 diabetes. Academic Journals 7 (2013): 1575 – 1584.
- Kuate D, Etoundi BC, Manan WA, Muda BW, Oben J. Anti – inflammatory, anthropometric and lipomodulatory effects of diglomera (aqueous extract of Dichrostachys glomerata) in obese patients with metabolic syndrome. Functionnal foods in health and diseases 3 (2013): 416 – 427.
- Kuate D, Kengne Mavemsi AP, Biapa Nya CP, Azantsa Kingue BG, et al,. Tetrapleura treptatera spices attenuates high – carbohydrate, high fat does induced obese and type 2 diabetic rats with metabolic syndrome features. Lipids health Sis 14(2015):50
- Ogbuji CA and David-Chukwu NP. Glycemic indices of different cassava food products. Eur J Basic and Applied Sci3 (2016).
- Lee SE, Han K, Kang YM et al., “Trends in the prevalence of metabolic syndrome and its components in South Korea: Findings from the Korean National Health Insurance Service Database (2009–2013),”PLoS ONE 13 (2018).


 Impact Factor: * 6.2
 Acceptance Rate: 76.33%
  Time to first decision: 10.4 days
  Time from article received to acceptance: 2-3 weeks