CoVID -19 - A Global Exploratory Study on the Incidence Rates
Hesham Magd1*, Henry Karyamsetty2
1Associate Dean for Quality Assurance and Accreditation, Faculty Head of Business and Economics, Modern College of Business and Science, Muscat, Oman
2Assistant Professor, Transportation, Logistics and Safety Management Department, Faculty of Business and Economics, Modern College of Business and Science, Muscat, Oman
*Corresponding Author: Hesham Magd., Ph.D., Associate Dean for Quality Assurance and Accreditation, Faculty Head of Business and Economics, Modern College of Business and Science, Muscat, Oman
Received: 14 January 2021; Accepted: 25 January 2021; Published: 01 February 2021
Article Information
Citation: Hesham Magd, Henry Karyamsetty. CoVID -19 - A Global Exploratory Study on the Incidence Rates. Journal of Environmental Science and Public Health 5 (2021): 32-49.
View / Download Pdf Share at FacebookAbstract
The world has been impacted severely by CoVID-19 pandemic and the spread of the CoVID 19 is not under control as confirmed cases are still been reported globally. Based on the literature review where it was suggested that the incidence rates of CoVID-19 are related to environmental factors existing locally and therefore it’s important to examine the diversified environmental and meteorological factors that are contributing to the disease transmission and infection rates that subsequently facilitates better management of future outbreaks and crisis. The current study explores and investigates the significance of population dynamics, dew point and altitudinal factors on incidence rates of CoVID -19 across different geographical regions. Data from 129 countries are collected pertaining to the parameters of the study and each parameter is examined to know the degree of association with the confirmed cases The study results show that the city fraction rate combining with latitude ranges substantially can predict to varying levels the incidence rate of SARS-CoV-2. Additionally, the study suggested also countries having city fraction rate in specific range has affinity to show increase in daily confirmed cases.
Keywords
<p>CoVID 19; Environmental factors; Meteorological factors; Dew point; Altitudinal factors; Global analysis</p>
Article Details
1. Introduction
Currently global CoVID -19 cases are continuing to increase at a steady pace and has reached around 80 million confirmed cases with 1.7 million deaths (JHU, 2020 [1]). The incidence of SARS-CoV-2 is very much existing with optimal number of positive cases in many countries as the virus is not eliminated from the environment. CoVID-19 pandemic after prevailing for over a year now has joined alongside with notably pandemics of the past closely resembling with other prominent global out breaks (who.int) [2] . During this time, the pandemic continues to effect and cause disruption to global business, and normal human life as the impact on economy is widely researched and documented. At the time of preparing the article, certified and approved vaccines for immunization was already released and some countries have started to administer the vaccine to immunize the population from the effect of SARS-CoV-2. However, until the virus is totally eliminated from the environment and a total resistance is developed in the hosts the incidence rates of CoVID-19 can be felt in vulnerable communities and regions more favorable for resurgence (Heywood and Macintyre 2020 [3]) under the governance of ambient climatic factors.
Climatic factors are studied from the viewpoint of their influence on incidence rates of various diseases such as middle east respiratory syndrome caused by novel corona virus MERS-CoV (Ahmed and Altamimi 2020 [4]; Killerby et al., 2020 [5]). Studies by Cacho et al., (2020) [6] reported that climatic factors effect on the incidence rates and severity of CoVID-19. In addition, researchers Chien and Chen (2020) [7] in US cities and Guo et al, (2021) [8] in 190 countries focused on meteorological parameters such as temperature, relative humidity and precipitation to comprehend the influence on CoVID-19 disease incidence.
Literature shows various factors were examined for predicting the incidence rates of the disease including biological and environmental parameters (Chakrabarti et al., 2020) [9]. It’s essential to highlight that the majority of the empirical studies have considered environmental parameters such as temperature, humidity, precipitation (Qi et al., 2020 [10]; Babu et al., 2020 [11]; Lin et al., 2020; Pani et al., 2020 [12]; Poirier et al., 2020 [13]; Runkle et al., 2020 [14]; Wu et al., 2020 [15]) and meteorological parameters such as wind speed, particulate matter, solar radiation etc. (Ahmadi et al., 2020 [16]; Ma et al., 2020 [17]; Rosario et al., 2020 [18]; Zhu et al., 2020 [19]; Domingo et al., 2020 [20]; Liu et al., 2020 [21]) influencing the disease incidence and transmission in various geographical regions, while limited studies are conducted on investigating population dynamics measuring city fraction rates (Ahmadi et al., 2020 [16]; Jahangiri et al., 2020 [22]; Sahin 2020 [23]; Sarkodie et al., 2020 [24]; Pirouz et al., 2020 [25]) and meteorological parameters such as dew point and latitudinal variations in the disease incidence and transmission phenomena of CoVID -19.
The incidence rates of CoVID-19 are very intricately related to environmental factors existing locally and are important to study and examine the diversified environmental and meteorological factors further to explore the significance of those factors in the disease transmission and infection rates that subsequently facilitates better management of future outbreaks and crisis. Therefore, this study intends to explore and investigate the significance of specific factors that were considered less effective which are population dynamics, dew point and altitudinal factors on incidence rates of CoVID -19 across different geographical regions.
2. Methods
2.1 Data and parameters
For the study, the following information cases per million population, city fraction rates, latitude and dew point temperature parameters were collected from April to July and August month for year 2020 and is examined to see the disease growth scenario and incidence rates in three data group countries (Table 1). For the analysis, dew point temperature data was collected for cities from January to December 2020 while the city fraction rates, latitude and cases per million population were collected for different countries as mentioned in Table 1. The city fraction rate is derived from calculating the city population to the country population. Country and city population data was collected from worldpopulationreviw.com and data.un.org and cases per million population, latitude and dew point temperature from ourwoldindata.org, covid19.who.int. climatedataguide.ucar.edu, latlong.net.
2.2 Statistical analysis
To achieve the objectives of the study, descriptive analysis for the data variables cases per million population, city fraction rate and latitude were performed covering the three data group countries using NCSS 2020 data analysis statistical software. Linear and multivariate regression analysis between the data variables to evaluate the predictors among the parameters was performed comprising the three data group countries using NCSS 2020 statistical software and correlation analysis between data variables to determine the degree and strength of association existing between the parameters of the three data group countries was run using Spearman correlation analysis with SPSS ver. 26 statistical software. Scatter diagram graphs are prepared using Micro Soft Excel (office 365) to denote the relationship between the study variables considering the three data group countries.
3. Results
To understand the diverse possible factors that are influencing the spread of CoVID-19, the parameters considered for study are dew point, city fraction, number of cases per million population and latitude. These parameters are examined to evaluate their significance in impacting the disease incidence. Data from 129 countries are collected pertaining to the parameters of the study and each parameter is examined to know the degree of association with the confirmed cases. To determine the range of factors that possibly effect infection spread the study is investigated through the following research questions to find answers.
- Is city fraction shows any influence and relation to number of confirmed cases.
- Does number of cases show any significant improvement with latitude and know the incidence rates and trend with specific latitudinal ranges.
- The combined effect of latitude and city fraction on number of cases reported period.
- Does specific city fraction rate show any significant relation to increase in cases.
- The role of dew point in determining the disease incidence rates.
3.1 Descriptive analysis
Data related to city fraction, cases per million population and latitude are examined for data group -3 countries (Table 1).
|
Data Group |
Regions |
Parameter studied |
Countries/cities |
|
I |
Asia, Europe, Oceania, Africa, North America |
a) Dew point temperature |
Wuhan, Tokyo, Qom, Lombardia, Madrid, Rome, Paris, New York, Melbourne, Wellington, Johannesburg, Muscat, Hanoi and Bangkok. |
|
II |
Asia, Europe, Africa, Oceania, South America, Central America |
a) Latitude b) City fraction c) Cases per million population |
Romania, Algeria, Kenya, Poland, Madagascar, Serbia, Guatemala, Indonesia, Germany, Hungary, Bulgaria, India, Senegal, Cuba, Norway, Netherlands, Jamaica, Ukraine, Sweden, Philippines, Denmark, Finland, Ireland, Ecuador, Egypt, Switzerland, Thailand, France, Spain, Italy, Belgium, New Zealand, Russia, Iran, Malaysia, China, Greece, United Kingdom, Bolivia, Libya, Portugal, Venezuela, South Africa, Turkey, Paraguay, Uruguay, Colombia, Argentina, Mexico, Djibouti, Saudi Arabia, Australia, Japan. |
|
III |
Asia, Africa, Europe, North America, South America, Central America, Caribbean, Oceania |
a) City fraction b) Cases per million population |
Sri Lanka Ethiopia, Nepal, Niger, Uganda, Burundi, Chad, Rwanda, Romania, Algeria, Malawi, Uzbekistan, Kenya, Poland, Madagascar, Cambodia, Mali, Mozambique, Afghanistan, United States, Benin, Zimbabwe, Guinea, Sierra Leone, Tanzania, Sudan, Kyrgyzstan, Serbia, Nicaragua, Guatemala, Croatia, Indonesia, El Salvador, Germany, Burkina Faso, Bangladesh, Hungary, Central African Republic, Bulgaria, India, Senegal, Vietnam, Cuba, Norway, Lithuania,, Netherlands, Jamaica, Ukraine, Austria, Zambia, Togo, Pakistan, Yemen, Sweden, Philippines, Azerbaijan, Denmark, Finland, Honduras, Nigeria, Ghana, Haiti, Kazakhstan, Somalia, Ireland, Tunisia, Georgia, Eritrea, Belarus, Costa Rica, Ecuador, Mauritania, Egypt, Switzerland, Liberia, Morocco, Oman, Guinea Bissau, Cameroon, Thailand, France, Spain, Italy, Belgium, New Zealand, Russia, Latvia, Iran, Lebanon, Malaysia, Armenia, Dominican Republic, Bahrain, China, Gabon, Greece, United Kingdom, Jordan, Trinidad And Tobago, Angola, Peru, Iraq, Bolivia, Libya, Portugal, Panama, Venezuela, South Africa, Syria, Chile, Brazil, Turkey, Paraguay, Qatar, Mongolia, Uruguay, Colombia, Argentina, Mexico, Canada, Djibouti, Saudi Arabia, South Korea, Australia, United Arab Emirates, Japan, Kuwait, Israel, Singapore. |
Table 1: Countries from different geographical regions considered for the study.
City fraction denotes the percentage of city population to the total country population, where a high city fraction number implies more density of population in the country and vice versa. For this analysis, city fraction rate is categorized into 7 ranges with lowest fraction at 0.03 and highest of 1.01. The highest mean cases per million population were observed in the city fraction range of 0.40 to 0.49 and the lowest mean cases per million population was in the city fraction range of 0.03 to 0.09, conversely the lowest cases per million population recorded during the month of August is in the countries that exhibit city fraction between 0.10 to 0.19 with 7.71 cases per million and the highest cases per million population was in the countries that has city fraction between 0.40 to 0.49. The data analysis of city fraction to the cases per million population in the 129 countries illustrate that with increase in city fraction from 0.03 to 0.49 there is an increase in cases per million population substantially but decreases less gradually beyond 0.50 to 0.59 (Table 3), thus implying and suggesting that the higher the city fraction rate the cases per million population tends to remain at minimum (Figure 1).
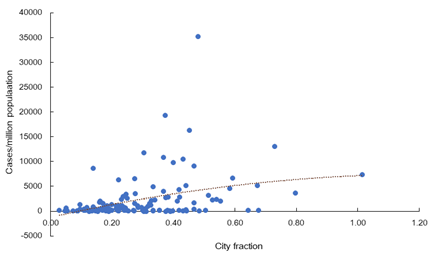
Figure 1: Trend line plot between city fraction rate and cases per million population data group 3 countries.
The incidence rate and trend of disease spread with specific city fraction range and latitudinal changes were examined for data group 2 countries to ascertain whether there is any effect of these two variables on the cases per million population (Table 1). In the above analysis, the cases per million population were studied with reference to latitudinal changes of each country at similar city fraction range. Further, latitude degree of each country is also considered as independent factor to examine the effect on cases reported per million population. In countries of the data group having city fraction range of 0.1 (Figure 2), the analysis shows that with increasing latitude the cases per million population showed gradually rise and a less similar trend is noticed at city fraction range of 0.2 between latitude and cases per million population (Figure 3), while at city fraction range of 0.3, with increase in latitude, cases per million populations showed prominent raise from the previous levels (Figure 4) and beyond the city fraction rate (0.4 to 0.6) with increasing latitude there is no significant increase observed on the cases per million population in the data group (Figure 5).
The analysis has not sufficiently proved that city fraction is associated with latitude in the data group studied though the countries at higher latitudes have city fraction in 0.2 to 0.4 range while high city fraction range is observed at medium latitudes (Figure 6). Further, from the analysis the study cannot categorically prove that cases per million population are high at specific latitudinal degrees but sufficiently supports the assumptions that as latitude increases, the cases per million population also tend to show a gradual increase from the observations on 53 countries in the data group (Figure 7).
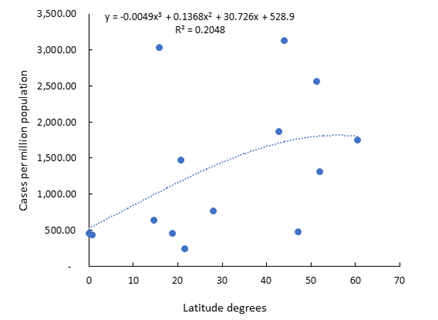
Figure 2: Association of cases reported with latitude at CF 0.1.
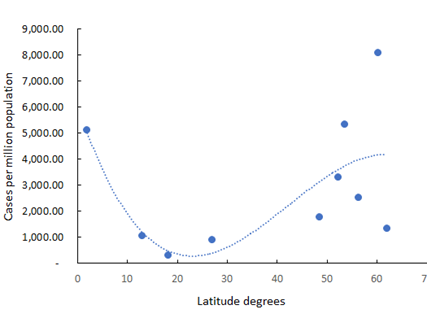
Figure 3: Association of cases reported with latitude at CF 0.2.
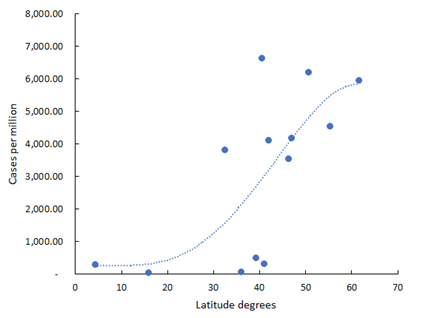
Figure 4: Association of cases reported with latitude at CF 0.3.
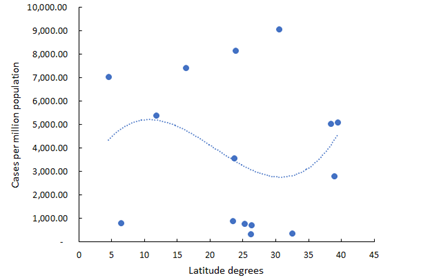
Figure 5: Association of cases reported with latitude above CF 0.4 to 0.6.
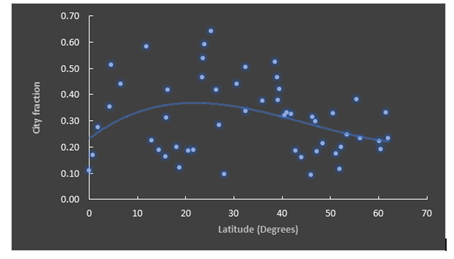
Figure 6: City fraction rate and latitude change trend in data group 2 countries.
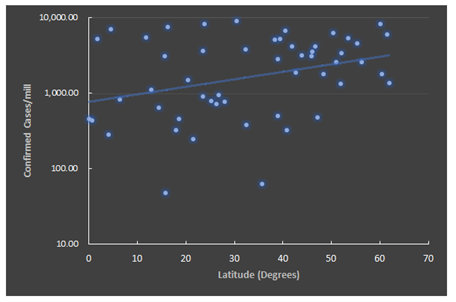
Figure 7: Confirmed reported cases with latitude change trend in data group 2 countries.
Dew point is determined as an essential parameter examined in the analysis to test for influence on the cases per million population specifically in data group 1 cities (Table 2). Observations were noted from January to December 2020 for all the cities and the dew point ranged from minimum of -5°C to 25°C maximum with a highest average of 23.4°C and minimum average of 2.5°C. From the observations taken during the year, the peak levels within the cities was in August with 15.1 °C and lowest in January with 5.2°C.
|
City |
(N) |
Mean |
Standard deviation |
Standard error |
Variance |
Minimum |
Maximum |
|
Wuhan |
12 |
12.33 |
9.10 |
2.62 |
82.96 |
0 |
25 |
|
Tokyo |
9.33 |
10.0 |
2.89 |
100.7 |
-5 |
23 |
|
|
Qom |
2.58 |
3.70 |
1.06 |
13.71 |
-3 |
7 |
|
|
Lombardia |
7.5 |
6.52 |
1.88 |
42.63 |
-1 |
716 |
|
|
Madrid |
5.33 |
3.55 |
1.02 |
12.60 |
1 |
10 |
|
|
Rome |
10.66 |
5.34 |
1.54 |
28.60 |
3 |
18 |
|
|
Paris |
6.91 |
4.31 |
1.24 |
18.62 |
1 |
13 |
|
|
NYC |
8.08 |
6.62 |
1.91 |
43.90 |
-3 |
18 |
|
|
Melbourne |
8.50 |
2.61 |
0.75 |
6.81 |
5 |
13 |
|
|
Wellington |
9.33 |
2.38 |
068 |
5.69 |
6 |
13 |
|
|
Johannesburg |
6.66 |
5.83 |
1.68 |
34.06 |
-2 |
14 |
|
|
Muscat |
18.08 |
4.42 |
1.27 |
19.53 |
12 |
24 |
|
|
Hanoi |
19.58 |
4.90 |
1.41 |
24.08 |
11 |
25 |
|
|
Bangkok |
23.41 |
1.83 |
0.52 |
3.35 |
20 |
25 |
Table 2: Descriptive statistics showing dew point temperature of cities examined from January to December for data group 1.
Examining the disease incidence trend in each of those cities during the observational period indicates cases per million shows responsive variations with dew point in majority of situations. Between March and April there is 6°C swing in dew point temperature observed in New York and as dew point temperature increased beyond May, the confirmed cases subsided showing a drop in the incidence rate flattening the curve till September later confirmed cases began to raise with drop in dew point temperature from October to December.
In Rome, the peak cases per million were during November when the dew point temperatures dropped, and the confirmed cases curve flattened from April to September corresponding to the increasing dew point temperature (average 15.3°C) during those months. In Madrid city the confirmed cased begin to decline with increasing dew point temperature from April and the incidence rate curve remained flat from May to October correspondingly with the increase in dew point temperature during this period. The three cities, Muscat, Hanoi and Bangkok have higher dew point temperatures compared to the other cities in the group and the cases per million population curve remained flat throughout the year in Hanoi and Bangkok city opposing to the trend observed in Muscat where the incidence rate curve shows fluctuating pattern despite the increasing dew point temperature.
Cities with similar dew point temperatures observed in the first quarter of year, Wellington and Melbourne city has shown flattened curve from January to December, unlike the incidence trend observed in other cities, the cases per million population do not increase with decrease in dew point temperature. However, in Johannesburg the curve increased from mid of April to reaching peak on July 19th coinciding with the lowest dew point temperature of -2°C recorded in the city and later the incidence rate declines flattening the curve from September as the dew point temperature increases gradually. Wuhan, Tokyo, Qom, and Paris having similar dew point temperatures from (January to April) of the year has an average of 2.2°C. In Wuhan the cases per million were high from January to Mid-March because of the low dew point temperature (average 5°C) then from end of March the curve remained flat until December as dew point temperature tend to increase correspondingly from April.
In cities such as Tokyo and Qom, the cases per million population curve is flat from March to December where the figures in both cities are very close, but the average dew point temperature in Qom is lower (2.5°C) not showing any drastic swings in dew point between two successive months than Tokyo which recorded an average dew point temperature of 9.3°C had an average swing of 4.8°C in dew point between two successive months. In Paris there was a raise in cases per million observed from end of August up to beginning of November where the peak cases were reported on November 1st and 8th and this trend invariably reciprocates to the increase in the dew point temperature from May to September and further as the dew point fall downs, the cases per million population curve flattens.
3.2 Statistical analysis
Statistical tests to examine the strength and degree of association between the parameters are performed to shed some lights to the questions postulated in the study. Linear and multivariate regression analysis was performed to predict the significant increase in cases based on the city fraction rates of data group 3 countries and estimate how much of the variation in the dependent variable is affected by the independent variable in the study (Table 3).
|
Descriptive data |
Variables |
|
|
City fraction |
Cases/million population |
|
|
Mean |
0.29 |
3380.68 |
|
Standard deviation |
0.16 |
5482.68 |
|
Minimum |
0.03 |
7.71 |
|
Maximum |
1.01 |
38906.61 |
|
Variance |
0.027 |
3.00 |
|
Standard error |
0.014 |
482.72 |
|
Range |
0.98 |
38898.9 |
Table 3: Descriptive statistical data of variables in data group 3 countries.
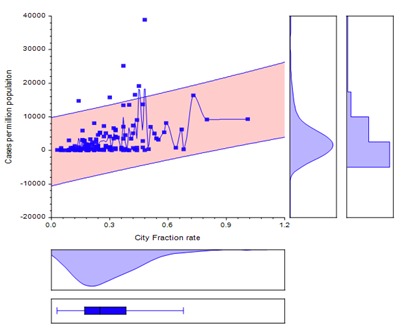
Figure 8: Cases per million population and city fraction rate association in data group countries.
Spearman correlation analysis between the cases reported per million population in the data group countries show moderate and substantial significant relationship with the city fraction, rs = .439, p < .01), N= 129, signifying that with increase in the factor city fraction, there is considerable rise in cases reported per million population. Still to know the effect of change on each variable simple linear regression analysis was performed to predict the cases per million population in the data from the city fraction rate. The analysis reveals that city fraction rate from the data group countries significantly predict the cases reported per million population, F (1,127) = 22.943, p = .000, R2 = .153 which suggests that 15.3% of variance in cases reported is accounted from the city fraction factor. In addition, the variable factor city fraction (β = .391, t = 4.790, p = .000) significantly predicts the cases reported per million population in the data group countries at α .05 level (Figure 8).
Correlation analysis was conducted to examine the degree of association between latitude and city faction for data group 2 countries (Table 4). The results show that both the variables have weak negative association r= -.186, p = .182, N= 53 demonstrating no significant association among city fraction and latitude and suggests that countries with higher latitudes have lower city fraction rate and higher city fraction rates are observed in lower latitude countries.
|
Descriptive data |
Variables |
||
|
City fraction |
Latitude |
Cases/million population |
|
|
Mean |
0.31 |
32.71 |
2817.39 |
|
Standard deviation |
0.14 |
17.65 |
2519.07 |
|
Minimum |
0.09 |
0.02 |
47.71 |
|
Maximum |
0.68 |
61.92 |
9074.29 |
|
Variance |
0.022 |
311.53 |
6345737 |
|
Standard error |
0.020 |
2.42 |
346.02 |
|
Range |
0.59 |
61.9 |
9026.58 |
Table 4: Descriptive statistical data of variables in data group 2 countries.
Regression analysis results shows very negligible percent (3.5%) of variance in city fraction is attributed to latitude F (1,51) = 1.832, p= .182, R2= .035 and the predictor latitude (β = -.186, t = -1.354, P = .182) does not significant predict the city fraction factor in countries studied in the data group at α .05 level (Figure 9).
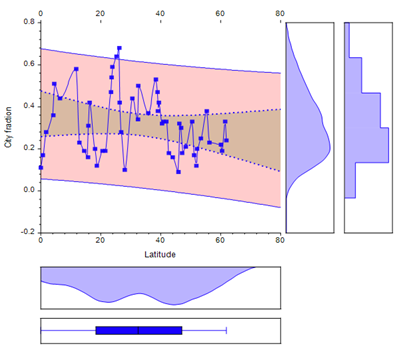
Figure 9: Linear regression plot demonstrating association between latitude and city fraction.
Multiple regression analysis was preformed to predict whether the cases reported per million population in the data group countries are affected by latitude and city fraction rate. The hypothesis proposes that the cases reported per million population can be determined through the two factors city fraction rate and latitudinal values. Regression analysis results show 14.8 % of the variance in cases is affected by both the variables F (2,50) = 4.347, p = .018, (ρ < .05), R2 = .148. Individual predictors reveal that latitude (β = .274, t = 2.060, p < .045) and city fraction (β = .326, t = 2.456, p= .018) significantly predict the positive cases of CoVID at α .05 level (Figure 10).
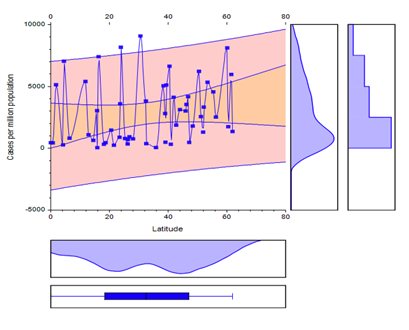
Figure 10: Linear regression plot between latitude and cases reported per million population.
4. Discussion
Currently the pandemic has caused loss to global economy disrupting almost all business operations and human lives. The incidence rate, transmission and disease phenomena of CoVID -19 pandemic is extensively studied globally to understand the prominent factors influencing the infection caused by SARS-CoV-2. The current study was initiated to investigate and explore the effect of minor known environmental factors and their influence/impact on the incidence rates of CoVID -19 pandemic that are not extensively examined to forecast the disease growth scenario. While this study is unique in terms of considering the role of city fraction rate, latitude values and dew point temperature in assessing their extent of influence on disease incidence, in view of limited studies targeting these parameters. Data on cases per million population, city fraction rate and latitude are examined for three data group countries to examine the independent and combined intervention of parameters in determining the incidence rates.
The study findings and analysis reveal city fraction rate and latitude substantially represent the incidence rates of CoVID -19 however, the influence is more prominently felt in countries that have city fraction rate of 0.4 with increase in latitude the cases tend to raise, as the effect of city fraction combined with latitude changes are not studied previously indicating the possibility of disease incidence rate and raise in confirmed cases to some extent by these two factors. Further, the analysis reveals that latitudinal changes show significant effect on the disease incidence rate with inconsistent association between them implying that the impact of CoVID -19 pandemic is exposed to the changes in latitude and city fraction as these parameters can be investigated to predict the futuristic disease incidence scenario.
Dew point temperature is another significant factor observed to show certain degree of association with disease incidence from the analysis in concurrence with (Pani et al., 2020 [12]; Sahin 2020 [23]; Sarkodie at al., 2020 [24]), while dew point temperature in higher latitudinal regions falling in temperate regions would favor the growth and transmission of the virus strain more easily than lower latitudinal regions that has higher annual dew point temperature though regions with dew point extremes cannot fully predict the incidence rate accurately, but might explain the behavior of respiratory disease causing viruses (Sajadi et al., 2020 [26]).
Latitude is a central factor among the variables used, that determines the solar intensity and dew point temperature of each region governing the fluctuations in confirmed cases of CoVID-19 within the association of cases per million population with latitude, dew point temperature is a crucial factor possibly determining the incidence rate of disease. Dew point temperature decreases with increasing latitude and vice versa, implying that countries located at higher latitudes normally have low average annual dew point temperatures and such conditions are more favorable for sustenance of disease causing organisms also seen from studies reported on SARS-CoV-2 viability, transmission and incidence rate (Auler et al., 2020 [27]; Eslami and Jalili 2020 [28]; Ficetola and Rubolini et al., 2020 [29]; Chen et al., 2020 [30]).
Population size seemingly intensifies the chances of spreading infection more rapidly in cities with high population densities (Neto and Melo 2020 [31]; Coskun et al. 2021 [32]), apparently specific meteorological factors are observed to have varying levels of impacts on incidence rates (Chien and Chen 2020 [7]; Bukhari et al., 2020 [33]). Increasing population size invariably changes the city fraction rates and this might be detrimental in causing more infection rates through easy transmission in high densely populated communities while the study reveals that this may not be a cause of concern at high city fraction rate beyond 0.4. In support of the results obtained from the current study, apart from the major factors such as temperature, humidity and meteorological factors effecting the CoVID -19, city fraction, latitude and dew point temperature are significant predictors alongside other determining causes assuming the degree of association with incidence rate may vary and fluctuate among regions (Runkle et al., 2020) [14]. Extensive studies by researchers on the association and influence of various elements on the CoVID -19 pandemic reveals combination of factors responsible with varying degrees of impact that result in effecting the intensity of the SARS-CoV-2 transmission within populations, though no single factor can be disregarded partially or totally in understanding its effect on the incidence rate.
Lastly the results sufficiently address the objectives of the study explaining the extent of city fraction rate impacting the number of confirmed cases, which also shows significant increase with latitude from the incidence rate trend observed in the data group countries. Together these two parameters are also understood to predict the confirmed cases reported in each country while specific city fraction rates across the three data group countries determines the severity of disease incidence during the study period. In addition, dew point temperature is a crucial element noted in the study alongside the environmental factors reported known to show the effect on CoVID -19 incidence rate.
5. Conclusion
CoVID-19 pandemic worldwide has drawn attention towards extensive research studies to identify and examine the causes and factors enabling the SARS-CoV-2 to propagate in the environment. Currently the pandemic is still not totally in control as nominal confirmed cases are reported across the world in different countries. Previous literature reports environmental, meteorological and climatic factors affecting the viability, transmission and spread of CoVID-19 in the population, however some studies show certain parameters are negatively associated with disease incidence rate. Through this study, the authors have added an interesting dimension to the existing literature by considering three significant parameters city fraction rate, latitude ranges and dew point temperature to examine the degree of association and influence they impact on the incidence rate of CoVID-19.
The study results show that the city fraction rate combining with latitude ranges substantially can predict to varying levels the incidence rate of SARS-CoV-2. Further, the analysis also reveals countries having city fraction rate in specific range has affinity to show increase in daily confirmed cases after examining the trend in the three data group countries though city fraction rate and latitude differences are not significantly associated implying higher latitude countries does not have proportionate high population size and density indicating an inconsistent trend between them. Although both the factors are independent parameters influencing significantly on the cases per million population reported in the study groups. Observations also demonstrates that the shifts in monthly dew point temperature across the study period shows coincidence with disease incidence rates and changes in dew point temperature resulted in fluctuations in number of cases reported per million population as examined in data group 1 countries (Table 1). In conclusion, the study reveals interesting findings that are noteworthy to report considering the three parameters which are also critical to determine the disease incidence rate apart from other environmental and climatic factors.
5.1 Future scope
Hence, the study reveals that city fraction rate, latitude and dew point temperature are potential parameters to further investigate to ascertain the significant role with changing population size and density over time on the transmission phenomena and viability of SARS-CoV-2, as such studies helps to understand the disease trend and behavior over spatiotemporal patterns with reference to the three parameters.
6. Limitations
It’s essential to highlight that the study has constraints for the data group 1 cities, as the association of dew point temperature with incidence rate was not tested statistically to relate the degree and strength of association between them due to unavailability of CoVID-19 cases reported from each city but examined at country level. Next, the confirmed cases per million population were examined for the countries only over a limited duration of 2020 not counting for the entire year due to lack of accurate data on cases for all the countries. Conversely, for the study the data on the confirmed cases were examined during the peak period of the pandemic incidence observed across the world.
References
- John Hopkins University. Corona virus resource center (2020).
- Int. https://www.who.int/emergencies/diseases/novel-coronavirus-2019/question-and-answers-hub/q-a-detail/coronavirus-disease-covid-19-similarities-and-differences-with-influenza (2020).
- Heywood AE, Macintyre CR. Elimination of covid -19: what would it look like and is it possible? The lancet infectious disease 20 (2020): 1005-1007.
- Ahmed AE, Altamimi Asmaa. Climate factors and incidence in middle east respiratory syndrome coronavirus. Journal of infection and public health 12 (2020): 704-708.
- Killerby ME, Biggs HM, Midgley CM, et al. Middle east respiratory syndrome coronavirus transmission. Emerging Infectious Diseases 26 (2020): 191-198.
- Cacho PM, Hernández JL, López-Hoyos M,et al.Can climatic factors explain the differences in COVID-19 incidence and severity across the Spanish regions? An ecological study.Environ Health19 (2020).
- Chien LC, Chen LW. Meteorological impacts on the incidence of COVID-19 in the U.S, Environ. Res. Risk Assess (2020).
- Guo C, Bo Y, Lin C, et al. Meteorological factors and CoVid -19 incidence in 190 countries: an observational study. Science of the Total Environment 757 (2021): 143783.
- Chakrabarti SS, Kaur U, Banerjee A, et al. COVID-19 in India: Are Biological and Environmental Factors Helping to Stem the Incidence and Severity?Aging and disease 11(2020): 480-488.
- Qi H, Xiao S, Shi R, et al. COVID-19 transmission in Mainland China is associated with temperature and humidity: A time-series analysis, Sci. Total Environ 728 (2020): 138778.
- Babu RS, Narasimha Rao N, Vijaya Kumar S, et al. Plausible Role of Environmental Factors on COVID-19 Transmission 2 in the Megacity Delhi, India, Aerosol Air Qual. Res 20 (2020): 2075-2084.
- Pani SK, Huei-Lin N, Ravindra Babu S. Association of COVID-19 pandemic with meteorological parameters over Singapore, Sci. Total Environ 740 (2020): 140112.
- Poirier C, Luo W, Majumder MS, et al. The Role of Environmental Factors on Transmission Rates of the COVID-19 Outbreak: An Initial Assessment in Two Spatial Scales (2020).
- Runkle JD, Sugg MM, Leeper RD, et al. Short-term effects of specific humidity and temperature on COVID-19 morbidity in select US cities, Sci. Total Environ 740 (2020): 140093.
- Wu Y, Jing W, Liu J, et al. Effects of temperature and humidity on the daily new cases and new deaths of COVID-19 in 166 countries, Sci. Total Environ 729 (2020): 139051.
- Ahmadi M, Sharifi A, Dorosti S, et al. Investigation of effective climatology parameters on COVID-19 outbreak in Iran, Sci. Total Environ 729 (2020): 138705.
- Ma Y, Zhao Y, Liu J, et al. Effects of temperature variation and humidity on the death of COVID-19 in Wuhan, China, Sci. Total Environ 724 (2020): 138226.
- Rosario DKA, Mutz YS, Bernardes PC, et al. Relationship between COVID-19 and weather: Case study in a tropical country, Int. J. Hyg. Environ. Health 229 (2020): 113587.
- Zhu Y, Xie J, Huang F, et al. Association between short-term exposure to air pollution and COVID-19 infection: Evidence from China, Sci. Total Environ 727 (2020): 138704.
- Domingo JL, Marques M, Rovira J. Influence of airborne transmission of SARS-CoV-2 on COVID-19 pandemic. A review, Environmental Res 188 (2020): 109861.
- Liu J, Zhou J, Yao J, et al. Impact of meteorological factors on the COVID-19 transmission: A multicity study in China, Sci. Total Environ 726 (2020): 138513.
- Jahangiri M, Jahangiri M, Najafgholipour M. The sensitivity and specificity analyses of ambient temperature and population size on the transmission rate of the novel coronavirus (COVID-19) in different provinces of Iran, Sci. Total Environ 728 (2020): 138872.
- Sahin M. Impact of weather on COVID-19 pandemic in Turkey, Sci. Total Environ 728 (2020): 138810.
- Sarkodie SA, Owusu PA. Impact of meteorological factors on COVID-19 pandemic: Evidence from top 20 countries with confirmed cases, Environmental Res 191 (2020): 110101.
- Pirouz B, Haghshenas SS, Pirous B, et al. Development of an Assessment Method for Investigating the Impact of Climate and Urban Parameters in Confirmed Cases of COVID-19: A New Challenge in Sustainable Development, Int. J. Environ, Res. Public Health 17 (2020): 2801.
- Sajadi, Mohammad M, Habibzadeh, et al. Temperature, Humidity and Latitude Analysis to Predict Potential Spread and Seasonality for COVID-19 (2020).
- Auler AC, Cassaro FAM, Silva VO da, et al. Evidence that high temperatures and intermediate relative humidity might favor the spread of COVID-19 in tropical climate: A case study for the most affected Brazilian cities, Sci. Total Environ 729 (2020): 139090.
- Eslami H, Jalili M. The role ofenvironmental factors totransmission ofSARS-CoV-2 (COVID-19), AMB Expr 10 (2020).
- Ficetola GF, Rubolini D. Climate Affects Global Patterns of Covid-19 Early Outbreak Dynamics. medRxiv preprint (2020).
- Chen Z, Zhang WJ, Lu Y, et al.From severe acute respiratory syndrome-associated coronavirus to 2019 novel coronavirus outbreak: Similarities in the early epidemics and prediction of future trends.Chinese Medical Journal 133(2020).
- Neto RAA, Melo GC. Correlation between weather, population size and COVID-19 pandemic: a study of Brazilian capitals. Journal of health and biological sciences 8 (2020).
- Coskun H, Yildirim N, Gunduz S. The spread of COVID-19 virus through population density and wind in Turkey cities. The Science of the Total Environment 51 (2021): 141663.
- Bukhari Q, Massaro JM, D’Agostino RB, et al. Effects of Weather on Coronavirus Pandemic. J. Environ. Res. Public Health17 (2020): 5399.


 Impact Factor: * 3.6
 Acceptance Rate: 76.49%
  Time to first decision: 10.4 days
  Time from article received to acceptance: 2-3 weeks