Studying the Impact of Air Pollution on Google Search Trends for Asthma
Aiyer P1, Surani SR2*, Mominkhawaja A3, Sheta A3
1The Quarry Lane School, Dublin, CA, United States
2Division of Pulmonary Medicine, Texas A&M University, Corpus Christi, TX, United States
3Texas Tech University, Lubbock, TX, United States
4Department of Computer Science, Southern CT State University, New Haven, CT, United States.
*Corresponding Author: Surani SR, Division of Pulmonary Medicine, Texas A&M University, Corpus Christi, TX, United States.
Received: 31 May 2025; Accepted: 09 June 2025; Published: 30 June 2025.
Article Information
Citation:
Aiyer P, Surani SR, Mominkhawaja A, Sheta A. Studying the Impact of Air Pollution on Google Search Trends for Asthma. Journal of Environmental Science and Public Health. 9 (2025): 22-28.
View / Download Pdf Share at FacebookAbstract
Background: This study aimed to examine the relationship between air pollutant levels— nitrogen dioxide (NO2), particulate matter (PM2.5), and air quality index (AQI)—and public interest in asthma-related information, tracked through Google search activity. Design and Methods: Using an ecological study design, we examined air quality data alongside weekly Google Trends data for keywords related to asthma (“cough” and “inhaler”) in Los Angeles County for 2023. Correlation analysis, timelagged correlations, and Mann-Whitney U tests assessed relationships between air pollutant levels and public search interest. Results: Average values for NO2, PM2.5, and AQI were 22.6 ± 6.6 ppb, 12.1 ± 3.4 μg/m³, and 52.3 ± 15.2, respectively. A moderate positive correlation was found between NO2 levels and search interest in asthma-related terms, especially at a 0-week lag (r = 0.60, p < 0.05). PM2.5 and AQI levels showed no significant correlations with search behavior. The Mann-Whitney U test showed that high-NO2 periods corresponded with significantly increased search interest (test statistic = 566.5, p = 0.00013). Conclusion: Our findings suggest a link between NO2 levels and increased public concern for asthma, reflected in Google search trends. The lack of similar correlations with PM2.5 and AQI underscores NO2 ’s role in asthma-related search activity. This study highlights Google Trends as being valuable for real-time health monitoring and timely public health interventions. Future research could explore public health information-seeking behaviors via digital platforms in response to a wider range of pollutants in diverse populations.
Keywords
<p>Air pollution, Nitrogen dioxide, Google trends, Asthma.</p>
Article Details
1. Introduction
Air pollution, defined as the contamination of the environment by harmful chemical, physical, or biological agents, is a major global health concern [1]. Outdoor pollutants, especially nitrogen dioxide (NO2) and particulate matter (PM2.5 and PM10), have well-documented impacts on respiratory health and are frequently found at unsafe levels, as outlined by the World Health Organization (WHO) guidelines. With an estimated 90% of the global population living in areas where PM2.5 levels exceed recommended limits, exposure to these pollutants significantly increases the risk of respiratory conditions, particularly asthma [2, 3].
Asthma affects over 330 million people worldwide, contributing to a considerable disease burden and straining healthcare systems [4]. For patients with asthma, pollution spikes can trigger exacerbations, leading to increased healthcare visits and, in severe cases, hospitalization [5]. However, relying solely on clinical data for tracking asthma exacerbations may delay public health responses. This is especially true for asthma, where the onset of symptoms may prompt information-seeking behavior before care-seeking behavior, such as hospital visits [6].
Recent advances in digital health surveillance offer a complementary method for monitoring public health behaviors. Increasingly, people turn to online resources to understand their symptoms and health risks, which is reflected in the volume of internet search data [7, 8].
Studies have demonstrated that search trends can track outbreaks of infectious diseases, such as influenza and Ebola, often correlating with, or even preceding, clinical data [9-11]. Despite this success in infectious disease surveillance, the application of Internet search data to chronic respiratory conditions like asthma remains largely unexplored. This method could complement traditional clinical data sources by providing more immediate insights into health concerns, particularly for chronic conditions where symptoms develop gradually.
This study, therefore, aims to investigate whether Google search trends for asthma-related terms can reflect public awareness of air quality fluctuations. Specifically, we examine the relationship between short-term changes in NO2, PM2.5, and AQI levels and search interest in asthma symptoms and treatments. By identifying patterns between pollutant exposure and search behavior, we seek to determine whether internet searches can serve as a real-time proxy for public concern about respiratory health, enabling more immediate responses to environmental health risks.
2. Materials and Methods
2.1 Keyword Selection and Google Trends Data Collection
Keywords were chosen to reflect symptoms and treatments associated with asthma to evaluate public interest in asthma-related health information. After a preliminary review, the terms “cough” and “inhaler” were selected, as they are commonly associated with asthma symptoms and management, making them suitable indicators of asthma-related interest. These terms were verified for relevance by conducting initial searches to confirm their association with respiratory health.
Weekly search volume data for these keywords was collected from Google Trends from January 1 to December 31, 2023. Google Trends reports search interest on a 0–100 scale, with 100 representing peak search interest within the timeframe. Given Los Angeles County’s significant population density and diverse environmental conditions, data was extracted at the county level.
2.2 Air Quality Data Collection
Air quality data for nitrogen dioxide (NO2), particulate matter (PM2.5), and AQI (a composite measure reflecting the combined effect of various pollutants) was obtained from the U.S. Environmental Protection Agency (EPA). Daily pollutant concentrations from monitoring stations within Los Angeles County were averaged to create weekly mean values, aligning with the Google Trends data structure for comparison of search interest with pollutant levels.
2.3 Statistical Analysis
To assess the relationship between air quality and public interest, we used the following statistical approaches:
Correlation Analysis: Pearson correlation coefficients were calculated to examine the association between weekly pollutant levels (NO2, PM2.5, and AQI) and search interest in “cough” and “inhaler.”Time Lag Analysis: Correlations with 1- and 2-week time lags were analyzed to identify any delayed responses to pollution. This analysis aimed to capture potential lagged effects of NO2 on search trends, to capture the potential delay between pollutant exposure and symptom onset as reflected in search behavior.
Mann-Whitney U Test: This test was conducted to compare search interest during high and low NO2 concentration periods, assessing whether NO2 levels significantly impacted search behavior.
2.4 Data Processing and Software
Data processing and statistical analyses were conducted using Python. Statistical tests, including the Mann-Whitney U test and correlation analyses, were carried out with SciPy, and all visualizations were created using Matplotlib.
3. Results
3.1 Descriptive Statistics and Data Trends
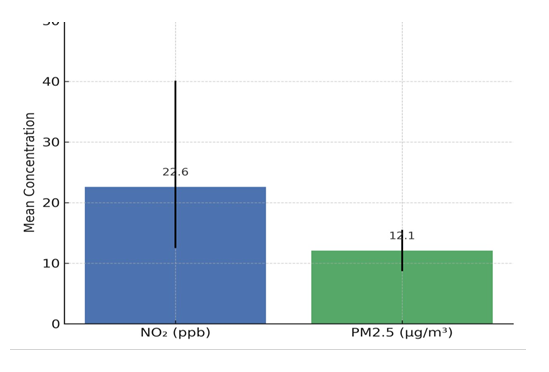
The air quality data and search interest metrics were analyzed to understand the general trends and variability over the study period. The mean NO2 concentration in Los Angeles County during 2023 was 22.6 ± 6.6 ppb, ranging from 12.5 to 40.1 ppb. PM2.5 concentrations averaged
12.1 ± 3.4 µg/m³, while the AQI had a mean value of 52.3 ± 15.2. The mean Google search interest for asthma-related terms (“cough” and “inhaler”) was 62.3 ± 12.1, with values spanning from 42.5 to 92.0.
The box plots highlight the variability in pollution levels, with NO2 showing a broader range and higher peaks compared to PM2.5 and AQI.
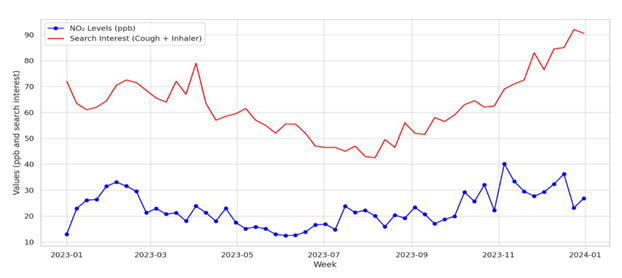
Initial analyses suggested that Google search interest in asthma-related terms tended to rise either concurrently with or shortly after spikes in NO2 levels, indicating a possible time-sensitive response to elevated pollution levels.
This time series plot shows that periods of elevated NO2 often coincide with increased search interest, reflecting a potential real-time or short-lagged relationship between pollution levels and public concern for respiratory health.
3.2 Correlation and Time Lag Analysis
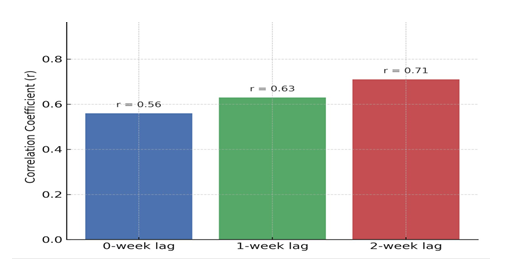
To investigate the relationship between air pollutant levels and search interest, Pearson correlation coefficients were calculated for NO2, PM2.5, and AQI with search interest at 0-, 1-, and 2-week lags.
Table 1: Displays the correlation coefficients and associated p-values, highlighting NO2’s consistent association with search interest:
|
Lag |
NO2 (r) |
NO2 (p) |
PM2.5 (r) |
PM2.5 (p) |
AQI (r) |
AQI (p) |
|
0-week |
0.5587 |
0 |
-0.1508 |
0.2812 |
-0.2441 |
0.0781 |
|
1-week |
0.6344 |
0 |
-0.2666 |
0.0561 |
-0.3094 |
0.0256 |
|
2-week |
0.7125 |
0 |
-0.1565 |
0.2727 |
-0.1921 |
0.1769 |
The results indicate a strong positive correlation between NO2 and search interest, peaking at a 2-week lag (r = 0.71, p < 0.001). Moderate-to-strong correlations were also observed at 1- week (r = 0.63) and 0-week (r = 0.56) lags, both statistically significant, indicating that search interest in respiratory health terms is closely aligned with NO2 levels in near real-time. On the other hand, PM2.5 and AQI correlations with search interest were low and statistically non- significant (r < 0.30, p > 0.05), suggesting that they do not meaningfully influence search behavior in this context.
The time lag analysis further supports NO2’s unique impact on public interest, with the strongest correlation observed at the 2-week lag, suggesting that while search interest may spike immediately with NO2 increases, the effect can persist up to two weeks.
3.3 Mann-Whitney U Test for High vs. Low NO2 Periods
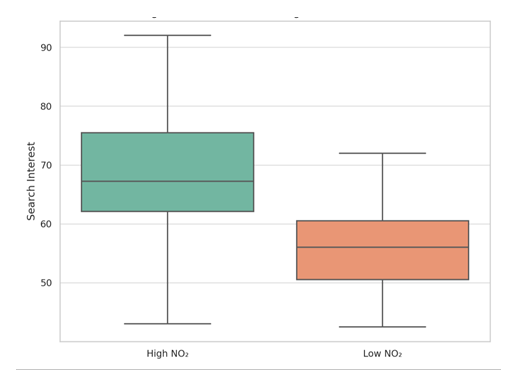
To assess whether elevated NO2 levels are associated with increased public concern, a Mann- Whitney U Test was conducted, comparing search interest during high and low NO2 concentration periods. The test yielded a significant result (test statistic = 566.5, p = 0.00013), confirming that search interest for “cough” and “inhaler” is significantly higher during weeks of elevated NO2 concentrations. Figure 4 visualizes this comparison, illustrating a noticeable increase in search interest during high NO2 periods compared to low NO2 periods.
These results reinforce the idea that public awareness of respiratory health risks, as measured through online search behavior, is influenced by NO2 levels. Unlike PM2.5 and AQI, which showed no significant impact on search trends, NO2 appears to play a distinct role as a potential trigger for public interest in asthma-related health concerns. This finding highlights the pollutant-specific nature of public health awareness and suggests that NO2 is uniquely associated with respiratory health behavior.
4. Discussion
This study reveals a significant association between nitrogen dioxide (NO2) levels and public interest in asthma-related terms, as indicated by Google search trends for “cough” and “inhaler.” Elevated NO2 concentrations correlate with contemporaneous increases in search interest, suggesting that heightened NO2 pollution may uniquely drive public concern about asthma symptoms and treatments. In contrast, no significant correlations were observed between search interest and levels of PM2.5 or AQI, underscoring NO2’s distinct influence on asthma related search behavior.
4.1 NO2 and Asthma
NO2, a major byproduct of vehicle emissions, comprises up to 80% of ambient traffic-related air pollution in urban areas [12]. It penetrates deep into the respiratory tract and triggers bronchospasm, wheezing, and coughing at concentrations as low as 0.2 ppb. At higher levels (>2.0 ppm), NO2 impairs immune function by suppressing CD8+ T cells and NK cells [13].
Moreover, NO2 may escalate allergic inflammation within the airway and prolong allergen- induced airway hyper-responsiveness (AHR), by acting as a sensitizing agent [14]. Even low-dose, prolonged exposure (≥0.4 ppm) augments both immediate and delayed allergic responses. This effect is mediated in part through activation of key inflammatory pathways, including NF-κB [13].
Epidemiological studies have linked NO2 exposure to increased incidence rates and mortality in asthma patients [15]. This connection is likely due to NO2’s role in worsening asthma symptoms—such as coughing, wheezing, and shortness of breath—by promoting bronchoconstriction and enhancing airway hyper-responsiveness in affected individuals [16]. These impacts help explain why NO2 has a stronger connection with asthma-related search interest than other pollutants. The study’s findings support this, as search interest for asthma terms tends to rise during times of elevated NO2, highlighting the pollutant’s role as a possible trigger for asthma exacerbations.
4.2 Public Health Surveillance Implications
Conventional monitoring systems primarily rely on clinical data, such as emergency department visits and hospital admissions, which often lag behind the initial onset of symptoms and public awareness. In contrast, Google Trends data provides near real-time insights into health awareness, allowing health agencies to anticipate public concerns linked to pollution events and respond more rapidly. This proactive approach is consistent with recent studies on internet search patterns, which highlight the effectiveness of digital data in tracking infectious disease outbreaks and anticipating seasonal health fluctuations [17, 18]. Google Trends could serve as an early warning tool, making public health communication timelier and more targeted. By aligning interventions with peaks in search activity, health campaigns can enhance their impact by leveraging heightened public interest during pollution episodes to deliver relevant health information and emphasize preventive measures.
4.3 Limitations and Considerations
Despite the promising findings, several limitations must be acknowledged. Although Google Trends provides rapid and wide-reaching insights, its use in public health research requires careful interpretation due to inherent limitations in the data.
Google Trends data provides a relative measure of search interest, not absolute counts, which could affect the precision of the results [19]. Additionally, search behavior may vary across demographic groups, including age, socioeconomic status, and access to digital resources, potentially introducing bias. For example, certain populations may be underrepresented in online data, a challenge noted in prior studies examining digital health surveillance disparities [20].
The study’s focus on Los Angeles County also limits the generalizability of the findings. Los Angeles was chosen for its high traffic density and pollution levels, making it an ideal candidate for a pilot study on this topic. Regions with different pollution profiles, public awareness, or digital engagement may exhibit distinct trends, necessitating future research to confirm our findings in diverse settings.
Furthermore, the selection of keywords— ‘cough’ and ‘inhaler’—was based on their strong association with asthma exacerbations, as supported by existing literature. For example, a systematic review found that short-acting β-agonist use, and cough are associated with an increased risk of asthma attacks [21]. While these keywords capture key asthma-related concerns, additional terms such as ‘asthma symptoms or ‘wheezing’ could be explored in subsequent studies to provide a more comprehensive picture.
Similarly, while NO2, PM2.5, and AQI were chosen based on their established significance in respiratory health, the inclusion of other pollutants, such as ozone (O3) or sulfur dioxide (SO2), could offer further insights. However, daily data for these additional pollutants are not consistently available from sources like the EPA, constraining their inclusion in real-timestudies. Lastly, seasonal variations and air quality may also influence search interest, potentially contributing to the observed trends. However, the fact that only NO2 showed a consistent and significant association with search interest, while PM2.5 and AQI did not, suggests that these seasonal effects are less likely to explain the observed patterns fully. Instead, NO2’s specific impact appears to be more closely tied to public concern for respiratory health, reinforcing the unique role of this pollutant as an asthma trigger. These limitations underscore the need for caution in interpreting the findings and suggest directions for future research.
4.4 Strengths and Novel Contributions
Until now, previous research has extensively examined the impact of short-term exposure to outdoor air pollutants by studying various asthma-related outcomes, such as asthma control, lung function, medication usage, outpatient visits, exacerbations, emergency room visits, hospitalizations, length of hospital stay, and even mortality. In contrast, our study utilizes Google search trends as an alternate measure of public interest in asthma symptoms and management to investigate this relationship from a more behavioral perspective. This study offers notable strengths and introduces a novel application of Google Trends for real-time public health monitoring in the context of air pollution. Google Trends data provides a rapid, cost-effective method for tracking population health behaviors, enabling public health agencies to observe patterns in near real-time, which is impossible with traditional clinical data [21]. By integrating hyperlocal Google search metrics with local air quality data, we demonstrate pollutant-specific public health behavioral responses—particularly to NO2.
This finding aligns with other ecological studies that examine environmental triggers of health behaviors yet extends the approach by focusing on digital behavior as a proxy for public health concerns [22]. Though the majority of the public health focus on outdoor air quality and its relationship to asthma incidence has centered on pollutants like PM2.5 and ozone [23], this study emphasizes the crucial need for pollutant-specific analyses that divulge the individual impacts of various air pollutants. By highlighting the distinctive role of NO2, particularly in urban environments, our study suggests that NO2 may serve as a more immediate and significant indicator of asthma flare-ups as opposed to previously recognized pollutants.
4.5 Future Directions
This study opens several avenues for future research. Expanding the range of keywords to include other respiratory symptoms and treatments could capture a broader scope of public interest, generalizing findings and enhancing their applicability. Additionally, conducting similar studies in diverse geographic regions could provide insights into regional variations in pollution exposure and public response, addressing limitations in generalizability. Another promising direction involves integrating search trend data with clinical data, such as emergency room visits, to assess the relationship between public concern and health outcomes directly. This integration has proven effective in infectious disease surveillance [24] and could yield valuable insights into pollution-related respiratory issues. Investigating seasonal fluctuations in search trends related to air quality also clarifies how awareness varies with seasonal pollution patterns, supporting the development of seasonally responsive health strategies. Finally, incorporating demographic data into the analysis would help identify vulnerable populations, enabling targeted public health interventions that address disparities in pollution exposure and access to health information.
5. Conclusion
In summary, this study demonstrates the potential of Google Trends as a real-time tool for monitoring public concern about respiratory health in response to air pollution. The observed association between NO2 levels and increased search interest for asthma-related terms highlights the utility of pollutant-specific analyses for public health surveillance, uncovering patterns that may not be immediately evident through traditional methods. While limitations exist, the approach’s strengths and novelty underscore its potential as a scalable tool for environmental health monitoring. As air quality concerns continue to impact urban populations, incorporating digital surveillance tools like Google Trends could support data-driven, responsive public health strategies. Future research should continue to refine this approach, exploring its integration with clinical data and its application across diverse populations and environmental conditions to realize its potential within public health systems worldwide fully.
Statements and Declarations:
Ethical Considerations:
Ethics approval was not required for this type of systematic review.
Consent to Participate:
Not applicable.
Consent for Publication:
Not applicable.
The authors declared no potential conflicts of interest with respect to the research, authorship, and/or publication of this article.
Funding Statement:
The authors received no financial support for the research, authorship, and/or publication of this article.
Data Availability:
All data generated or analyzed during this study are included in this published article.
References
- World Health Organization. Ambient (outdoor) air pollution (2024).
- Guarnieri M and Balmes JR. Outdoor air pollution and asthma. Lancet 383 (2014): 1581-1592.
- Anenberg SC, Henze DK, Tinney V, et al. Estimates of the Global Burden of Ambient [Formula: see text], Ozone, and [Formula: see text] on Asthma Incidence and Emergency Room Visits. Environ Health Perspect 126 (2018): 107004.
- World Health Organization. Asthma (2024).
- Shin SW, Bae DJ, Park CS, et al. Effects of air pollution on moderate and severe asthma exacerbations. J Asthma 57 (2020): 875-885.
- Hswen Y, Zhang A and Ventelou B. Estimation of Asthma Symptom Onset Using Internet Search Queries: Lag-Time Series Analysis. JMIR Public Health Surveill 7 (2021): e18593.
- Bachl M, Link E, Mangold F, et al. Search Engine Use for Health-Related Purposes: Behavioral Data on Online Health Information-Seeking in Germany. Health Commun 39 (2024): 1651-1664.
- Pew Research Center. Health Online (2014).
- Alicino C, Bragazzi NL, Faccio V, et al. Assessing Ebola-related web search behaviour: insights and implications from an analytical study of Google Trends-based query volumes. Infect Dis Poverty 4 (2015): 54.
- Althouse BM, Ng YY and Cummings DA. Prediction of dengue incidence using search query surveillance. PLoS Negl Trop Dis 5 (2021): e1258.
- Yang S, Santillana M and Kou SC. Accurate estimation of influenza epidemics using Google search data via ARGO. Proc Natl Acad Sci USA 112 (2015): 14473- 14478.
- Congressional Budget Office. Emissions of Carbon Dioxide in the Transportation Sector (2024).
- Tiotiu AI, Novakova P, Nedeva D, et al. Impact of Air Pollution on Asthma Outcomes. Int J Environ Res Public Health 17 (2020): 6212.
- Poynter ME. Airway epithelial regulation of allergic sensitization in asthma. Pulm Pharmacol Ther 25 (2012): 438–446.
- Sunyer J, Basagaña X, Belmonte J, et al. Effect of nitrogen dioxide and ozone on the risk of dying in patients with severe asthma. Thorax 57 (2002): 687-693.
- Lu C, Liu Q, Qiao Z, et al. High Humidity and NO2 Co-Exposure Exacerbates Allergic Asthma by Increasing Oxidative Stress, Inflammatory and TRP Protein Expressions in Lung Tissue. Environ Pollut 353 (2024): 124127.
- Mavragani A, Ochoa G and Tsagarakis KP. Assessing the Methods, Tools, and Statistical Approaches in Google Trends Research: Systematic Review. J Med Internet Res 2018; 20(11): e270.
- Eysenbach G. Infodemiology and Infoveillance: Framework for an Emerging Set of Public Health Informatics Methods to Analyze Search, Communication, and Publication Behavior on the Internet. J Med Internet Res 11 (2011): e11.
- Nuti SV, Wayda B, Ranasinghe I, et al. The Use of Google Trends in Health Research. PloS One 9 (2014): e109583.
- Donelle L, Comer L, Hiebert B, et al. Use of digital technologies for public health surveillance during the COVID-19 pandemic: A scoping review. Digit Health 9 (2023).
- Mentz G, Robins TG, Batterman S, et al. Effect modifiers of lung function and daily air pollutant variability in a panel of schoolchildren. Thorax 74 (2019): 1055– 1062.
- Williams AM, Phaneuf DJ, Barrett MA, et al. Short-term impact of PM2.5 on contemporaneous asthma medication use: Behavior and the value of pollution reductions. Proc Natl Acad Sci USA 116 (2019): 5246–5253.
- S. Environmental Protection Agency. The Links Between Air Pollution and Childhood Asthma (2024).
- Pepper JR, Barrett MA, Su JG, et al. Geospatial-temporal analysis of the impact of ozone on asthma rescue inhaler use. Environ Int 136 (2020): 105331.


 Impact Factor: * 3.6
 Acceptance Rate: 76.49%
  Time to first decision: 10.4 days
  Time from article received to acceptance: 2-3 weeks