An Acoustic Analytical test for Quality Control on Granular Activated Carbons for Rum Production: Case study of Catalytic activity towards Acetal-Acetaldehyde formation
Harold Crespo Sariol1, Noemí del Toro del Toro2, Donia Hernández Guisado2, Jeamichel Puente Torres3, Jan Yperman4*, Robert Carleer4, Wouter Marchal4 and Dries Vandamme4
1Centre of Neurosciences Signal and Images Processing, Applied Acoustic Research Group, Universidad de Oriente, Santiago de Cuba, Cuba
2Santiago de Cuba Rum Factory, Santiago de Cuba, Cuba
3Faculty of Electrical Engineering, Universidad de Oriente, Santiago de Cuba, Cuba
4Analytical and Circular Chemistry, Hasselt University, Agoralaan building D, 3590 Diepenbeek. Belgium
*Corresponding Author: Jan Yperman, Analytical and Circular Chemistry, Hasselt University, Agoralaan building D, 3590 Diepenbeek. Belgium
Received: 22 January 2024; Accepted: 31 January 2024; Published: 16 April 2024
Article Information
Citation: Harold Crespo Sariol, Noemí del Toro del Toro, Donia Hernández Guisado, Jeamichel Puente Torres, Jan Yperman, Robert Carleer, Wouter Marchal, Dries Vandamme. An Acoustic Analytical test for Quality Control on Granular Activated Carbons for Rum Production: Case study of Catalytic activity towards Acetal-Acetaldehyde formation. Journal of Food Science and Nutrition Research. 7 (2024): 96-112
DOI: 10.26502/jfsnr.2642-110000157
View / Download Pdf Share at FacebookAbstract
This work presents the preliminary results of evaluating the potentialities of the acoustic emission method (AE) as a rapid analytical tool for quality assessment of granular activated carbons (GAC) used in the rum production process. A new commercial GAC-2 from a new supplier was under technological assessment in a pilot scale rum factory facility for research purposes. The GAC-2 was evaluated for ethanol-water solution refining operation in a fixed bed adsorption system. After a nonstationary operational test period of about 60 days, a significant deviation of the sensory quality (ethereal odor and untypical flavor) of the outlet filtered ethanol solution was detected. According to headspace (HS) and liquid SPME-GC/MS and TD-GC/MS analyses performed on the refined ethanol solution and GAC-2/U (GAC-2 after being used for ethanol solution refining) respectively and based on previous case studies, it was found, that the GAC-2 catalysed the ethanol conversion into acetaldehyde and its acetal (1,1-diethoxyethane) thus provoking undesirable sensory characteristics of the rum. GAC-2 was texturally and chemically compared with a traditionally used granular activated carbon for rum production: i.e., GAC-1 as reference which has an extensively proved satisfactory organoleptic performance in rum production. Although the commercial information about technical and physicochemical parameters of GAC- 2 and GAC-1 reported by the suppliers suggests that both materials are texturally comparable, differences were found between GAC-2 and GAC-1 based on BET, TGA, Digestion-ICP and AE. This study points to the possibility of applying AE method as a very sensitive and rapid complementary analytical test to detect differences between GACs with potential practical applications in the industrial sector.
Keywords
<p>Rum, GAC, Acetal, Acoustic emission method</p>
Article Details
Introduction
Activated carbon (AC) can be defined as carbon-based materials which contain well developed internal pore structures and extended surface [1]. AC is produced from a variety of carbonaceous materials such as wood, coal, lignite, coconut shell, agriculture sources and others for adsorption of pollutants from liquids and gases [2,3]. AC has a well-developed surface area, large and diverse porosity distribution consisting of micro (width < 2 nm), meso (2–50 nm), and macro-pores (>50 nm), as well as the presence of a variety of functional groups present on the surface of AC, which makes it a versatile material for adsorption and catalytic processes [4-9]. The adsorption energy in micro-pores is much higher compared to larger pores. As a rule, the greater the pore system and the finer the pores, the higher is the internal surface. In contrast, larger pores (meso-macro) are necessary to enable fast diffusion of the adsorbate to the active sites, creating adsorption possibilities due to the presence of surface functional groups [5,6].
The main mechanisms by which AC interacts with molecules, ions and colloids (adsorbates) in liquid phase are physisorption, chemisorption, ion exchange, precipitation, complexation and catalytic reduction [5-9].
AC can be used powdered or granular (particle size 0.2–5 mm). GACs are widely applied as adsorbent in several areas of food production industries. The GACs remove undesirable odors, colors, and unwanted components in the solution improving the quality of the food and is also employed for product purification (such as sugar refining and water treatment) [8-10]. GACs have been used for a long time in distilleries for refining neutral spirits, finding applications at different stages of the production of distilled alcoholic beverages [11,12]. In case of Cuban rum, the aim of GAC adsorption (also known as “refining/filtration” process) is not only to remove possible unwanted components due to distilling operational deviations but also balance and transform organic compounds in order to modify and improve the sensorial quality of the final product [13]. In Cuban rum manufacturing, adsorption refining process is applied for two main products: (1) the aged fresh distilled rum (known as aged “Aguardiente”) used as rum base after a minimum of two natural ageing stages in different selected oak barrels [14,15] and (2) the water-ethanol solution (50-55 % v/v) used in the production of some specific white rums for applications in cocktail bars.
For the refining process with GAC, fixed bed of GAC is placed in cylindrical contactors (“filters”) where primary aged aguardiente and ethanol-water solution are applied at the top of the GAC columns, flowing through the GAC bed, and is withdrawn as “refined product” at the bottom of the column (Figure 1). Adsorption in a fixed bed of adsorbent in rum production is an unsteady state rate-controlled process. For each refining product process, the industrial GAC filters are designed with specific geometric parameters (diameter and bed height) and operate under different conditions of feed liquid flow and contact time based on specialists’ criteria. Rum masters (experts) determine when the GAC is exhausted based on the sensory quality reaching a minimum organoleptic standard of the filtered product (filtered primary aged rum and filtered ethanol solution). When exhausted/used, the GAC is completely removed from the contactor and replaced by fresh GAC with the derived operational costs associated [16]. Taking into account that there is not a GAC specifically designed for rum production so far, the only method applied by the rum masters to select/approve a GAC is the direct experimental adsorption test.
A new GAC adsorption performance is tested not only based on toxicological and sensory/organoleptic criteria but also the life cycle and exploitation time are important economical parameters to take into account to approve the GAC.
By experience in Cuban rum production, scaling down the industrial adsorption process to a GAC laboratory column test gives uncertain results as empirical design equations are used by rum masters to define the adsorption operational parameters. The empirical design equations consider different variables to establish the proper liquid flow and contact time where the bed dimensions are one of the most influencing design variables. Since the empirical equations are restricted to a GAC bed size range, there is a minimum scaling down size to efficiently reproduce the industrial scenario in organoleptic terms. Therefore, pilot scale facilities of GAC industrial filters in rum factories are created for research purposes.
One of the catalytic processes taking place on GAC active centres is the conversion of alcohols [7,17,18]. Methanol and ethanol conversion reactions are of the most reported due to the significant industrial importance of the products obtained such as ethylene, acetaldehyde, diethyl ether, dimethyl ether and formaldehyde [7,19,20].
According to published reports, ethanol conversion leads not only to ethylene, diethyl ether, acetic acid and acetaldehyde, but also produces ethyl acetate (ester) and 1,1-diethoxyethane (acetal) [7,17-21]. The two latter compounds are produced in the secondary reactions between acetic acid or acetaldehyde and ethanol respectively. The reaction of dehydrogenation takes place in presence of Lewis base and acid centres, while that of dehydration involves only acid centres [21]. Taking into account the selectivity of these reactions towards acid or base catalytic centres, these processes are often used for characterisation of the chemical functionalities at the surface [7].
Results reported by Jasinska J. et al. [7] described catalytic tests for conversion reactions of ethanol and methanol performed on 13 samples of ACs prepared from Polish brown coal by chemical activation with potassium hydroxide and modified by treating with different reagents (nitric acid, sulphuric acid, peroxyacetic acid, air, gaseous ammonia and chlorine) in order to modify its surface functionalities and textural properties. They proved that all ACs, modified with the different chemical agents, catalyse the conversion of alcohols, however, to a different degree. It was found that in the case of ethanol, the main conversion reaction was dehydrogenation. As conclusion, for ethanol catalytic conversion by ACs, they found that the majority of tested catalysts showed activity towards formation of acetaldehyde, except for an AC oxidised with concentrated nitric acid, which showed the highest content of oxygen in the carbonaceous structure, leading to ethanol dehydration towards ethylene. Additionally, chlorinated AC was highly effective in oxidation of ethanol towards acetaldehyde [7,18].
On the other hand, Suescún et al. (2010) [22] obtained 1,1-dietoxyethane by applying modified bentonite by acidic activation with HCl and H2SO4 as catalyst in a lab scale column system and using sugar cane ethanol and acetaldehyde solutions as reagents according to the general reaction equation (I). Bentonite was a more efficient catalyst than CaCl2 which is commonly used for this purpose. The ethanol-acetaldehyde-bentonite catalytic reaction system was more efficient at 30ºC with a fractional conversion yield of about 0.55.

The occurrence and presence of acetaldehyde and its acetal derivative, 1,1-diethoxyethane, have been widely reported as key odorant with a powerful olfactometry perception in several alcoholic beverages and wines chemical/sensory characterization studies [23-27]. The odor and taste description for acetaldehyde and 1,1-diethoxyethane described by different researchers varies from ethereal, earthy, herbal-green, chemical to fruity and sweet [23-28], depending on its concentration and diluting medium. Therefore, it is difficult and speculative to obtain conclusive criteria because of the great number of compounds implied in the aroma and taste fraction of the alcoholic beverages. The positive or negative contribution of a sensory key component in an alcoholic beverage is just a sensory/chemical concentration balance issue in function of its interaction/combination with the whole chemical system [29] which in turn must be in line with the specific features to reach for a defined beverage. Thus, a compound considered as a key positive attribute for a beverage at determined concentration, might produce undesirable sensory effect at higher concentrations or is simply considered as a negative attribute for other beverages at any concentration. Therefore, the catalytic activity of GAC by interacting with different adsorbates in rum production is a major concern for rum factories. If the GAC is not correctly selected or the combination of its mechanical, textural and chemical characteristics as quality parameters differs from one material to another, it can lead to an important economic loss because all rum produced (out of quality) must be discarded.
The precursors, chemical pre-treatment and activation process strategies are traditionally reported as the main variables that can modify the final textural characteristics of a GAC [30-33]. However, other aspects of the final GAC manufacturing process such as the particle size, hardness and pelletizing binder are also crucial quality parameters to ensure successful results during GAC adsorption operations at industrial scale. On the other hand, AE has proved to be a sensitive and robust analytical method for textural characterization of GAC [4,9,10,29-31]. However, as a relatively recent method, potential AE applications in industry are still barely explored and need to be further studied. In this work, preliminary results of evaluating the potentialities of the AE as a rapid analytical tool to assess the textural quality of GAC used in rum production process are presented. By applying the AE method, it is possible to rapidly detect overall differences between GACs quality parameters used in rum production. These results could be interesting not only for rum producers but also for AC manufacturers in order to apply the AE method advantages in their industrial processes.
Materials and Methods
2.1 Pilot scale GAC fixed bed contactor
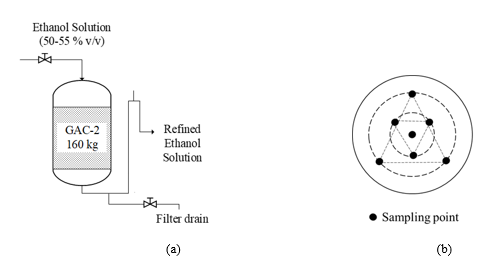
Figure 1 (a) depicts the simplified scheme of the pilot scale GAC fixed bed contactor used for the GAC adsorption performance assessment for the refining process of ethanol-water solution from the major rum producer in Cuba. A column with 160 kg (about 3.5 m3 of GAC bed) is prepared in the pilot plant with the new GAC to be evaluated (being GAC-2). The ethanol solution refining process is conducted at room temperature by the rum masters under specific operational conditions of liquid flow and residence time based on their design criteria. The refining process is carried out in batch conditions at atmospheric pressure and the liquid crosses the GAC bed only by gravity force.
Figure 1: Simplified schemes of (a) the pilot scale adsorption column applied for the GAC-2 assessment in ethanol-water solution refining process in rum production. (b) (Figure adapted from [4]) Pattern followed for sample collection from the adsorption column layers of the GAC-2 used in ethanol solution refining (being GAC-2/U).
A defined amount of ethanol solution (batch) is refined each day according to the production demand in the factory and is carefully monitored by the rum masters to guarantee optimal flow velocity. At the end of each batch operation process, the filter is drained by opening the drain valve in the siphon neck. Despite of the draining operation, the GAC in the column is still wetted by the ethanol solution till the next batch is fed. As previously discussed, the adsorption performance quality control of a GAC is empirically assessed by the rum taste experts and only based on the sensorial characteristics of the refined outlet product. The practical evidence gathered for years has been the main (and only) criterion to accept a specific type of GAC [29].
2.2. Description of the GAC-2/U and refined ethanol solution sampling
After about 60 days of operation test with the new commercial GAC-2 under assessment in the pilot research facility, a sudden sensory deviation in the refined ethanol solution was detected by the rum masters. An organoleptic judgement board composed by 11 taste experts alleged a persistent strong ethereal/chemical aroma and a light sour flavor in the refined product. The organoleptic deviations significantly affected the standard parameters defined for the refined ethanol solution for Cuban rum production.
The deviated sensory profile detected, almost completely erased (organoleptically speaking) the sugar cane sweet-fruity aroma and flavor which are one of the distinctive and highly appreciated sensory attributes of GAC refined ethanol solutions for rum production. In that point, the refining/filtration operation was declared out of quality. The used GAC-2/U sampling process from the adsorption column was conducted as reported in [4,8]. By applying a dedicated sampler (punctual picker), a collection of twenty samples at different layers (sampling points) in the contactor’s bed and radially distributed over the whole layer area (Figure 1(b)), were gathered and mixed to obtain a representative sample of GAC-2/U. Also, a sample of 700 mL of the refined ethanol solution with the detected organoleptic deviation, confirmed by the sensory judgement board, was extracted from the GAC-2/U filter outlet stream.
2.3. Characterization of the refined ethanol solution
2.3.1. Solid-phase microextraction (SPME)-GC/MS and headspace- solid phase microextraction (HS-SPME)-GC/MS: HS-SPME was carried out in automated mode by using a TriPlus autosampler (Thermo Scientific, USA), interfaced to a Trace 1310 gas chromatograph (Thermo Scientific, USA) and ISQ LT single quadrupole mass spectrometer (Thermo Scientific, USA). HS-SPME was performed with 2 types of fibers; a midpolar polydimethylsiloxane/divinylbenzene (PDMS/DVB) 65 µm fiber (Supelco, USA) and the more polar polyacrylate (PA) 85 µm fiber (Supelco, USA). After addition of 1.5 g NaCl, a volume of 5 ml sample was incubated for 10 minutes at 60 °C, under regular agitation (10 s intervals). The SPME fiber was exposed in the headspace for 30 minutes at the same temperature and agitation conditions. Once the extraction step was completed, the fiber was desorbed for 22.5 minutes in the GC injection port at 250 °C (in splitless mode). The gas chromatograph was equipped with a DB-5MS capillary column (30 m length, 0.25 mm I.D., film thickness 0.25 µm, Agilent Technologies, USA). The oven temperature was held at 30 °C for 3 minutes after the start of the desorption and programmed to 100 °C at a rate of 8 °C/min and thereafter to 250 °C at a rate of 12 °C/min with a final hold time of 6 minutes. The MS transfer line was set at 280 °C. Helium was used as the carrier gas and the flow rate was set at 1.2 ml/min. The MS was operated in electron ionization mode with 70 eV at a source temperature of 250 °C and a mass range of 35-450 m/z with a scan time of 0.25 sec. Data processing was performed using Chromeleon 7.3 (Thermo Scientific, USA).
2.4. Characterization of the GAC samples: GAC-1, GAC-2 and GAC-2/U
2.4.1. Thermal desorption-gas chromatography/mass spectrometry (TD-GC/MS): In order to determine the adsorbed compounds on the GAC-2/U surface, TD-GC/MS was carried out with a TD-100 instrument (Markes, United Kingdom) combined with a Trace GC Ultra gas chromatograph (Thermo Finnigan, Italy) and ISQ 7000 single quadrupole mass spectrometer (Thermo Scientific, USA). Approximately 50 mg of sample was placed in a glass tube (89 mm long, 6.4 mm O.D., 4 mm I.D.), where it was retained with glass wool. In order to gently desorb the volatile compounds from GAC-2/U avoiding the thermal decomposition/transformation risks, TD conditions were as follows: the desorption temperature of analytes from the samples was set at 90 °C for 15 minutes, at a flow rate of 50 ml/min; desorption from the cold trap (High Boilers) was set at 320 °C for 3 min, at a flow rate of 20 ml/min, and the trap heating rate was set at 100 °C/s. The gas chromatograph was equipped with a DB-5MS capillary column (30 m length, 0.25 mm I.D., film thickness 0.25 µm, Agilent Technologies, USA) with helium as the carrier gas. The oven temperature was held at 30 °C for 2 minutes after the start of the trap desorption and programmed to 100 °C at a rate of 8 °C/min and thereafter to 310 °C at a rate of 12 °C/min with a final hold time of 2.4 minutes. The MS transfer line was set at 260 °C. The mass spectrometer was operated in electron ionization mode with 70 eV at a source temperature of 200°C and a mass range of 33-550 m/z with a scan time of 0.25 s. Data processing was performed using Chromeleon 7.3 (Thermo Scientific, USA).
2.4.2. N2 at77K volumetric gas sorption-desorption analysis: N2 adsorption at 77 K was applied to texturally characterize the GAC-1 (reference) and GAC-2 samples by applying Autosorb-iQS equipment. Before the analysis, the samples were degassed overnight at 300 ºC. The specific surface area (SBET) was estimated by the BET equation. The amount of gas adsorbed at the relative pressure of p/p0 = 0.96 was employed to determine the total volume of pores (VT). The difference between VT and VDR was taken as the mesopore volume (Vmes). The micropore volume (VDR) was calculated by applying the Dubinin-Radushkevich equation and the average micropore width (L0) was calculated using the Stoeckli equation [34].
2.4.3. Digestion ICP-AES: Sample portions of 0.1 g and 0.25 g were weighted depending on the expected concentration range. The samples were digested in Teflon vessels mounted in a Milestone Ethos up microwave reactor, using a two-step digestion based on a mixture of HNO3 and H2O2, previously described in detail by Stals et al [35]. After digestion, the samples were diluted up to 50 mL using milli-Q water (resistivity 18 MΩ cm). The ICP-AES measurements were performed on an Optima 3000 DV ICP-AES instrument (PerkinElmer, Waltham, USA) in axial viewing mode. Instrument calibration was done using Merck S ICP standard Certipur®, VWR Chemicals P Plasma Emission Standard and ICP Merck multi standard solution IV, and 5 ppm QC samples for every determined element were included.
2.4.4. Thermogravimetric analysis (TGA): Thermogravimetric curves of GAC-1 and GAC-2 were obtained using a TA Hi-Res 2950 Thermogravimetric Analyzer. About 7 mg of GAC sample is heated under approximately 35 mL/min N2 gas flow at a heating rate of 20 ºC/min from room temperature to 900 ºC. In order to determine the ash content of the carbon samples, the inert atmosphere was switch to O2 after 600 ºC.
2.4.5. Fourier Transform Infrared Spectroscopy (FTIR): FTIR spectra of the GAC-1 and GAC-2 samples were obtained using a Bruker Vertex 70 FTIR spectrometer equipped with a DTGS detector. The particles size of the samples was <125µm. Spectra were recorded at a resolution of 4 cm-1 within the 4000-480 cm-1 range, with 32 scans per sample and an aperture setting of 6.
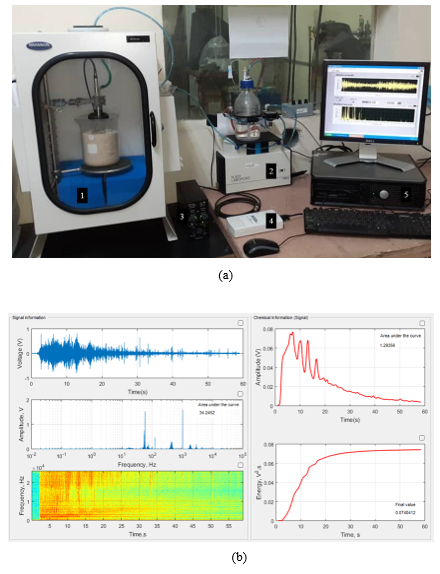
2.4.6. Acoustic Emission (AE): The AE experiments for textural characterization were performed following a similar procedure reported by Peacok et al. (2020) [36] but upgrading the setup by incorporating a controlled pneumatic water injection system as presented in figure 2(a). In brief, the AE experiments were developed into a calibrated BRANSON® sound enclosure box (1). The GAC sample (10 g) was distributed at the bottom of an Erlenmeyer flask which is surrounded by sand to reduce possible external interferences. A G.R.A.S.®46 AC microphone (Nominal sensitivity 12.5 mV/Pa, Frequency range 3.15 Hz–40 kHz, Dynamic range 20 dB–164 dB) for precision acoustic measurements was used as (air-mounted) sensor, thus reducing the possibility of measuring undesirable vibrations (noise). After the system was enclosed, 40 ml of water was injected at 10 mL/s by the controlled pneumatic water injection system (2) towards the bottom of the Erlenmeyer to flood the GAC sample and immediately air bubbles were generated producing the typical GAC sound taking about 60 s as recording time for GAC-1 and GAC-2 samples.
Figure 2: (a) Picture of the AE setup. (1) Sound enclosure box with a GAC sample surrounded by sand and the G.R.A.S.®46 AC microphone inside. (2) Pneumatic water injection system. (3) 12-AQ power module. (4) NI USB 6211 data acquisition card. (5) PC. (b) Screenshot of the graphical environment of the dedicated software programmed on LABVIEW® and MATLAB® for the acoustic signal acquisition and processing.
GAC-1 and GAC-2 acoustic signals captured by the microphone and amplified using a G.R.A.S.® Power Module type 12AQ (3) and digitalized using a NI USB 6211 data acquisition card (4) to be recorded and processed by the computer (5) using dedicated software programmed under LabVIEW® and MATLAB® (Figure 2(b)). Before measuring, the setup was calibrated using a G.R.A.S.® 42AP intelligent pistonphone. The applied procedure for signal processing and analysis was performed following the same methodology previously reported in [36].
Summarizing: to discard any external interference associated with the frequency of interest, spectrograms and components of frequency within the range of 3.5–52 kHz were recorded at empty sound enclosure box. No external interferences (noise) were found in the original signal in the selected frequency range. A high-pass filter was used for the signal digital filtering in the range of interest (3.5-52 kHz). The acoustic signal envelope within the time domain was obtained by using the Hilbert Transform of the vibro-acoustical signals and the total acoustic energy (energy isotherms) of the signal was calculated applying the Parseval’s theorem (with the contribution of Plancherel and Rayleigh) [36,37,38]. Acoustic analyses were performed in triplicated and statistically treated to obtain averaged parameters.
Results and Discussion
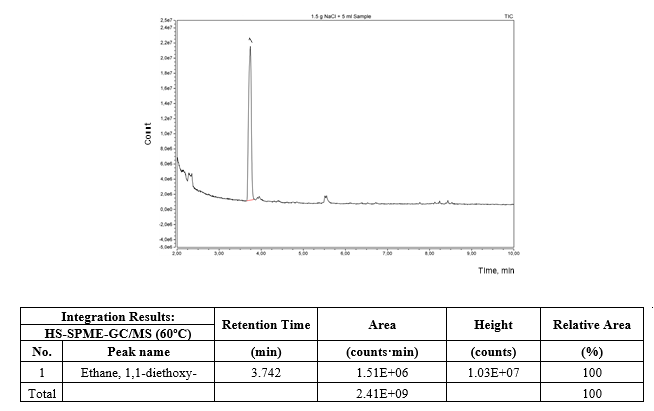
Figure 3 depicts the HS-SPME-GC/MS chromatogram of the refined ethanol solution. Only a well-defined chromatographic peak of 1,1-diethoxyethane was found in the headspace of the refined ethanol solution as volatile compound apart of ethanol and water which were omitted from the chromatogram to get a better appreciation of the low concentration peaks.
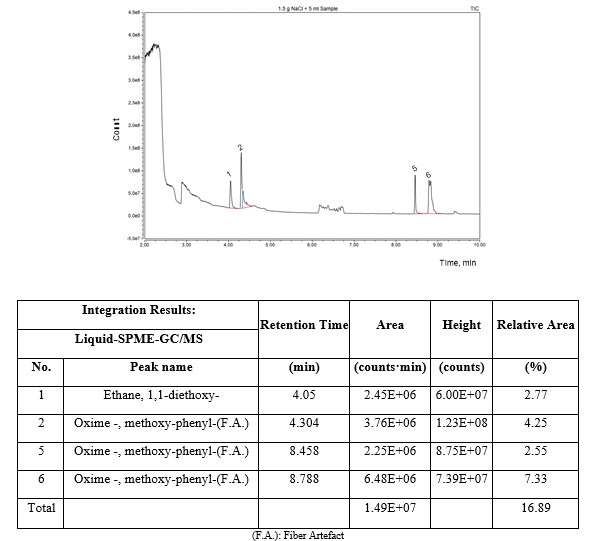
On the other hand, the same result was found by the liquid solid phase microextraction as presented in the chromatogram of figure 4. In both cases, headspace and liquid GC/MS analysis, 1,1-diethoxy-ethane was the only detected compound in both phases apart of ethanol and water.
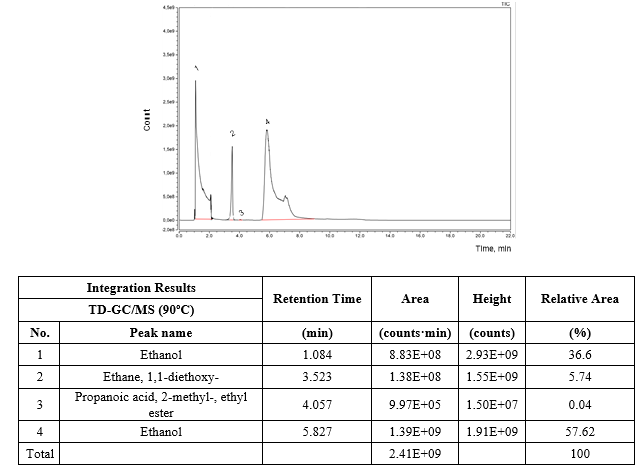
Additionally, based on the results presented in figure 5 concerning the TD-GC/MS analysis performed on the GAC-2/U after 60 days of exploitation at 90 ºC of desorption temperature, not only ethanol and 1,1-diethoxy-ethane were identified but also 2-methyl-propanoic acid and ethyl ester were present in trace amounts (0.04 % of relative area). This ester has been also identified in fresh distilled and aged rums [25-27] with tropical fruit and sweet tones contribution in the rum aroma. The ethanol (96 % v/v) to prepare the ethanol solution used for rum formulation is obtained by a rectification distilling process in columns of continuous operation using the fresh distilled rum as raw material. Therefore, the presence of this ester accumulated by adsorption onto the GAC can be related to the Cuban rum technology for ethanol solution refining. Headspace and liquid GC/MS analysis of the refined ethanol solution and thermal desorption-GC/MS analysis of GAC-2/U as well the organoleptic profile of the sensory deviation described by the Cuba rum taste experts in the refined ethanol solution after 60 days of using the new GAC-2, point to 1,1-diethoxy-ethane as the compound responsible of the sensory deviation.
The organoleptic features of this acetal are consistent with the described sensory deviation (ethereal / chemical) described by the Cuban rum specialists and in addition, it has been reported that 1,1-diethoxy-ethane is a more potent odorant than acetaldehyde [23]; therefore, its sensory impact is significant even at relative low concentrations.
However, 1,1-diethoxy-ethane was not detected in the ethanol solution before the refining process by applying SPME methods process neither on the fresh GAC-2 by TD-GC/MS analysis (Not presented).
As reported in several publications [1,3,5,7,12,18,21,31], the textural characteristics of a GAC play a significant role in its properties as adsorbent and catalyst. Consequently, in order to evaluate the influence of the GAC textural properties on the acetal formation, the new GAC-2 was analyzed by applying the BET method with N2 sorption-desorption at 77 K. Additionally, BET results of GAC-2 were compared with textural properties of a sample of GAC-1 which was traditionally acquired from a previous AC provider/brand with historical satisfactory organoleptic results, thus GAC-1 was used as a reference for comparison against the new GAC-2.
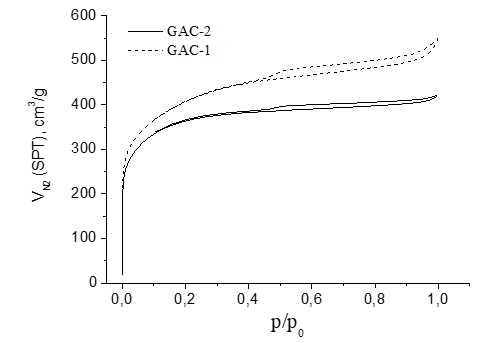
Figure 6 presents the N2 sorption-desorption at 77K isotherms of the samples GAC-1 (reference) and GAC-2 (under assessment). The isotherms for both GACs are type I with a hysteresis loop type H4 according to IUPAC classification [39], indicating a microporous nature of both adsorbents. However, the hysteresis loop of GAC-1 is broader than GAC-2 suggesting a better developed mesoporous structure.
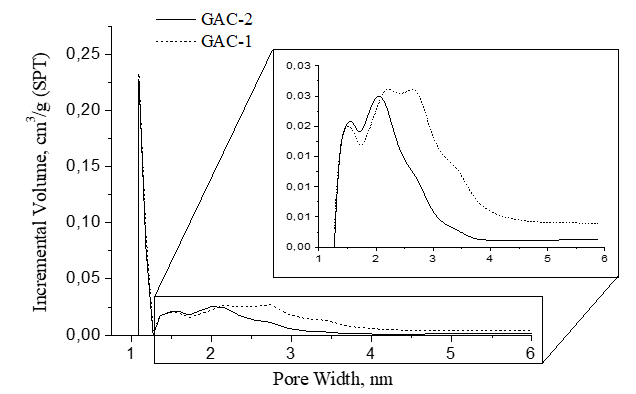
Figure 7 presents the pore width distribution in the GAC samples. The pore width distribution is ranging between micro and mesoporosity. In general, the pores have a comparable size distribution. Clearly a main peak was found at 1.1 nm in both GACs with dominant amplitude of incremental volume contribution. However, after 1.3 nm, the pore size distribution of both GACs behaves different.
Pore size distribution differences are more clearly observed by magnifying the 1.3-6 nm region in figure 7. In both samples, peaks at 1.5 nm and 2 nm were found with a similar volume contribution amplitude. After 2 nm, within the 2-2.75 nm pore size range (region of mesoporosity) GAC-1 described a broader peak region with a significant volume contribution on the porous structure which asymptotically decays till 6 nm but at higher volume pores contribution compared with GAC-2.
|
Method |
Parameter |
Unit |
Samples |
Rel. diff. % |
|
|
GAC-1 |
GAC-2 |
||||
|
N2 (77K) |
Apparent surface area (SBET) |
m²/g |
1397 |
1223 |
-12 |
|
Sorption |
Micropore Surface area (SDR) |
m²/g |
1315 |
1187 |
-10 |
|
SDR/ SBET |
% |
94.1 |
97.1 |
3 |
|
|
External surface area |
m²/g |
82 |
36 |
-56 |
|
|
Total pores volume (VT) |
cm³/g |
1.05 |
0.75 |
-29 |
|
|
Micropores volume (VDR) |
cm³/g |
0.67 |
0.58 |
-13 |
|
|
Mesopores volume (Vmeso) |
cm³/g |
0.38 |
0.17 |
-55 |
|
|
Vmeso/VT |
% |
36.4 |
23.2 |
-36 |
|
|
VDR/ VT |
% |
63.6 |
76.8 |
21 |
|
|
Vmeso/VDR |
% |
57.2 |
30.2 |
-47 |
|
|
Average pore width (L0) |
nm |
2.66 |
2.47 |
-7 |
|
Table 1: GAC-1 and GAC-2 textural parameters applying BET (N2 at 77 K)
Rel. Diff. (%) : Percent of relative difference calculated by Eq.1

In function of the described isotherms and pore size distribution found for both GACs (Figure 6 and Figure 7 respectively), the reference GAC-1 (typically used for rum production and provided by an old supplier) showed not only a higher porosity but also a more developed mesoporosity compared to the new assessed GAC-2. Based on the BET parameters obtained for both GACs which are presented in table 1, GAC-1 showed a much more developed mesoporous structure compared with GAC-2.
Although both GACs had a similar apparent surface area and volume of micropores, a significantly higher external surface area (range of meso-macro porosity), total pore volume and volume of mesopores were found for the reference GAC-1 compared with the GAC-2. The mesoporosity contribution on the total pore volume was 36 % higher in GAC-1 than GAC-2 and 47% higher in the meso/micro porosity ratio (Table 1).
These differences in mesoporosity could lead to a different adsorption/catalytic behavior between both GACs, especially for liquid phase applications (as ethanol refining process for rum production) where the mesoporosity plays a crucial role [1,3,5,11,12].
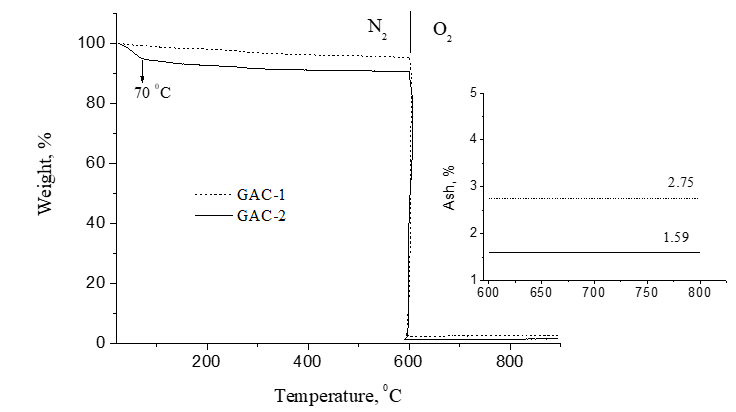
Figure 8 displays the TGA curves in nitrogen/oxygen atmospheres for GAC-2 and GAC-1. GAC-2 released more free water than GAC-1 (about 4.5% of moisture) at 70ºC although both samples were stored into a silica gel desiccator before measurements. From 100 to 180 ºC, the weight loss can be attributed to bonded water (also more in GAC-2). Minor mass loss occurred between 200-600°C (N2 atmosphere) confirming the thermal stability of both GACs. The found ash content is below 3% in both cases which is one of the relevant quality parameters to take into account for GACs applications in food industry.
Table 2 presents a summary of the general characteristics and specifications of GAC-1 and GAC-2 reported in the providers datasheet (the providers are not declared in this work due to ethic and confidentiality restrictions). Both GAC-1 and GAC-2 had comparable general characteristics and specifications, thus suggesting that the adsorption performance in both GACs would be practically the same regarding the typical provider’s criteria/advise.
|
Parameter |
Unit |
Samples |
|
|
GAC-1 |
GAC-2 |
||
|
Iodine Number |
mg/g |
≥ 1000 |
≥ 1000 |
|
Particle size |
mm |
0.8 |
0.8 |
|
Particle size < 0.6 mm (dust content) |
mass % |
≤ 0.5 |
≤ 0.5 |
|
Moisture (as packed) |
mass % |
≤ 5.0 |
≤ 5.0 |
|
Methylene blue adsorption |
g/100 g |
31 |
24 |
|
Total surface area (B.E.T.) |
cm³/g |
1400 |
1300 |
|
Apparent Density |
kg/m3 |
380 |
400 |
|
pH |
- |
neutral |
neutral |
|
Fe (acid extracted) |
mass % |
≤ 0.02 |
≤ 0.02 |
|
Ca (acid extracted) |
mass % |
≤ 0.05 |
≤ 0.03 |
|
Cu (acid extracted) |
mass % |
≤ 0.002 |
≤ 0.001 |
|
Mg (acid extracted) |
mass % |
≤ 0.05 |
≤ 0.05 |
|
Ash |
mass % |
≤ 3.0 |
≤ 1.0 |
Table 2: Summary of the general characteristics and specifications of GAC-1 and GAC-2 reported in the providers datasheet.
However, practical results in rum production process indicates that although important, these general parameters are just the basic preliminary selection criteria. Specific analytical protocols are highly advised in order to predict accurately the behavior of the GACs in the adsorption process. Therefore, complementary methods to provide extra information are needed.
Although important for commercial purposes, the practical evidences now established have demonstrated that these classical/bulk GAC provider’s quality parameters such as iodine number (related with the GAC surface apparent area), methyl blue adsorption and ash content offer insufficient information to correctly select a GAC for the rum production process which in turn directly impact on the sensory quality of the final product.
Table 3 depicts the elemental composition in both GACs by applying digestion-ICP between the assessed GAC-2 compared with GAC-1. The contents of Fe, Ca and Cu are in line with the providers report. Additional elements were determined looking for possible differences. By comparing concentrations in table 3, clearly, GAC-2 exhibit a lower content of the metallic species compared with GAC-1, with significant different concentration of Fe, K, Mg, Mn and Ti. The majority of the metallic species present in GAC-1 such as K, Mg, Fe and Ca are commonly derived from the natural carbonaceous precursor [1-3].
|
Samples |
Elemental composition (mg/g) |
|||||||||||
|
S |
Na |
Ba |
Ca |
Cu |
Fe |
K |
Mg |
Mn |
Sr |
Ti |
Ash (TGA) |
|
|
GAC-1 |
4053 |
2703 |
19 |
402 |
21 |
416 |
414 |
336 |
349 |
5.9 |
98 |
2.75% |
|
GAC-2 |
5018 |
1845 |
18.6 |
278 |
14 |
135 |
132 |
173 |
177 |
5 |
30 |
1.59% |
Table 3: Digestion-ICP elements composition (in mg/kg) and ash content (%) between GAC-1 and GAC-2.
The significant lower content of metallic species could be due to the applied common chemical treatment of acid extraction/washing with (moderate) strong acids (HCl, H2SO4 or H3PO4) in order to reduce the ash content in the GAC (which is in line with the low ash content as found in the TGA results). However, it has been extensively reported [1,2,7,33,34] that the acid pretreatment (with significant influence of type of acid, concentration, contact time and temperature) might modify the GAC surface textural characteristics and chemical functionalities.
On the other hand, the relatively high content of Na, could be also associated to a common pretreatment strategy by leaching with NaOH solutions after the activation (or regeneration) process in order to potentiate a well-developed porous structure in the GAC [30-42]. The NaOH in excess is neutralized with acid and removed from the carbonaceous matrix jointly with the rest of metallic species. The applied pretreatment procedure at industrial scale can vary from one producer to another pursuing to improve the adsorption capacity of their adsorbents. These industrial operations protocols are not completely revealed as they are an important part of the process know-how, thus being strictly confidential.
Sulphur is a major hetero element in both analyzed GACs and can be assigned to different sources: the natural carbonaceous precursor used, chemical pre-treatment with H2SO4 and (mostly) the binder/agglutinant type used to prepare the GAC pellets.
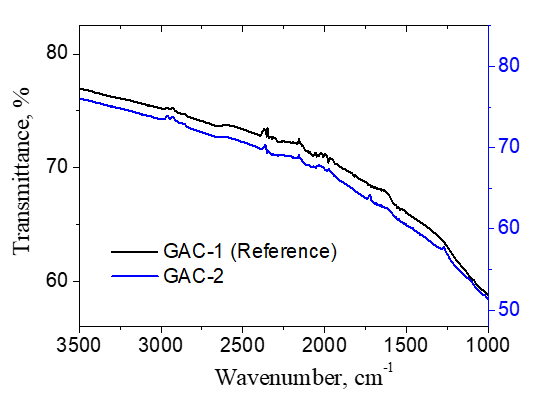
The FTIR spectra of GAC-1 and GAC-2 samples are presented in figure 9 which describes a very similar pattern. No significant/conclusive differences were found between both GACs based on the FTIR analysis.
From the general findings in this study, the textural and chemical characteristics presented in table 1 and table 3 and supported by the provider’s information about GAC-1 and GAC-2 in table 2, digestion-ICP, FTIR and volumetric sorption results, both GACs are quite similar, thus confirming the provider’s suggestion that GAC-2 could be a substitute of GAC-1 without any problem on the adsorption process. However, in despite of the similar BET apparent surface area, the found pore size distribution results revealed a more developed macro-mesoporosity in GAC-1 than GAC-2, which is the most significant difference found between in this preliminary assessment.
According to the combined influence of textural and surface chemistry characteristics of the GAC on the adsorption phenomena, extra analytical methods must be conducted to perform a more complete evaluation of the differences in both GACs in order to elucidate the mechanism of ethanol catalytic conversion on GAC in a rum production process.
Acoustic Emission Method
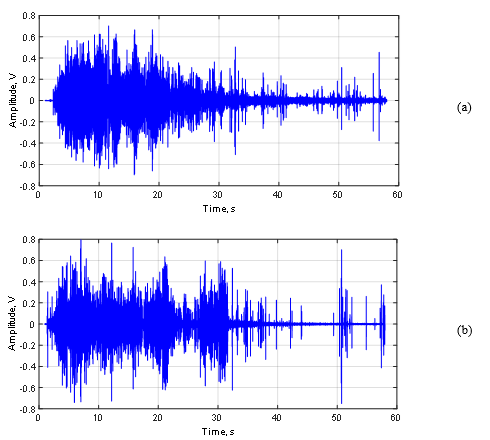
Figure 10 shows the relative amplitude power of the signal (RMS) of the acoustic signal of GAC-1 (a) and GAC-2 (b). Comparing both Figures (a) and (b), it is possible to see remarkable differences between the acoustic signal pattern of the GAC samples. At first instance, for both GAC-1 and GAC-2 similar high and intense signal amplitudes were found, indicating a highly developed porous structure [4,35].
This is a result of a massive production of gas bubbles since the water abruptly removes the air inside the pores and cracks in both GAC structures where the water molecules are capable to get access [4,9,10,29,30]. However, GAC-1 releases the majority gas volume packed in the first 20s followed by a rapid asymptotical decrease, including the presence of randomly and separated “clicks” which are associated with the last bubbles exploding at the water surface. In contrast, GAC-2 describes a quite different acoustic pattern featured by sudden changes in the RMS amplitude in function of the time.
After the first 5s, the GAC-2 amplitude suffers an RMS decrease followed by two late significant gas volume releases at 21 and 31 s with a sudden RMS reduction in between. After the last peak, the GAC-2 almost stops of emitting sound/gas bubbles just “clicking” with the latest bubbles.
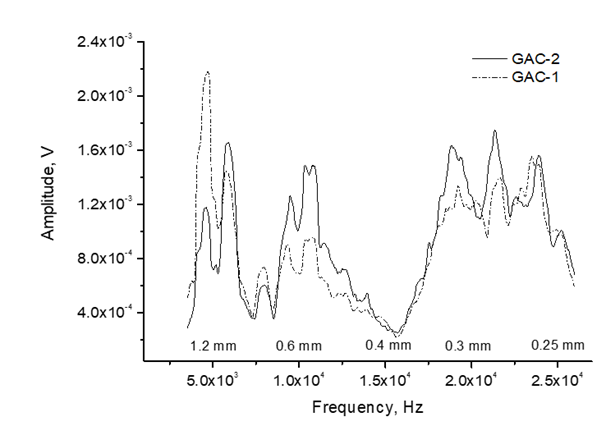
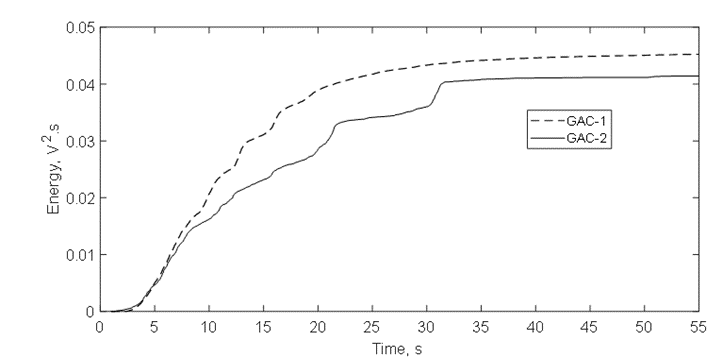
The selected frequency range to study the bubbles acoustic emission process is within the Minnaert’s frequency domain, thus consistent with reported range of bubbles in [4,36]. Therefore, the acoustic signal for both GACs was filtered using a high-pass filter with cut-off frequency at 3.5 kHz, just capturing the sound emitted by the bubbling process and avoiding interferences at lower frequencies associated with atmospheric noise, water injection and GAC particles colliding [4,9,36]. The average curves of triplicated experiments of frequency-bubble diameter distribution, signal envelope and acoustic energy isotherm for GAC-1 and GAC-2 are depicted in figure 11, figure 12 and figure 13 respectively.
Figure 11 depicts the frequency and bubble diameter distribution of the acoustic signal emitted by GAC-1 and GAC-2. Bubbles of 0.25-1.2 mm in diameter were detected in both GACs. Nevertheless, GAC-1 and GAC-2 exhibit a similar contribution of smaller bubbles (higher frequencies) with diameters within the range of 0.4-0.25 mm, GAC-2 slightly higher peaks for bubbles at about 0.32 mm and 0.27 mm.
GAC-2 also presented a higher contribution of bubbles in the diameter range of 0.4-0.6 mm compared with GAC-1. However, a significantly higher peak of bigger bubbles diameter about 1.2 mm was found for GAC-1. Considering the bubbles as spheres, the gas volume contained into a bubble is a cubic function of the bubble radius and therefore, the volume of gas released in a single big bubble (1.2 mm) compared with a single smaller bubble (0.25 mm) is proportional to a cubic powered function to their radius ratio thus contains 110 times more gas.
Based on the results presented in figure 11 and other acoustic parameters discussed further on, GAC-1 can release a high volume of gas in bubbles of higher diameter, thus indicating a wider porous structure compared with GAC-2 which is in line with the found volumetric gas sorption results.
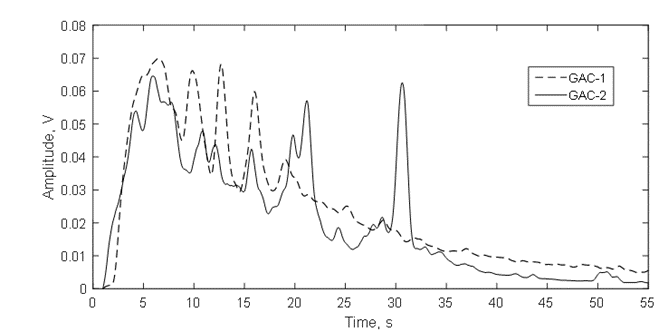
The acoustic signal envelope (Figure12) confirms the discussion of figure 10 about the RMS pattern in function of the time for both GACs and the fast release of gas bubbles presented in figure 11. In the firsts 20s, the multipeak acoustic pattern is observed for both GACs and has been reported for highly developed porosity materials [4,9,10,36]. However, peaks of gas release of GAC-1 are higher than GAC-2 within this period. Additional, after 20 s, two peaks of significant high amplitude around 21s and 31s were observed for GAC-2.
These peaks are associated to a later flow of released gas thus suggesting a narrower porous structure to the water intrusion into the more internal porosity, which in turn creates a resistance for water since the gas escapes out from the same porous structure through the tortuous channels and cracks [4,9,36]. This is also evidenced comparing the acoustic energy isotherms in figure 13. GAC-2 peaks at 21s and 31s create distinctive shoulders on the isotherm trajectory. Cumulative acoustic energy of the acoustic isotherms (Table 5) gives information about the amount of gas released while the signal envelope patterns describe the diffusional way of the water intrusion/gas releasing into the carbonaceous structure [4,9,36].
For the studied GACs, the Langmuir model of isotherm for dissociative adsorption (equation (2)) [36] successfully fitted according to the fitting goodness parameters for both GACs presented in table 4.

|
Langmuir model of isotherm for dissociative adsorption |
|||||
|
Sample |
b |
e(b) |
n |
e(n) |
Adj.R2 |
|
GAC-1 |
5.38 |
0.05 |
2.74 |
0.02 |
0.998 |
|
GAC-2 |
4.56 |
0.11 |
2.32 |
0.12 |
0.986 |
Table 4: Parameters of experimental acoustic energy isotherms data fitted at Langmuir model of isotherm for dissociative adsorption
e(i): error associated to the parameter “i”
According to the parameter “n” (desorption velocity constant) in the dissociative Langmuir model [36], the velocity of air desorption is higher for GAC-1, thus confirming the differences between both GACs observed in figures 10-13. Other fitting models need to be explored in order to further interpret/correlate their parameters with physicochemical events in the complex AC bubbling process.
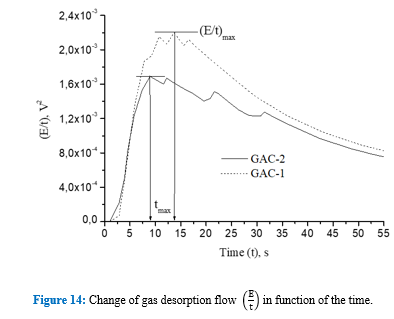
However, another approach of the mathematical treatment to the acoustic energy isotherm data (E vs t) presented in figure 13 can be conducted as follows.
The classical fluid mechanics continuity Eq. 3 describes the correlation between the fluid flow (Qgin m3/s), the volume of fluid (vgin m3), the time (t in s), the flow area ( Awin m2) and fluid velocity (vgin m/s).

On the other hand, it has been reported in [4,9,36,43] that the acoustic cumulative energy is linearly correlated with the amount of gas released in the bubbling process as presented in Eq. 4 where (in V2s/ m3) is a constant acoustic-volumetric conversion coefficient which depends on the parameters used for the acoustic measurement (microphone sensibility, amplifier gain and frequency range) in the specific acoustic setup arrangement.
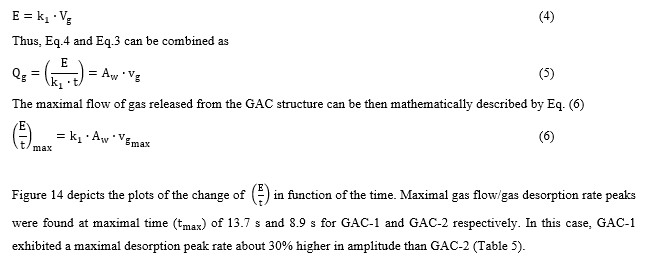
Measurements of gas velocity of bubbles leaving the carbonaceous structure is a challenging and complex phenomenon which is currently under study by our research group of applied acoustics based on fluid mechanics and direct high-speed digital video capturing and computational processing approaches. However, based on the physical meaning of the Langmuir model (Eq.2) the maximal desorption velocity (vgmax) can be expressed in function of the desorption velocity constant “ ” of the Langmuir model as
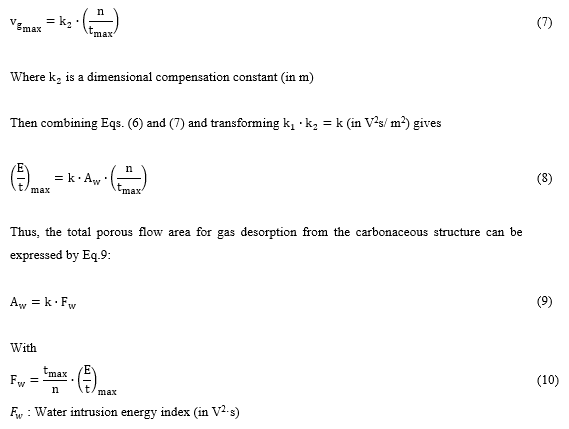
Thus, based on the acoustic emission parameters for both GACs depicted in table 5, by comparing the values of both GACs (% of relative difference), it is possible to confirm that the GAC-2 presents a porous flow area for gas release/water intrusion of 41% lower than the reference GAC-1. The acoustic measurements are consistent and complement BET results based on the percent of relative difference of textural parameters between GACs obtained for both methods (Table 1 and Table 5). GAC-1 has a more developed meso-macro porous structure than GAC-2 which is mainly described by a microporous structure below 2.5 nm of average pores width.
|
Method |
Parameter |
Unit |
Samples |
Rel. diff. % |
|
|
GAC-1 |
GAC-2 |
||||
|
Acoustic |
Accumulative acoustic energy (E0) |
V2·s |
4.5·10-2 |
4.16·10-2 |
-8 |
|
Emission |
Area under signal envelope (SS) |
V·s |
1.33 |
1.16 |
-13 |
|
Maximal desorption rate peak (E\t) |
V2 |
2.2·10-3 |
1.69·10-3 |
-23 |
|
|
Gas desorption rate (n) |
- |
2.74 |
2.32 |
-15 |
|
|
Time of maximal desorption rate (tmax) |
s |
13.7 |
8.9 |
-35 |
|
|
Water intrusion energy index (Fw) |
V2·s |
11·10-3 |
6.48·10-3 |
-41 |
|
Table 5: GAC-1 and GAC-2 acoustic emission parameters
Based on the acoustic pattern observed in figures 11-14 and BET and AE parameters shown in table 1 and table 5 respectively, it can be concluded that GAC-1 presents a more developed meso-macro porous structure than GAC-2.
Preliminary interpretation
In general, the assessment of the catalytic activity of GAC is a complex and challenging task that not only must include the measurement of ash content, apparent surface area, and pore volume contributions but also more dedicated methods to study the presence of functional groups in order to elucidate the reaction mechanisms involved are needed [7]. Textural and chemical analytical methods employed in this study to compare the GACs used in ethanol solution refining process in rum production, suggest a combination of textural and surface chemical characteristics of GAC-2 that allows to catalyse the conversion of ethanol into acetaldehyde-acetal. As mentioned, further studies are required to elucidate the actual contribution of surface and textural characteristics on this catalytic process since acetals are mainly formed in acid conditions. Therefore, rum producers have to be cautious to use acid treated GACs since it has been reported that the acid pre-treatment jointly with the conducted activation process (activation temperature, retention time and atmosphere) could form acid-active sites on the GAC surface which impacts the acetal formation. Therefore, for future studies, the presence of acidic functionalities in GACs should be considered to actually define the catalytic behaviour of the GAC towards different alcohols.
Based on the found evidences on the textural differences of GAC-1 and GAC-2 by applying BET and AE methods, the pore size distribution points to be an important aspect that influence the undesirable organoleptic behavior of the explored new GAC-2 in rum production.
A narrower porosity can efficiently retain in situ formed acetal-acetaldehyde molecules which increases its concentration in the solid phase until saturation.
When the equilibrium is displaced towards desorption, these compounds can then be desorbed from the GAC and can be washed out by the outlet ethanol solution stream causing sensory quality deviation in the refined product after a specific period of the GAC-2 exploitation (about 60 days in this case).
Without exploring other differences between both GACs in terms of the surface chemical characteristics and solid-liquid polarity interaction, results suggest that the wider porosity of GAC-1 could be unable to retain the possible in-situ formed acetal thus avoiding its accumulation on its surface.
However, other possible variables such as: number and type of active sites for in situ acetal formation; amount of in situ formed acetal, GAC adsorption (capacity) of acetal preventing it to be desorbed into the ethanol are crucial to be considered in future studies in order to elucidate the actual catalytic conversion mechanism. In addition, the breakthrough time for the acetal adsorption is an important parameter to be evaluated on sensory quality deviations of the refined ethanol-water solution.
For this preliminary study, BET and AE analyses revealed textural differences between GACs. Although the fundamentals of both methods are somewhat different (BET is based on gas sorption-desorption measures and AE measures the sound emitted during gas desorption), both techniques are consistent and complementary. However, the AE interpretation is still under study due to the extra complexity of the solid-liquid-gas -phase interaction phenomena involved. In that sense, AE method not only provides information about the GAC porosity but also about the surface characteristics of the GAC/liquid interactions.
For a GAC, the AE acoustic pattern represents a specific combination of the GAC characteristics in terms of physical porous structure and surface chemistry. If one or more physicochemical-textural parameters varies, a different acoustic pattern will be obtained.
Thus, regarding the technical advantages of the AE method (rapid, non-destructive, no special reactants and experimental conditions are required) and its sensitivity to detect changes in the GAC characteristics, AE points to be a convenient analytic method to get a rapid assessment of the GAC quality parameters not only for consumers but also for GAC producers. If the AE parameters suffers any deviation from a reference state (like in this case between GAC-1 and GAC-2), then it can be concluded that the quality is not the same and caution is advised to replace the GAC in adsorption operations as its performance could be different. In that case (different AE pattern), extra practical assessment in operation with the GAC must be conducted to confirm the efficiency of the GAC. On the other hand, AE could be useful for GAC producers focused on fast quality control test of the final beverage product.
Conclusions
An investigation to determine the causes of the sensory quality deviation of the refined ethanol solution used for rum production after contact with a GAC was carried out in a pilot scale rum plant research facility. Although important for commercial purposes, general GAC quality parameters such as iodine number total volume of pores, apparent surface area, methyl blue adsorption and ash content just only give preliminary and insufficient information about the adsorption and sensory GAC performance for ethanol solution refining process in rum production.
For this preliminary study, BET and AE analyses revealed textural differences between the GACs used in rum production. GAC-2 and GAC-1 mainly differ in macro-mesopore size distribution which points to be an important aspect that influence the undesirable organoleptic behavior in ethanol refining process of the explored new carbon GAC-2 in rum production.
The GAC selection for rum production must be carefully evaluated by rum specialists as the GAC can catalyze the ethanol conversion into acetaldehyde and its acetal (1,1-diethoxyethane) in fixed bed adsorption systems which in turn produce a significant sensory deviation in the ethanol solution refining process. However, further studies are required to elucidate the contribution of GAC surface and textural characteristics on this complex catalytic process. The technical advantages of the AE method and its proved sensitivity to detect changes in the GAC textural characteristics are suitable attributes to explore its potentialities to get a rapid assessment of the GAC quality parameters not only for rum manufacturers but also for GAC producers and other GAC applications.
Author contributions
Conceptualization, H. Crespo Sariol, and N. del Toro del Toro; data curation, H. Crespo Sariol, N. del Toro del Toro and D. Hernandez Guisado, Jeamichel Puente Torres; formal analysis, J. Yperman, W. Marchal , D. Vandamme and R. Carleer; investigation, H. Crespo Sariol; N. del Toro del Toro; methodology, H. Crespo Sariol, J. Yperman, R. Carleer; resources, D. Vandamme, W. Marchal; writing- original draft, H. Crespo Sariol; writing-review and editing, H. Crespo Sariol, N. del Toro del Toro, J. Yperman, W. Marchal , D. Vandamme and R. Carleer.
Acknowledgments: The authors would like to thanks the VLIR-UOS project between Belgium and Cuba for providing funding and granting the support of the current and future studies.
The authors declare no con?ict of interest.
References
- Marsh H, Rodriguez RF. Activated carbon Elsevier Science & Technology Books. Amsterdam (2006): 89-100.
- Danish M, Ahmad T. A review on utilization of wood biomass as a sustainable precursor for activated carbon production and application. Renewable and Sustainable Energy Reviews 87 (2018): 1-21.
- Cecen F, Aktas O. Activated Carbon for Water and Wastewater Treatment Integration of Adsorption and Biological Treatment Concluding Remarks and Future Outlook (2012).
- Mariño Peacok T, Crespo Sariol H, Yperman J, et al. Improvement of a new acoustic emission analysis technique to determine the activated carbon saturation level: A comparative study. Journal of Environmental Chemical Engineering 8 (2020): 103794.
- Rouquerol J, Llewellyn P, Rouquerol F. Is the BET equation applicable to microporous adsorbents. Stud. Surf. Sci. Catal 160 (2007): 49-56.
- DeSilva FJ. Activated carbon filtration. Water quality products 16 (2000): 56.
- Jasinska J, Krzyzynska B, Kozlowski M. Influence of activated carbon modifications on their catalytic activity in methanol and ethanol conversion reactions. Central European Journal of Chemistry 9 (2011): 925-931.
- Puente Torres J, Crespo Sariol H, Yperman J, et al. X-ray absorption as an alternative method to determine the exhausting degree of activated carbon layers in water treatment system for medical services. Talanta 205 (2019): 120058.
- Mariño Peacock T, Crespo Sariol H, Sanchez RA, et al. Efficiency evaluation of thermally and chemically regenerated activated carbons used in a water cleaning system by acoustic emission analysis. Journal of Porous Materials 28 (2021): 451-469.
- Crespo Sariol H, Yperman J, Brito SÁ, et al. A novel acoustic approach for the characterization of granular activated carbons used in the rum production. Ultrasonics 70 (2016): 53-63.
- Queris O, Pino AM, Villavicencio M. Efecto de la concentración alcohólica sobre la adsorción por el carbón activado de compuestos volátiles presentes en los aguardientes de caña, Bogotá Colombia, in: Proceeding of 6th International Symposium of Food Production SIPAL 14 (2007).
- Roop CB, Meenakshi G. Activated Carbon Adsorption, Taylor & Francis Group, Boca Raton FL (2005): 44–415.
- Hernández O. Science and technologies of distillates beverages. Res. Inst. Food Ind. Cuba 11 (2007): 19.
- Official Journal of the European Union. Information and Notices. English edition (2023/C65/04) 66 (2023): 7-13.
- Del TN, Fong CF, Ayan RJ, et al. Boltzmann-based empirical model to calculate volume loss during spirit ageing. Beverages 5 (2019): 60.
- Crespo Sariol H, Maggen J, Czech J, et al. Characterization of the exhaustion profile of activated carbon in industrial rum “filters” based on TGA, TD-GC/MS, colorimetry and NMR relaxometry. Materials Today Communications 11 (2015): 1-10.
- Bedia J, Ruiz-Rosas R, Rodríguez-Mirasol J, et al. A kinetic study of 2-propanol dehydration on carbon acid catalysts. Journal of catalysis 271 (1): 33-42.
- Szymanski GS, Rychlicki G. Catalytic conversion of propan-2-ol on carbon catalysts. Carbon 31 (1993): 247-257.
- Zhang D, Wang R, Yang X. Effect of P content on the catalytic performance of P-modified HZSM-5 catalysts in dehydration of ethanol to ethylene. Catalysis Letters 124 (2008): 384-391.
- Zaki T. Catalytic dehydration of ethanol using transition metal oxide catalysts. Journal of colloid and Interface Science 284 (2005): 606-613.
- Szymanski GS, Rychlicki G, Terzyk AP. Catalytic conversion of ethanol on carbon catalysts. Carbon 32 (1994): 265-271.
- Suescún OYB, Ramírez MJM, Medina RF. Obtención de acetal a partir de etanol y bentonita ácida como catalizador: una alternativa para la agroindustria sucro-alcoholera. Publicaciones e Investigación 4 (2010): 29-42.
- Zea L, Serratosa MP, Mérida J, et al. Acetaldehyde as key compound for the authenticity of sherry wines: a study covering 5 decades. Comprehensive Reviews in Food Science and Food Safety 14 (2015): 681-693.
- Chen S, Wang C, Qian M, et al. Characterization of the key aroma compounds in aged Chinese rice wine by comparative aroma extract dilution analysis, quantitative measurements, aroma recombination, and omission studies. Journal of Agricultural and Food Chemistry 67 (2019): 4876-4884.
- Pino JA, Tolle S, Gök R, et al. Characterisation of odour-active compounds in aged rum. Food chemistry 132 (2012): 1436-1441.
- Barnes Q, Vial J, Thiébaut D, et al. Characterization of Flavor Compounds in Distilled Spirits: Developing a Versatile Analytical Method Suitable for Micro-Distilleries. Foods 11 (2022): 3358.
- Wang X, Guo W, Sun B, et al. Characterization of key aroma-active compounds in two types of peach spirits produced by distillation and pervaporation by means of the sensomics approach. Foods 11 (2022): 2598.
- The Good Scents Company Information System (2021).
- Crespo Sariol H, Mariño Peacock T, Yperman J, et al. Comparative Study between acoustic emission analysis and immersion bubble-metric technique, TGA and TD-GC/MS in view of the characterization of granular activated carbons used in rum production. Beverages 3 (2017): 12.
- Crespo Sariol H, Mariño Peacok T, Yperman J, et al. Characterization of thermally regenerated activated carbons used in rum production by acoustic emission analysis, N2 and Ar gas adsorption. J Adv Chem Eng 7 (2017): 1-10.
- Mariño Peacock T, Crespo Sariol H, Sánchez Roca Á, et al. Batch and Dynamic Acid Regeneration Evaluation of Granular Activated Carbons Used in Water Cleaning Treatment System. A comparative study between advanced analytical methods and a new Infra-Red Thermographic method. Journal of Environmental Chemical Engineering 11 (2023): 110357.
- Worch E. Adsorption technology in water treatment: fundamentals, processes, and modeling. Walter de Gruyter GmbH & Co KG (2021).
- Van Vliet BM. The regeneration of activated carbon. Journal of the Southern African Institute of Mining and Metallurgy 91 (1991): 159-167.
- Stoeckli F, Daguerre E, Guillot A. The development of micropore volumes and widths during physical activation of various precursors. Carbon 12 (1999): 2075-2077.
- Stals M, Thijssen E, Vangronsveld J, et al. Flash pyrolysis of heavy metal contaminated biomass from phytoremediation: influence of temperature, entrained flow and wood/leaves blended pyrolysis on the behaviour of heavy metals. Journal of Analytical and Applied Pyrolysis 87 (2010): 1-7.
- Mariño Peacok T, Crespo Sariol H, Sánchez Roca Á, et al. Acoustic energy isotherms: An emergent approach for textural characterization of activated carbons. Microporous and Mesoporous Materials 298 (2020): 110045.
- Oppenheim AV. Discrete-time signal processing. Pearson Education India (1999).
- Macías EJ, Roca AS, Fals HC, et al. Characterisation of friction stir spot welding process based on envelope analysis of vibro-acoustical signals. Science and Technology of Welding and Joining 20 (2015): 172-180.
- Matthias T, Katsumi K, Neimark AV, et al. Physisorption of gases, with special reference to the evaluation of surface area and pore size distribution (IUPAC Technical Report), IUPAC & De Gruyter. Pure Appl Chem. 87 (2015): 1051-1069.
- Demir M, Doguscu M. Preparation of porous carbons using NaOH, K2CO3, Na2CO3 and Na2S2O3 activating agents and their supercapacitor application: a comparative study. Chemistry Select 7 (2022): e202104295.
- Lillo-Ródenas MA, Cazorla-Amorós D, Linares-Solano A. Understanding chemical reactions between carbons and NaOH and KOH: an insight into the chemical activation mechanism. Carbon 41 (2003): 267-275.
- Linares-Solano A, Lillo-Rodenas MA, Marco Lozar JP, et al. NaOH and KOH for preparing activated carbons used in energy and environmental applications. International Journal of Energy, Environment and Economics 20 (2012): 59-91.
- Crespo Sariol H, Mariño Peacock T, Sánchez Roca Á, et al. Determination of NaHCO3 content in alka-seltzer tablets: An Acoustic Approach. Austin J Anal Pharm Chem 5 (2018): 1103.


 Impact Factor: * 3.8
 Acceptance Rate: 77.96%
  Time to first decision: 10.4 days
  Time from article received to acceptance: 2-3 weeks