A Quantised Cyclin-Based Cell Cycle Model
Chris Emerson1, Lindsey Bennie1, Niall M. Byrne1, Dermot Green2, Fred Currell3, Jonathan A. Coulter1*
1School of Pharmacy, Queens university Belfast, Belfast, Northern Ireland, United Kingdom
2School of Mathematics and Physics, Queens University Belfast. Belfast, Northern Ireland, United Kingdom
3Department of Chemistry and The Dalton Cumbrian Facility, University of Manchester, Manchester, United Kingdom
*Corresponding author: Jonathan A. Coulter, School of Pharmacy, Queens university Belfast, Belfast, Northern Ireland, United Kingdom.
Received: 14 August 2023; Accepted: 21 August 2023; Published: 06 September 2023
Article Information
Citation: Chris Emerson, Lindsey Bennie, Niall M. Byrne, Dermot Green, Fred Currell, Jonathan A. Coulter. A Quantised Cyclin-Based Cell Cycle Model. Journal of Biotechnology and Biomedicine. 6 (2023): 359-370.
DOI: 10.26502/jbb.2642-91280098
View / Download Pdf Share at FacebookAbstract
Background: Computational modelling is an important research tool with applications in predicting the likely outcome from treatment interventions, to estimating tumour growth characteristics. In silico modelling has been ubiquitously used in cancer research investigating processes such as DNA damage and repair, tumour growth, drug/tumour interactions, and mutational status. On a granular scale, modelling can even be used to better understand the interactions between individual proteins on a single cell basis.
Results: Herein, we present a computational model of the eukaryotic cell cycle incorporating the key proteins involved in cell cycle regulation, namely the cyclin family proteins (cyclin A, B, D and E) and cyclin dependent kinases. Quite uniquely, this model provides a fully quantified output based on western blot and flow cytometry data from synchronous HUVEC cells, enabling determination of the absolute number of cyclin protein molecules per cell. Importantly, this quantitative approach confers more realistic control over threshold transitions between cell cycle checkpoints. The results show that the peak values obtained for the four cyclin proteins are comparable, with cyclin B proteins yielding between 5x10⁶ to 9x10⁶ molecules per cell. Comparing this value against the cytoskeletal housekeeping protein actin (5x10⁸ molecules), illustrates the important functional activity of these cyclin proteins despite expression levels approximately two orders of magnitude lower.
Conclusions: This model advances current approaches by determining absolute cyclin concentrations within an individual cell, with progression through each phase of the cell cycle. Using Boolean variables to represent the genetic network (active/inactive), while integrating continuous variables to represent absolute cyclin protein concentrations, this hybrid approach confers computational efficiency permitting rapid calculation of the protein concentrations, while predicting the influence on cell cycle progression. Subsequent iterations could allow for integration of the cell cycle model into larger tumour models, facilitating the tracking of discrete cells within a developing tumour.
Keywords
<p>Cell Cycle, Boolean, Cyclins, Hybrid modelling</p>
Article Details
Background
Progression of a eukaryotic cell through the cell cycle is controlled by a complex interaction network of two main protein families, the cyclins and cyclin-dependent-kinases (CDKs) [1-4]. These kinases (CDK’s 1, 2, 4 and 6) and cyclins (A, B, D and E) act in unison to regulate the progression between different cell cycle phases (G0/G1, S, G2 and M) that ultimately leads to cell replication and division. Many computational models of the cell cycle have been created using different mathematical approaches, dependent on the network or interactions studied. These include continuous modelling, Boolean modelling or a combination of both, denoted as hybrid modelling [5-7].
Continuous modelling methods have been used to study time-resolved protein concentrations across the different phases of the cell cycle. Conversely, the Boolean method employs a discrete and dynamic modelling approach, resolving protein interactions without the need to consider real-world time relating to each phase [8]. Boolean modelling is mainly used to model a network where each variable exists in one of only two states, either ON/active (defined as 1), or OFF/inactive (defined as 0). This on/off state can be used to crudely model gene expression, but subsequently expanded to encompass protein translation. However, this approach discards the high level of temporal detail achieved using continuous methods. A powerful example of Boolean modelling was reported by Lee et al., (2004), in that the authors discovered that by creating a network of protein interactions, the model would follow a controlled cycle of thirteen unique Boolean states, tightly corresponding to transition within and between cell cycle phases [6]. Importantly, Boolean methods provide highly accurate interaction networks often used to rapidly identify stable states. Conversely, continuous methods provide a direct result between the relative levels of variables being studied [9].
The main benefit of continuous modelling stems from the ability of the model to be solved over any desired time series. Therefore, continuous models have been repeatedly used to study variation in concentration gradients within biological systems, including protein concentration, oxygen diffusion and tumour growth [10–15]. An early study investigating protein concentration variation was reported by Tyson et al., (1991) [15]. The authors developed a model based on the interaction and phosphorylation status of the proteins CDK1 and cyclin-B in yeast cells. The model investigated the formation of maturation promoting factor (MPF), a protein complex that triggers the entry of yeast cells into mitosis, using a single protein complex to model the cell cycle. However, despite the relative simplicity, the model required solving of six simultaneous partial differential equations, resulting in significant computational expense. As such the primary limitation of a pure continuous model is the number of variables and the computational time required to solve the model. In stark contrast, Boolean models can be solved thousands of times, on the order of seconds, permitting rapid data collection.
Hybrid modelling, as the name suggests, represents a combination of both Boolean and continuous models [10]. Hybrid models combine the framework and steps of a Boolean model, however, they also contain unique differential equations which require resolving before progression to the next Boolean step. This approach was adopted by Singhania et al., (2011) who used the stable state Boolean network created by Li et al., (2004) to incorporate differential equations for the three main cyclin proteins controlling cell cycle progression [5]. The model presented within is an extension of the hybrid model, presented by Singhania et al., (2011), combining both approaches: a Boolean network controlling the phases and the continuous equations defining protein expression levels.[5] This approach allows for the rich data outputs achievable from a continuous model, while benefiting from the computational efficiency that a Boolean model gives. However, the model presented here differs from the Singhania model in two distinct ways. Firstly, incorporation of cyclin-D allows for a more realistic control of the initial entry into the cell cycle. Secondly the model takes account of the cyclin molecules as discrete entities rather than continuum quantities. Accounting for the proteins in this way allows the stochastic features of the cell cycle to be determined through the use of countable molecules rather than just manually incorporated. Additionally, the use of Boolean networks also allow for differential equations to be solved analytically for any period of time during a single Boolean phase. This dramatically reduces the computational time for the cell cycle, permitting collection of a high volume of outputs results in a matter of seconds.
Cell population synchronisation is a necessary strategy when studying specific phases of the cell cycle. There are numerous experimental strategies used to synchronise cell populations, these include physical separation using FACS (fluorescence-activated cell sorting), chemical blockades, nutrient depravation and contact inhibition.[16–19] To allow comparison between biological and computational data, chemical based synchronisation offers the cleanest and most reproducible synchronisation approach. Within this study the drug nocodazole was used as it acts as a rapidly-reversable inhibitor of microtubule polymerisation, stalling the cycle at the G2/M checkpoint.[20] Nocodazole is a synthetic tubulin-binding agent with antineoplastic activity. Binding to beta-tubulin, nocodazole disrupts the microtubule network required for chromosomal rearrangement during mitosis.[21] As such, cells treated with nocodazole fail to enter mitosis with cells accumulating at the G2/M checkpoint.[22]
In the current study, we have developed a hybrid system incorporating continuous and Boolean variables to model the coordinated interactions of CDKs and cyclins within the eukaryotic cell cycle. By directly comparing the model to biological data collected from a synchronised human umbilical endothelial cells (HUVEC), we aimed to test model accuracy and improve the quality of outputs by quantising it to outputs as tangible units of protein molecules per cell.
Methods
Computational model
The core of this model is the Boolean network of the main genes responsible for cell cycle regulation. A schematic of this network can be seen in Figure 1. This schematic shows the interaction network of the Boolean variables and the alternating regulatory effects which they confer upon the continuous variables represented by cyclins A, B, D and E. The values which
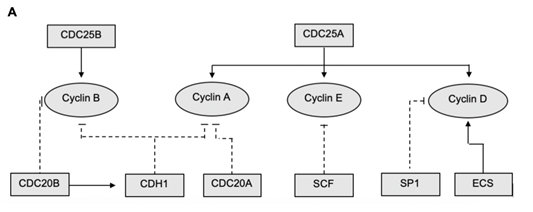
Figure 1: Schematic representation of the interaction network for the promotion and degradation of cyclins and cyclin dependent kinases. Flat ended, dashed lines represent suppression and arrows represent up regulation. Rectangular boxes denote Boolean variables while circles representing continuous variables within the code
the Boolean variables have in each cell phase are given in Table 1. The simulation was solved over 5000 cycles of independent, individual cells. These cells were all initialised with the same concentration of cyclin, cyclin A = B = D = E = 1. However, they were run through 10 cycles before the 11th cycle was recorded. This provides heterogeneity, as observed in a normal proliferating population, while remaining within the constraints of the model.
Table 1: Boolean variables of key proteins as they change throughout cell cycle phases with corresponding thresholds for each phase
At the beginning of each phase new Ks and Kd values are calculated for each cyclin based on Equation 2 and the values from Table 2 as the simulation starts with all values at a base level 1. The model progresses from one phase to the next when the correct threshold conditions are met. For transition from G1 to S-phase, the correct thresholds of Cyclin E and Cyclin A must be met. S-phase is both time dependent and cyclin E degradation dependent, while G2 and mitosis are governed by cyclin A and cyclin B respectively. In G1 the model will solve the time duration required to accumulate sufficient levels of cyclin E. Once this time is calculated, it is used to determine the required increase or decrease in expression levels of the remaining three cyclins. Cyclin E concentrations at the end of G1 will then become the new initial concentration for S-phase, with new K rates also determined. This process repeats until the model has solved equations for all the transitions through the cell cycle, reaching the end of telophase. During telophase, the model will divide the final concentrations of cyclins by two, preparing for cytokinesis, then add a randomised error which will become the new initial condition for the beginning of the next run. After quantification the variability in the thresholds were converted from the initial 10% error to be with N representing the number of strands of the protein. This dependence arises from Poisson statistics for the counting of discrete entities. Furtehr details of the complete continuous and analytical equations used in the model are provided in supplementary equations 1- 17.
|
Cyclin A |
Cyclin B |
Cyclin E |
Cyclin D |
||||
|
KsA |
3.85E5 |
KsB |
9E5 |
KsE |
5000 |
KsD |
1.2E6 |
|
KsA cdc25A |
4.62E5 |
KsB cdc25B/C |
2.1E6 |
KsE cdc25A |
5E5 |
KsD cdc25A |
8.4E6 |
|
KsA cdc25B/C |
1.54E6 |
KdB |
0.2 |
KdE |
0.02 |
KdD |
0.802 |
|
KdA |
0.2 |
KdB cdc20B |
1.2 |
KdE SCF |
0.5 |
KdD myc |
0.8 |
|
KdA cdh1 |
1.2 |
KdB cdh1 |
0.3 |
* |
* |
||
|
KdA cdc20A |
1.2 |
* |
* |
* |
|||
Table 2: Values for the synthesis and degradation in the model.
Cell culture and Synchronisation
Human umbilical vein endothelial cells (HUVEC) were cultured in vascular cell basal medium (ATCC) supplemented with the endothelial cell growth kit-BBE (ATCC), maintained at 37°C in a humidified incubator at 5% CO2. HUVECs were seeded at a density of 3 x 10⁵ in a T25 flask (Nunc, ThermoFisher Scientific). Cells were seeded for 24 h prior to nocodazole (50 µg/mL; Sigma Aldrich) stalling at 37oC/5% CO2. After stalling, cells were washed twice with sterile PBS (phosphate buffed solution; Gibco, ThermoFisher Scientific) then incubated in fresh media for times ranging from 2 h to 28 h. After a predefined period, cells were harvested and cell counts performed using a Coulter Counter (Beckman Coulter). The remaining cell suspension was centrifuged (250 rcf), forming a pellet, which was stored at -80oC until processed for western blot.
Cell lysates
For cell lysate preparation, cell pellets where treated with 100 µL RIPA solution (Thermo Scientific) containing cOmplete™ Protease Inhibitor Cocktail (Sigmal Aldrich). Cell pellets were left on ice for 30 min, vortexed every 10 min, before being returned to -80oC for 10 min. Cell lysate protein levels were then standardised using cell counts via dilution using purified H2O. Normalised samples were combined in equal parts with 2x Laemmli buffer (Sigma Aldrich) prior to denaturing at 95oC for 10 min. Prepared samples were stored at -20oC until required.
Western Blot
For Western blot analysis, 20 µL of cell lysate were loaded into each well. Samples were separated by molecular weight via electrophoresis through a 4% – 12% bis-tris gel (ThermoFisher Scientific) at 120 mV for 1.5 h. Once separated the proteins where transferred to a nitrocellulose membrane (life sciences) at 35 mV for 2 h. Following transfer, membranes were blocked in 3% weight per volume (w/v) skim milk dissolved in PBS for 1.5 h at room temperature. When blocked, membranes where treated overnight at 4oC with primary antibodies for cyclin A, B, E and D (1:5000 – ThermoFisher). Membranes were then washed three times in 0.1% tween 20 in PBS to remove excess primary antibody before incubation in anti-rabbit secondary antibody (1:5000 – Abcam) for 1 h at room temperature. Antibody chemiluminesence signals were detected using the G-box (Syngene) system. Following image acquisition, densitometry was carried out using the Fiji extension of the image-J software. This data was collected using the average pixel colour intensity, with 0 being black and 255 white. To ensure consistency between each channel the area measured was kept constant. Results were averaged over three independent experiments.
Flow Cytometry
Cells where trypsinised at various time points to study the release of cell cycle stalling from nocodazole (90 min, 120 min, 150 min, 180 min, 210 min and 240 min). Cells were fixed in 70% ethanol for 2 h at 4oC. For flow cytometric analysis, cells were washed in PBS before incubation with propidium iodine (PI – Sigma) solution (50 µg/mL PI with 1% RNAse) overnight at 4oC. A minimum of 10,000 cells per sample were analysed using a BD Accuri C6 Plus system. Analysis was performed using the BD Accuri C6 Plus software to exclude debris and doublets and to determine distribution of cells in G0/G1, S-phase and G2/M.
Toxicity Assay
Cells were seeded at a density of 1.2 x 10⁴ cells per well in a 96 well plate, cultured as above and treated with increasing concentrations of nocodazole (25, 50, 100, 150 and 200 µg/mL) dissolved in media. After 24 h, nocodazole treated cells were washed with PBS and assayed for toxicity using AlamarBlue (ThermoFisher). A 10% (v/v) solution of alamar blue was prepared in HUVEC cell medium and added to each well. Plates were incubated for 4 h at 37oC before cell viability was assessed using fluorescence (excitation, 560 nm; emission, 590 nm) measured by a FLUOstar plate reader (BMG labtech, GE).
Results
Nocodazole cytotoxicity in HUVEC cells in vitro
Within a cell population, multiple single cells progress through the phases of the cell cycle at different times; in order to ensure protein quantification is mapped to cell cycle phase for the model, all biological experiments were performed on synchronised cell populations. This was achieved using the anti-mitotic, small molecule compound nocodazole. The biochemical impact of nocodazole is well understood, blocking spindle formation and impeding mitosis. However, this effect is conferred in a strong concentration-dependent manner [22]. In order to ensure that drug-induced effects did not influence data outputs, characterisation of the phenotypic effects following treatment with increasing concentrations of nocodazole was performed. Cell survival following nocodazole treatment was normalised against untreated cells and plotted as a surviving fraction. Figure 2 demonstrates a clear dose-dependent toxicity of nocodazole up to 200 µg/ml. The International Organization for Standardization (ISO) standards 10993-5 define multiple categories of cytotoxicity.[23] Direct cell death is defined as the following: 20% - 40% reduction in survival weakly cytotoxic; 40% - 60%, moderately cytotoxic; >60%, strongly cytotoxic. Applying these conventions, nocodazole exhibits weak cytotoxicity at all concentrations tested with a 37% reduction in survival relative to untreated controls at the highest concentration (200 μg/ml) tested.
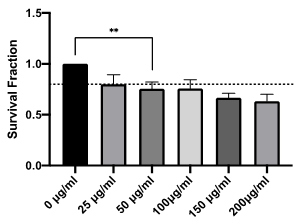
Figure 2: Concentration-dependent toxicity of nocodazole in HUVEC cells in vitro. Survival fraction of HUVEC cells treated with increasing concentrations of nocodazole (25 µg/mL - 200 µg/mL) relative to control (0 µg/ml). Drug concentrations in excess of 50 µg/mL reduced survival by >20% (dashed line), representing weak direct cytotoxicity as defined by ISO 10993-5. Results shown are mean ± standard error of the mean (SEM) from three independent experiments. Statistically significant between groups was determined using a one-way ANOVA (** p=0.0032).
Nocodazole induced G2/M checkpoint stalling and synchronisation in HUVEC cells
Following the characterisation of nocodazole toxicity in HUVEC cells, G2/M stalling efficiency as both a function of concentration and time were assessed using flow cytometric analysis of cell cycle phase using propidium iodide DNA staining (Figure 3 A&B). 50 µg/ml of nocodazole significantly increased the stalled (G2/M) population in HUVEC cells, while concentrations in excess conferred no additional advantage to cell stalling (Figure 3A). Taken together with the cytotoxicity data (Figure 2), 50 µg/ml was selected as an appropriate cell stalling concentration for all subsequent experiments. We next examined the impact of nocodazole treatment cessation on cell cycle progression in HUVEC cells. This data provides the time offset or the t=0 value (time correction factor) when drawing comparisons between the in vitro data and the in silico data. Similarly, cell cycle stalling (G2/M) was observed in HUVEC cells immediately following treatment cessation (Figure 3B). The proportion of cells in G2/M persisted between 1.5 and 3.5 h post treatment cessation, likely indicating that cells successfully stalled at the beginning of mitosis were yet to undergo cytokinesis. Conversely, 4 h post treatment cessation, there was a significant reduction in the proportion of cells in G2/M, with ~70% of the cell population transitioning through mitosis into the G1/G0 phase.
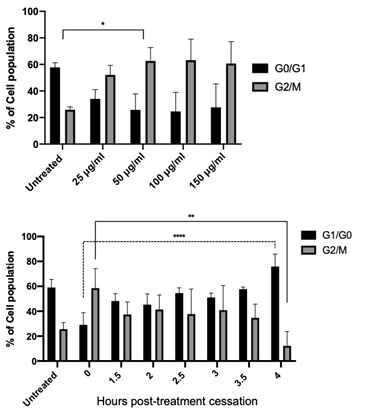
Figure 3: G2/M checkpoint stalling and cell cycle synchronisation by nocodazole. Flow cytometry cell cycle analysis of HUVEC cells using propidium iodide (PI) staining; percentage (%) of cells in G0/G1 and G2/M phases determined following cell debris and doublet exclusion. (A) Treatment of HUVEC cells with increasing concentrations of nocodazole (25 µg/mL - 150 µg/mL) resulted in significant cell cycle stalling (G2/M) at treatments >50 µg/mL. (B) Time post nocodazol treatment (50 µg/mL) cessation in HUVEC cells, resulting in a time-dependent release of cells from G2/M stalling. 4 h post-release ~75% of cells have transitioned out of the G2/M checkpoint resulting in significant cell cycle syncronisation in G0/ G1. Results shown are mean ± SEM from three independent experiments. Statistical significant between groups was determined using a one-way ANOVA (*p<0.05, ** p<0.01, **** p<0.0001).
This result provides the aforementioned time correction between the computational model and measured cyclin protein levels. The rapid change of cell cycle distribution within the first 90 min is attributed to approximately 20% of cells already in the G2/M phase at the point of nocodazole treatment (data obtained from the untreated control population). This result allows for a more in-depth framing of how cells progress through the cell cycle when translating back to the model. Figure 2B indicates that ~75% of the cell population is released into the cell cycle in sync, meaning that when interpreting the subsequent in vitro data that the quantised result will be applicable to only 75% of cells. The 25% of cells not synchronised are assumed quiescent cells and therefore, have a greatly reduced cyclin protein production.
Quantification of time-dependent cyclin expression in HUVECs post synchronisation
Having successfully synchronised HUVEC cells, the next step involved collecting the biological data used for quantification of the hybrid model. To fully quantify cyclin A, B, D and E expression levels in cells, standard curves of known concentrations of recombinant cyclin proteins were generated from western blot data (Figure 4), with densitometry analysis of cyclin protein expression plotted against known cyclin protein mass (ng).
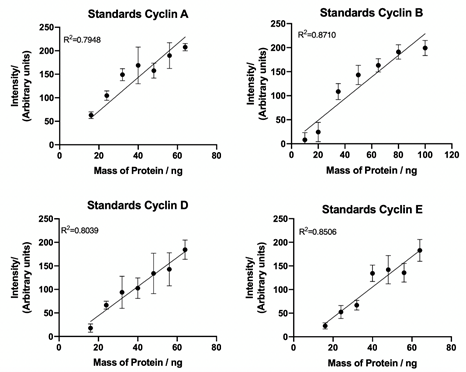
Figure 4: Cyclin A, B, D and E standard curves. Quantification of western blot detection of cyclin A, B, D and E from recombinant cyclin proteins using densitometry plotted against known protein mass (ng). Lines of best fit and correlation coefficient (R2) demonstrate a linear relationship between sample concentration and target band intensity. Data represents mean ± SEM from three independent experiments.
Consequently, whole cell lysates from HUVEC cells were collected at various time points (2 – 28 h) post nocodazole treatment. This period was selected to ensure HUVEC cells had completed one transition through the cell cycle and as such captured time-dependent cyclin expression. Western blot analysis was performed on cyclin A, B, D and E and expression normalised to GAPDH loading controls for each time point (Figure 5). Normalised cyclin expression appears to vary across the experiential timeframe with elevated cyclin D and cyclin E expression observed early in the timeframe following cell cycle release (5-7 h). Conversely, cyclin A and cyclin B expression is elevated later in the experiential timeframe (18-24 h).
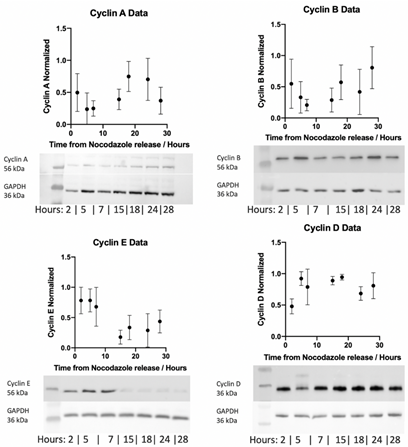
Figure 5: Western blot detection of cyclin A, B, E and D in HUVEC cells at 2, 5, 7, 15, 18, 24 and 28 h post cessation of nocodazole treatment following 20 µl (40 µg whole cell lysate) protein loading. Relative levels of cyclins to GAPDH calculated by densitometry and plotted as mean ± SEM from three independent experiments. Representative images are shown below each plot for cyclins and GAPDH loading control.
Computational modelling of cyclin expression within the cell cycle
The computational model used in this study is based on the hybrid model created by Singhania et al., (2011), modified to include a fourth cyclin responsible for cell cycle regulation, cyclin D 5. This model can be solved in two ways; user-defined time intervals, or providing outputs only at the transition between phases of the cell cycle. For this study we defined the time intervals, providing a more accurate time series to compare against the collected HUVEC biological cyclin expression data. To calculate the concentration of protein within a single phase, three parameters are needed; the initial concentration, the rate of synthesis and the rate of degradation. The initial concentration is that when the cell enters each phase of the cell cycle. The rate of synthesis is independent from protein concentration and is controlled by external factors such as gene expression, while the rate of degradation is dependent on the current level of the protein. This allows for the equations of protein concentrations to take the following form;

Equation 1: Allows for the concentration of cyclin at a time, t, to be calculated, where to is the time at the start of the phase, i denotes cyclins A,B,E or D, Ks is the rate of protein synthesis and Kd is the rate of protein degradation.
K rates are variables that change as the model progresses thorough the cell cycle. The form taken by K is dependent on the Boolean variables that are either active or inactive during each phase. Their base forms are

Equation 2: Where I donates the cyclin which k is paired with, A B D or E. k0 is the base level of the protein and “kα/γ” pair with the Boolean variables that are active in the current cell phase.
As the Boolean values change in every new phase of the cell cycle the Ks and Kd values are re-calculated at the start of each phase. This full Boolean network is shown in the methods section in Table. 2. The simulation produces a clear time series of the levels of cyclin proteins expressed in each distinct phase of the cell cycle. Figure 6. shows the four time series normalised to their respective highest concentration. This figure also shows the overlay of the time series obtained from cell based experiments shown in Figure 5. Note that as previously stated, the computational model defines time zero as progression out of G0 in the cell cycle, while the biological measurements are based on G2/M stalling via nocodazole treatment, defining time zero as the start of mitosis. Thus, before direct comparisons can be drawn a correction factor for the time from nocodazole release and to complete mitosis must be applied. This factor was determined as 4 h from the release data presented in Figure 3. The application of this correction and overly of the two data sets can be seen in Figure 6.
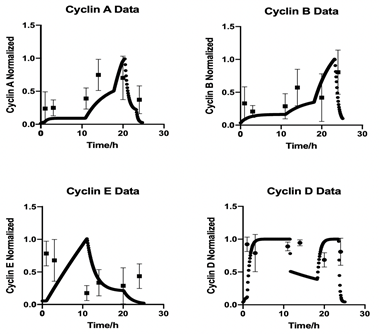
Figure 6: Time resolved cyclin expression in computational modelling and western blot data. Western blot detection of cyclin A, B, E and D in HUVEC cells post cell synchronisation was overlaid with simulation data. The western blot data was corrected for the 4 h lag observed following nocodazole cessation and cell cycle synchronization. Both datasets have been normalised to allow a direct comparison.
The equations from Figure 4 of the standard curves are then applied to the results from Figure 5 to calculate the total amount of cyclin protein in each sample, as a function of absolute cell number, allowing the quantisation of protein molecules per cell throughout specific phases of the cell cycle. With this definitive information, the computational model can be promoted from calculating a relative level of cyclin proteins to calculating the actual number of protein molecules per cell. Using the molecular weight of the cyclin proteins (cyclin A, 52 kDa; cyclin B, 48 kDa; cyclin E, 50 kDa; cyclin D 34 kDa [24]) and the concentrations of the recombinant proteins used to generate the standard curves, the number of protein molecules per cell could be calculated varying from 1.2E11(10 ng) to 1.2E12 (100 ng). The capabilities of such quantised simulations will allow for ad hoc threshold errors to be more accurately controlled due to these discrete countable systems having an error of , where N represents the number of molecules. This reduction in error allows for strengthened control over the model as a whole, but also provides insight into the protein levels required to transition through each phase of the cell cycle. With the computational model fully quantised, new simulated data was calculated and shown in Figure 7. With the quantised code cyclins A, E and D have comparatively similar peak values of 5E6 molecules per cell with cyclin B expressed to the highest level, yielding approximately 9E6 proteins per cell. However, the total number of proteins per cell has been calculated as approximately 2E9 meaning that while regulatory proteins are incredibly important to the normal functioning of a cell, they only account for between 0.25 – 0.45% of the total protein content when expressed at their highest concentration.
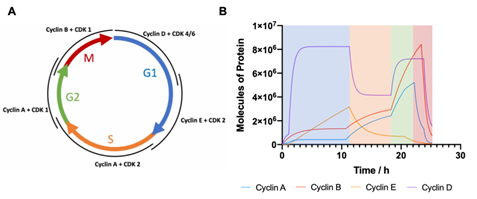
Figure 7: Computational modelling of cyclin expression in eukaryotic cell cycle (A) Schematic depicting interacting cyclin and CDKs responsible for each cell cycle phase (G1 represented in blue; S in orange; G2 in green; M in red). (B) Computational output of the cell cycle model showing quantified cyclin protein levels over time as cells transition through respective cell cycle phases. Cell cycle phase has been coloured coded to correspond with schematic in A.
Discussion
Gene and protein networks control the physiological behaviour of every living cell, including the cell cycle which is primarily regulated through the expression of cyclins and CDKs. While independently inactive, these regulatory molecules form activated complexes that progress cells through the different phases of the cell cycle (G0/G1, S, G2 and M), which ultimately lead to cell DNA replication and division. Computational modelling of these networks could provide valuable insights into the molecular mechanisms of the cell cycle. Typically in silico models are presented using relative protein expression levels, failing to generate absolute values which could prove meaningfully when compared against real world measurements. Here, we present a model which resolves absolute cyclin concentrations within an individual cell, as it progresses through each phase of the cell cycle. The time dependent biological parameters for this model were obtained from HUVEC cells synchronised using the anti-mitotic small molecule drug nocodazole. This approach provided fairly uniform cell cycle release characteristics upon drug removal. Nocodazole induced cell cycle stalling plateaued at 50 µg/ml with ~60% of cells stalled in G2/M. Given that HUVEC cells are non-transformed endothelial cells retaining contact inhibition, we hypothesis, that the remaining cells are likely non-cycling, sitting within G0 and accounting for the observed G2/M plateau.[25] As such, features like contact inhibition highlight the importance of ensuring equivalent confluence between variable in vitro cell treatment groups. The absolute values obtained for individual protein molecules during each phase of the cell cycle appears reasonable when compared against total protein concentration for cell lines such as HeLa and U20S cells; where the total number of proteins per cell were reported on the order of 109 molecules per cell[26]. Based on our experimental measurements, the levels of cyclin proteins, even at the most concentrated levels was in the order of 106 molecules per cell. In comparison to actin, which is ubiquitously expressed in all eukaryotic cells, this measurement is in the region of 2-orders of magnitude lower, with approximately 5 x 10⁸ actin proteins expressed per cell[27]. This clearly demonstrates that while these regulatory proteins are invaluable to the cell, they convey significant biological effects at comparatively low concentrations. In general, the computational outputs of the model show good overall alignment with the experimental protein expression data. This suggests that our hybrid model can provide an accurate output of protein concentration through different phases of the cell cycle. Furthermore, this output also facilitates the study of rates of translation for these proteins. The largest variation in expression was observed with cyclin B, increasing by 4 million protein molecules over a 5 h time span. As the cyclin B protein is comprised of 433 amino acids, with a translation rate of ~10 aa/s, the approximate time for synthesise of one cyclin B protein would equate to 43.3 seconds. Therefore, to facilitate the observed rapid change in overall protein expression levels we estimate that approximately 9500 ribosomal sites are required to be dedicated to the translation of cyclin B mRNAs.[28,29] Importantly, the strong temporal agreement between the computational predictions and cyclin expression in the biological data confirm the accuracy of the time scale of the model. As previously outlined, a significant benefit of the computationally non-intensive model presented herein, is the ability for expansion. This could include incorporation of processes such as DNA damage repair or apoptosis, modelling the main molecular components of cell cycle arrest including p53 and p21; these pivotal proteins could be incorporated into to the base Boolean network in Figure 7, thereby expanding the functional relevance of the model[30,31]. Indeed, our hybrid model could be expanded further following incorporation into a more comprehensive model, for example a tumour vasculature growth model, given that it is based on the proliferation of vascular forming endothelial cells, allowing for variation in the cell cycle of each individual cell rather than being modelled according to set time steps.[32] Either of these applications would retain the ability to generate protein molecule quantification, while increasing the usefulness of the existing model. Additionally, the ability to have a computational model that accounts for the study of the full cell cycle while incorporating DNA damage repair and arrest could prove highly valuable in the study of novel cancer therapeutics and the normal tissue response, providing rationalised biological experiments that could limit unnecessary animal use, helping to refine pre-clinical study design in keeping with NC3R guidelines.[33] The primary limitation of this model is that the experimental data used to parametrise the model is based on the proliferation characteristics of normal endothelial cells (HUVEC). Incorporating flexibility to adapt between both tumour and non-tumour could prove highly beneficial, particularly if combined with the ability to model radiation damage for example.
Conclusions
This work presents a comparatively computationally light hybrid model, comprising key features of both continuous and Boolean models. We demonstrate how biological measurements can be used to transform semi-quantitative outputs into a fully quantised model, suggesting means by which these dual functioning models could be expanded from a single cell, single process (i.e. cell cycle) model to a more sophisticated multicellular tumour microenvironment. While at a very early stage, this work provides a foundation for an accessible model with predictive capabilities, parametrised by existing real world data.
Continuous Equations
Initially the model was created to calculate the trajectory of three cyclin proteins as the cell progressed through the cycle, cyclins A, B and E, with the fourth cyclin, D incorporated into the model in the same form. The change in expression level of all cyclin proteins are calculated in the same manner; requiring the initial concentration, the rate of production and the rate of degradation;

Equations 1-4. Showing the continuous equations for the level of cyclin protein expression, where Ks rates are for synthesis and Kd degradation and t is the initial time. dt is the time step that the equation will be solved over.
In these equations the Boolean variables influence the equations through both Ks and Kd rates, with the calculation for these shown in equations 5-12:
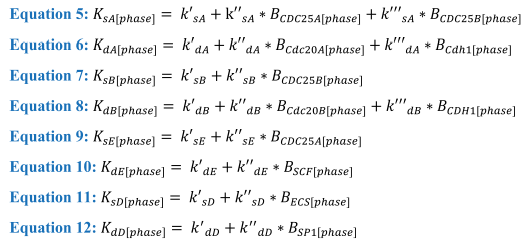
Equations 5-12. Calculations behind each of the K rates for synthesis and degradation of the cyclin proteins where the B variables are Boolean and will change as the cell passes through each phase while k is the rate associated with the corresponding gene.
Analytical Equations
As the model is based on noncoupled ODE’s, it can be solved analytically. The connection between the four different equations arises from the Boolean network and the phase transitions (Equations 13-16). To solve analytically the model must first be integrated with respect to time, this allows the calculation of protein levels at any desired time, while in the same phase. These equations are shown below;
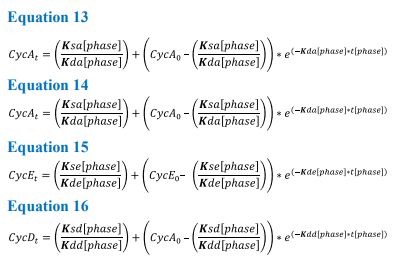
Equations 13-16 The K rates involved in these analytical solutions are the same as those in the continuous model, with t[phase] representing the time period until the threshold is met and the model progresses to the next phase
Solving these equations analytically requires the variables (k rates) to be constant for each phase of the cycle. Therefore, as the values for K rates change in response to cell cycle progression, protein values can only be calculated for any desired time point within the corresponding phase. To allow the model to transition between the phases, protein values detailing concentration at the end of one phase are used as the initial values for the next, e.g. CycA0 phase = CycATPhase1. Each transition allows the equations to be changed and the model progresses through the cell cycle. Once the model has reached the end of M phase, values for cyclin levels within the cell are divided between the two daughter cells.

Equation 17. Showing the rearranged form of the analytical equations allowing for the time taken for a cyclin protein to reach threshold levels. Where i = cyclin A, B, E or D, and Cyci t is the threshold for leaving the current phase
Acknowledgments
Not applicable
Conflicts of Interest
The authors declare no conflicts of interest
Funding
Department for the Economy, Northern Ireland
Authors' contributions
CE developed the model, carried out all the biological work to validate the model and produced the initial manuscript draft; LB provided wet laboratory and tissue culture support; NB read and revised the manuscript; DG was the secondary project supervisor providing computational modelling support; FC conceived the original idea for the computational model and provided feedback on manuscript drafts; JC was primary supervisor providing support with biological validation, manuscript design and editing. All authors read and approved the final manuscript.
References
- Jackman MR, Pines JN. Cyclins and the G2/M transition. Cancer Surv. 29 (1997): 47-73.
- Morgan DO. Principles of CDK regulation. Nature 374 (1995): 131-134.
- Yang R, et al. Functions of cyclin A1 in the cell cycle and its interactions with transcription factor E2F-1 and the Rb family of proteins. Mol Cell Biol 19 (1999): 2400-2407.
- Boxem M. Cyclin-dependent kinases in C. elegans. Cell Div 1 (2006): 6.
- Singhania R, Sramkoski RM, Jacobberger JW, et al. A hybrid model of mammalian cell cycle regulation. PLoS Comput Biol 7 (2011).
- Lee W Bin, Huang JY. Robustness and topology of the yeast cell cycle Boolean network. FEBS Lett 583 (2009): 927-932.
- Gerard C, Tyson JJ, Coudreuse D, et al. Cell Cycle Control by a Minimal Cdk Network. PLoS Comput Biol 11 (2014): 1-27.
- Chen L, Kulasiri D, Samarasinghe S. A Novel Data-Driven Boolean Model for Genetic Regulatory Networks. Front Physiol 9 (2018): 1328.
- Ay A, Arnosti DN. Mathematical modeling of gene expression: a guide for the perplexed biologist. Crit Rev Biochem Mol Biol 46 (2011): 137-151.
- Rejniak KA, Anderson ARA. Hybrid models of tumor growth. Wiley Interdiscip. Rev Syst Biol Med 3 (2011): 115-125.
- Aleksandrova AV. et al. Mathematical and Experimental Model of Oxygen Diffusion for HepaRG Cell Spheroids. 160 (2016): 857-860.
- Watanabe Y, Dahlman EL, Leder KZ, et al. A mathematical model of tumor growth and its response to single irradiation. Theor Biol Med Model 13 (2016): 6.
- Leenders GB, Tuszynski JA. Stochastic and deterministic models of cellular p53 regulation 3 (2013): 1-16.
- Novák B, Tyson JJ. A model for restriction point control of the mammalian cell cycle. 230 (2004): 563-579.
- Tyson JJ. Modeling the cell division cycle: cdc2 and cyclin interactions. Proc Natl Acad Sci USA 88 (1991): 7328-7332.
- Merrill GF. Chapter 13 Cell Synchronization. in Animal Cell Culture Methods (eds. Mather, J. P. & Barnes, D. B. T.-M. in C. B.) 57 (1998): 229-249.
- Davis PK, Ho A, Dowdy SF. Biological Methods for Cell-Cycle Synchronization of Mammalian Cells. Biotechniques 30 (2001): 1322-1331.
- Vassilev LT. Cell Cycle Synchronization at the G2/M Phase Border by Reversible Inhibition of CDK1. Cell Cycle 5 (2006): 2555-2556.
- Ibrahim SF, van den Engh G. Flow Cytometry and Cell Sorting. In: Kumar A., Galaev I.Y., Mattiasson B. (eds) Cell Separation. Advances in Biochemical Engineering/Biotechnology 106 (2007).
- Kuhn, M. The microtubule depolymerizing drugs nocodazole and colchicine inhibit the uptake of Listeria monocytogenes by P388D1 macrophages. FEMS Microbiol Lett 160 (1998): 87-90.
- National Center for Biotechnology Information. PubChem Database. Nocodazole, CID=4122, https://pubchem.ncbi.nlm.nih.gov/compound/Nocodazole (2019).
- Blajeski AL, Phan VA, Kottke TJ, et al. H. G(1) and G(2) cell-cycle arrest following microtubule depolymerization in human breast cancer cells. J Clin Invest 110 (2002): 91-99.
- ISO 10993-5 Biological evaluation of medical devices - Part 5: Tests for cytotoxicity?: in vitro methods. 3rd ed. International Standard ISO 10993-5. Geneva , Switzerland: International Organization of Standardization (2009).
- Carrieri FA, et al. CDK 1 and CDK 2 regulate NICD 1 turnover and the periodicity of the segmentation clock (2019): 1-22.
- Suzuki E, et al. Reentry into the Cell Cycle of Contact-inhibited Vascular Endothelial Cells by a Phosphatase Inhibitor. 275 (2000): 3637-3644.
- Milo R. What is the total number of protein molecules per cell volume? A call to rethink some published values. Bioessays 35 (2013): 1050-1055.
- Lodish H, Berk A, Zipursky SL, et al. Molecular Cell Biology. 4th edition. New York: W. H. Freeman. Section 1.2, The Molecules of Life (2000).
- Darzacq X, et al. In vivo dynamics of RNA polymerase II transcription. Nat Struct Mol Biol 14 (2007): 796-806.
- Singh J, Padgett RA. Rates of in situ transcription and splicing in large human genes. Nat Struct Mol Biol 16 (2009): 1128-1133.
- Elbendary AA, et al. Relationship between p21 expression and mutation of the p53 tumor suppressor gene in normal and malignant ovarian epithelial cells. Clin Cancer Res 2 (1996): 1571-1575.
- Sun T, Yang W, Liu J, et al. Modeling the Basal Dynamics of P53 System 6 (2011): 1-9.
- Orme ME, Chaplain MJ. A Mathematical Model of Vascular Tumour Growth and Invasion. 23 (1996): 43-60.
- Kilkenny C, Browne WJ, Cuthill IC, et al. Improving Bioscience Research Reporting: The ARRIVE Guidelines for Reporting Animal Research. PLOS Biol 8 (2010): e1000412.


 Impact Factor: * 5.3
 Acceptance Rate: 75.63%
  Time to first decision: 10.4 days
  Time from article received to acceptance: 2-3 weeks