Design and Creation of a Wearable Circular Ultrasonic Device for a Soft Screening and Diagnosis of Breast Abnormalities
Amira Godih1, Georges Nassar2*, Toshima Z Parris3, Nadine Saad4, Elie Helou5, Per Karlsson3, Khalil Helou3
1University of Sciences and Technology, Laboratory Signals and Images, Oran, Algeria
2University polytechnique Hauts-des-France, IEMN-CNRS UMR, France
3Department of Oncology, Institute of Clinical Sciences, Sahlgrenska Cancer Center, Sahlgrenska Academy at University of Gothenburg, Gothenburg, Sweden
4Faculty of Sciences, Lebanese University, Beirut, Lebanon
5Faculty of medicine, Saint Joseph University, Beirut, Lebanon
*Corresponding Author: Georges Nassar, University polytechnique Hauts-des-France, IEMN-CNRS UMR 8520, France
Received: 21 September 2019; Accepted: 17 October 2019; Published: 22 October 2019;
Article Information
Citation: Amira Godih, Georges Nassar, Toshima Z Parris, Nadine Saad, Elie Helou, Per Karlsson, Khalil Helou. Design and Creation of a Wearable Circular Ultrasonic Device for a Soft Screening and Diagnosis of Breast Abnormalities. Journal of Cancer Science and Clinical Therapeutics 3 (2019): 251-265.
View / Download Pdf Share at FacebookAbstract
An ultrasound breast imaging system was implemented comprising sensors with a wide lateral radiation field distributed at equal distances on rings of different diameters covering the breast. The Green function was derived to calculate the acoustic field generated by these transducers when they were excited sequentially by a short radio frequency pulsation with a central frequency of 4.5 MHz. The temporal convolution function was used to define the maximum spatial resemblance between two signals. This made it possible to quantify the ultrasonic intensity for all the spatial positions in a single step through the principle of phantoms coupled to the signal envelope from each point considered as a potentially suspicious area. The results show the relevance of the system under consideration.
Keywords
Breast cancer; Ultrasound model; Sensors
Breast cancer articles, Ultrasound model articles, Sensors articles
Breast cancer articles Breast cancer Research articles Breast cancer review articles Breast cancer PubMed articles Breast cancer PubMed Central articles Breast cancer 2023 articles Breast cancer 2024 articles Breast cancer Scopus articles Breast cancer impact factor journals Breast cancer Scopus journals Breast cancer PubMed journals Breast cancer medical journals Breast cancer free journals Breast cancer best journals Breast cancer top journals Breast cancer free medical journals Breast cancer famous journals Breast cancer Google Scholar indexed journals Ultrasound model articles Ultrasound model Research articles Ultrasound model review articles Ultrasound model PubMed articles Ultrasound model PubMed Central articles Ultrasound model 2023 articles Ultrasound model 2024 articles Ultrasound model Scopus articles Ultrasound model impact factor journals Ultrasound model Scopus journals Ultrasound model PubMed journals Ultrasound model medical journals Ultrasound model free journals Ultrasound model best journals Ultrasound model top journals Ultrasound model free medical journals Ultrasound model famous journals Ultrasound model Google Scholar indexed journals Sensors articles Sensors Research articles Sensors review articles Sensors PubMed articles Sensors PubMed Central articles Sensors 2023 articles Sensors 2024 articles Sensors Scopus articles Sensors impact factor journals Sensors Scopus journals Sensors PubMed journals Sensors medical journals Sensors free journals Sensors best journals Sensors top journals Sensors free medical journals Sensors famous journals Sensors Google Scholar indexed journals Tomography articles Tomography Research articles Tomography review articles Tomography PubMed articles Tomography PubMed Central articles Tomography 2023 articles Tomography 2024 articles Tomography Scopus articles Tomography impact factor journals Tomography Scopus journals Tomography PubMed journals Tomography medical journals Tomography free journals Tomography best journals Tomography top journals Tomography free medical journals Tomography famous journals Tomography Google Scholar indexed journals malignancy articles malignancy Research articles malignancy review articles malignancy PubMed articles malignancy PubMed Central articles malignancy 2023 articles malignancy 2024 articles malignancy Scopus articles malignancy impact factor journals malignancy Scopus journals malignancy PubMed journals malignancy medical journals malignancy free journals malignancy best journals malignancy top journals malignancy free medical journals malignancy famous journals malignancy Google Scholar indexed journals normalized displacement polarization vector articles normalized displacement polarization vector Research articles normalized displacement polarization vector review articles normalized displacement polarization vector PubMed articles normalized displacement polarization vector PubMed Central articles normalized displacement polarization vector 2023 articles normalized displacement polarization vector 2024 articles normalized displacement polarization vector Scopus articles normalized displacement polarization vector impact factor journals normalized displacement polarization vector Scopus journals normalized displacement polarization vector PubMed journals normalized displacement polarization vector medical journals normalized displacement polarization vector free journals normalized displacement polarization vector best journals normalized displacement polarization vector top journals normalized displacement polarization vector free medical journals normalized displacement polarization vector famous journals normalized displacement polarization vector Google Scholar indexed journals ultrasonic Emitter/Receiver articles ultrasonic Emitter/Receiver Research articles ultrasonic Emitter/Receiver review articles ultrasonic Emitter/Receiver PubMed articles ultrasonic Emitter/Receiver PubMed Central articles ultrasonic Emitter/Receiver 2023 articles ultrasonic Emitter/Receiver 2024 articles ultrasonic Emitter/Receiver Scopus articles ultrasonic Emitter/Receiver impact factor journals ultrasonic Emitter/Receiver Scopus journals ultrasonic Emitter/Receiver PubMed journals ultrasonic Emitter/Receiver medical journals ultrasonic Emitter/Receiver free journals ultrasonic Emitter/Receiver best journals ultrasonic Emitter/Receiver top journals ultrasonic Emitter/Receiver free medical journals ultrasonic Emitter/Receiver famous journals ultrasonic Emitter/Receiver Google Scholar indexed journals tumor volume doubling time articles tumor volume doubling time Research articles tumor volume doubling time review articles tumor volume doubling time PubMed articles tumor volume doubling time PubMed Central articles tumor volume doubling time 2023 articles tumor volume doubling time 2024 articles tumor volume doubling time Scopus articles tumor volume doubling time impact factor journals tumor volume doubling time Scopus journals tumor volume doubling time PubMed journals tumor volume doubling time medical journals tumor volume doubling time free journals tumor volume doubling time best journals tumor volume doubling time top journals tumor volume doubling time free medical journals tumor volume doubling time famous journals tumor volume doubling time Google Scholar indexed journals Bayesian Information Criterion articles Bayesian Information Criterion Research articles Bayesian Information Criterion review articles Bayesian Information Criterion PubMed articles Bayesian Information Criterion PubMed Central articles Bayesian Information Criterion 2023 articles Bayesian Information Criterion 2024 articles Bayesian Information Criterion Scopus articles Bayesian Information Criterion impact factor journals Bayesian Information Criterion Scopus journals Bayesian Information Criterion PubMed journals Bayesian Information Criterion medical journals Bayesian Information Criterion free journals Bayesian Information Criterion best journals Bayesian Information Criterion top journals Bayesian Information Criterion free medical journals Bayesian Information Criterion famous journals Bayesian Information Criterion Google Scholar indexed journals amplitude of displacement articles amplitude of displacement Research articles amplitude of displacement review articles amplitude of displacement PubMed articles amplitude of displacement PubMed Central articles amplitude of displacement 2023 articles amplitude of displacement 2024 articles amplitude of displacement Scopus articles amplitude of displacement impact factor journals amplitude of displacement Scopus journals amplitude of displacement PubMed journals amplitude of displacement medical journals amplitude of displacement free journals amplitude of displacement best journals amplitude of displacement top journals amplitude of displacement free medical journals amplitude of displacement famous journals amplitude of displacement Google Scholar indexed journals
Article Details
Abbreviations:
TVDT-tumor volume doubling time; 2D; 3D-two; three dimensions; USCT-Ultrasound Computer Tomography; SAFT-synthetic aperture focusing technique; ROI-region of interest; BIC-Bayesian Information Criterion; LLF-likelihood function; Kij-wave number vectors; Cmn-wave velocity; amn-amplitude of displacement; pmn-normalized displacement polarization vector; E/R-ultrasonic Emitter/Receiver
1. Introduction
Breast cancer is the most common malignancy among women worldwide, with 1.7 million women diagnosed annually [1]. Breast tumors grow exponentially with a tumor volume doubling time (TVDT) of about 18 months. The TVDT increases with increasing tumor size, which in turn can increase the risk of metastatic spread and death. Detecting cancer before it metastasizes is practically the only way of stopping the progression of the disease and saving the patient. For this purpose, it is necessary to diagnose the disease at an early stage and determine whether the tumor is benign or malignant. The 5-year survival rate for early-stage breast cancer is currently between 75% and 90%. The structure of a healthy female breast is complex. It is composed of adipose and connective tissue, lobes, lobules, and lymph nodes, the amounts of which vary from woman to woman. Studying the anatomy of this structure would help improve understanding of the ultrasound images collected within the framework of this work. However, the ultrasound model of the mammary gland changes with age, health status, and hormonal cycle. Thus, ultrasound images may even differ between young, healthy women despite a similar number of mammary glands and amount of connective tissue fat. Changes in the menstrual cycle (increase in size, density, modularity, and tenderness of the chest in the second half of the cycle) do not produce a significant effect on the ultrasound model; increased echogenicity due to edema can be an advantage and highlights the ability of this technique to visualize solid or liquid masses.
Moreover, mammography screening is currently available for women at average risk of breast cancer aged between 40 and 75 years. Young women have relatively dense breasts so their mammograms can be difficult to interpret. However, several clinical studies have demonstrated that ultrasound imaging can detect micro-calcifications in dense breasts that potentially lead to 30% of metastatic cases. Ultrasound imaging systems used nowadays are bulky so examinations are time-consuming and have high false-positive rates, which warrants the need for a reliable, connected diagnostic system, delivering an almost real-time result that is accessible to all. Several studies have recently contributed to our understanding of the mechanisms that control tumor development and the diagnosis of cancer at physical, chemical, and biological levels. Györffy et al. [2] use a biomarker approach to develop multivariate prediction models by quantifying the estrogen receptor (ER) and proliferation-related genes. The studies by McCart Reed [3], Martelotto [4], Eriksoon [5], Haber [6], and Koopman [7] focus more on physical applications for the detection or quantification of tumor masses, whereas Padamsee et al. [8] summarize different known and unknown factors driving a woman's decisions regarding breast cancer risk management methods. During the past decade, many research teams and commercial companies have developed ultrasound imaging systems to visualize 2D or 3D images of the breast using antenna of different shapes (e.g., circular, semicircular, matrix or conical). Nevertheless, most of these systems are bulky and the images are acquired in a ventral decubitus position, as the patient must immerse her breast in a tank of water for more than half an hour.
Unfortunately, ultrasound imaging still has the disadvantage of being operator-dependent, which can lead to high false-negative rates if the operator lacks experience. Several solutions have been developed to solve this problem. In this section, we present a non-exhaustive list of the technologies that have been developed such as the work by Anastasio et al. [9] based on two circular antenna systemscomprising1024 and 512 elements continuously emitting a cylindrical wave at 1 MHz and 0.4 MHz, respectively. The reconstruction algorithm is similar to the conventional diffraction tomography procedure with an assumption of rectilinear propagation. Reiser et al. [10] use a circular antenna at 1.5 MHz containing 256 elements. Their imaging technique consists in recovering the reflected fields and transmitting them with an apodization of 20°. The reconstruction algorithm is based on the Radon transform assuming rectilinear wave propagation; the reconstructed image has a resolution of 2.5 mm × 0.3 mm × 0.3 mm. Ruiter et al. [11, 12] use tomography based on a cylinder 15 cm in length and 18 cm in diameter containing 157 bars with 8 emitters and 32 receivers each. The system (USCT1) is immersed in water and rotated six times to achieve a spatial resolution of (0.2 mm × 0.2 mm). To optimize the isotropy of the 3D configuration, they propose another system (USCT2) based on a semi-elliptic shape with 628 emitters and 1413 receivers oriented randomly. The synthetic aperture focusing technique (SAFT) algorithm is used and the reconstruction is achieved by assembling the various echoes (A-scan). Rouyer et al. [13] use a semicircular antenna containing 1024 elements, which makes it possible to obtain sagittal cuts through rotations. The filtered elliptic back-projection reconstruction algorithm was used. Hence, the search for technologies to improve the quality and simplicity of tumor detection will help improve prospects with regard to treatment and surgery, empower women to make informed, coherent decisions, and contribute to positive health outcomes.
Our present work based on an ultrasound system with sensors distributed uniformly on rings of different diameters thus covering almost the whole breast (Figure 1), aims to meet this need. The wide lateral radiation field of these sensors is the key feature in this study.

Figure 1: Illustration of the layout of the ultrasonic imaging system. Rings equipped with an adequate number of electromechanical elements (piezo) that can be adapted to the morphology of the breast. Cyclic excitation of Emitter/Receiver units covering the entire organ compile images of the transversal sections of the breast.
From a physiological point of view, the breast is a relatively uniform organ with about twenty identical lobes distributed symmetrically around the nipple. Figure 2 shows the different layers of the successive tissues constituting the breast. Observing these structures provides a direct means of quantifying any alterations that result from mammary pathologies as soon as they become perceptible.

Figure 2: Female Breast anatomy [14].
In this context, we have developed an ultrasound approach based on the phenomenon of lateral diffraction of the ultrasonic field coupled, by impedance breakdown, to a suspicious cellular biomass. According to Lockwood and Willette [14, 15], a diffusion impulse response formulation provides access to spatial (shape) information from secondary sources which are a core element relating to our study. Then, the definition of a critical convolution threshold for the resemblance functions associated with ultrasound measurements reduces the effects of phase fluctuation, leading to a systematized inspection of suspected cancerous areas.
2. Methods
2.1 Numerical approach: Quantification of backscattered signal intensity
The backscattered echo envelope of the signal received was modeled using the Rayleigh statistical formula [16, 17] based on the Nakagami distribution. In this case, the density of the backscattered intensity was exploited to define the boundaries of the target regions through a gamma mixture differentiating the boundaries with distinct mechanical impedances (presence of speckles). The definition of phantom tissues led us to define retro intensity levels diffused in a gamma mixture by each "pixel". This pathway was explored for ultrasound speckle location delineating the boundaries of the region of interest (ROI). The signal-shaping factor and the relative weight of the gamma mixture led to the delineation of regions containing suspicious boundaries (Figure 3).

Figure 3: Elementary image for inclusions based on thephantom scattering process.
2.1.1 Region of interest (ROI): According to Shankar [17], Destrempes et al. [18, 19], and Tsui et al. [20], the density of the backscattered intensity from a homogeneous region is given by the following equation:
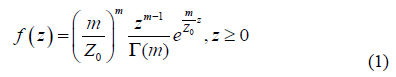
Where Z0 represents the average intensity, G is the gamma function, and m is a positive parameter.
Conversely, Atapattu et al. [21], Pereyra et al. [22], and Vegas Sanchez-Ferrero et al. [23] suggest that scattering of a heterogeneous area can be treated as a contribution of the weighted sums from different types of scattering or “species”and the density function of the backscattered intensity can be expressed in terms of a gamma mixture of n components as
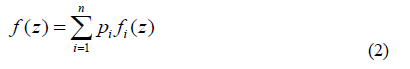
Such that the weights pi satisfy the total probability rule

Equation (1) generalized then becomes
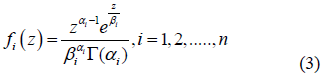
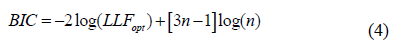
For n = 1, Eqn. (2) is related to the density of intensity in a homogenous speckle with m = a1 and Z0=a1b1. The formatting parameters are aI and the scale factors are bi. Each component i = 1, 2, ..., n represents a unique kind of diffusion. Equation 2 defines (3n-1) parameters for n gamma density components. Theoretically, as the number of cells is smaller than the number of parameters to be estimated, the most suitable way of validating the density of the mixtures is the Bayesian Information Criterion [24] using the following equation:
The convergence of this equation is based on a two-step iterative method:
The first step determines the expected value of the log-likelihood of the data [25]. The second step maximizes the log-likelihood to obtain the parameters of the mixture of morphological intensities. Iterations are performed while continually adjusting the parameters until a stable log-likelihood function is reached that reflects the optimal parameter values. By processing the data samples independently, the log likelihood (LLF) function is:
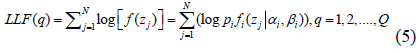
Where Q represents the iteration number and N is the number of data samples.
The expression produces a set of optimal parameters for a given number of components n if

The trend towards zero of this equation defines the lower threshold related to the heterogeneity of the breast tissue. A non-zero value indicates the probable presence of a suspicious speckle that can be assigned to a pixel of order “n”. According to Klaeskens et al. [26], the best model is obtained if the differences between the BIC values are small. Let BICmin and Dk be defined as

Once the selection of a model (n = k) is based on Dk being zero, a detection threshold value is suggested. The choice of the value depends on the nature and the form of the signals received that are refracted by the heterogeneity of the tissues.
In this context, the model with the lowest BIC value has the highest probability:
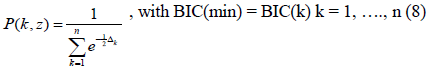
leading to a noticeable simplification, as the case classification will be reduced over the range 0 to 1.
Based on a Matlab Math works formulation, the algorithm solution gives parameters for Eqn. (3). Table 1 shows the following data in both extreme cases for a homogenous area without edges(no visible boundary) and for existing edge interface layers.
|
ROI |
n |
α |
β |
Normalized BICmin |
LLF(k+1) – LLF(k) |
Probability |
|
No boundary |
1 |
0.9 |
1.1 |
0.4 |
0.01 |
0.6 |
|
Contains boundary |
2 |
0.6 |
4 |
0.1 |
0.7 |
0.9 |
Table 1: Data in both extreme cases for a homogenous area without edges(no visible boundary) and for existing edge interface layers.
2.2 Physical approaches: Ultrasonic Quantification Parameters
This work reports a complete mathematical model of the behavior of ultrasonic waves in viscoelastic liquid/solid multilayer human breast tissue to quantify the optimal ultrasonic parameters to improve the preservation of human health and establish a “soft” therapeutic or diagnostic tool without the risks linked to current equipment, e.g. MRI and X-Ray. We discuss the displacement of ultrasonic fields and the boundary conditions at two interfaces between different media: skin, fat, lobes, and tumor. From a physical point of view, the continuity of the displacements and the normal and shear stresses are respected. To reach our goal, the transfer matrix approach involving the viscosity and the mixed boundary conditions was used to model wave propagation. With this method, the matrix describing the multilayer structure can be obtained by multiplying the matrices of the same order describing each layer. The displacement and stress at the multilayer surface can thus be expressed as a function of those at the posterior surface by taking into account the angle of refraction.
2.2.1 Layer characterization using a matrix approach: Consider a multilayered structure consisting of N layers of different nature and thickness bounded by two fluid semi-spaces, as shown in Figure 4. The layers and interfaces separating them are indexed i, with i varying from 1 to N. The upper and lower semi-spaces along with the corresponding interfaces are indexed 0 and N+1, respectively. The coordinate system was chosen so that the incident plane coincides with the plane, hence the components of all vectors are only expressed in terms of x and z. For an incident plane wave on the upper interface of the structure with an incidence angle , the number of partial plane waves propagating in each medium depends on the nature of the latter. For each layer, a local spatial coordinate is selected at the top of the th layer ( ) for waves propagating in the direction, denoted by the superscript , and at the bottom of the th layer ( ) for waves propagating in the direction, denoted by the superscript , hence, . The corresponding wave number vectors are
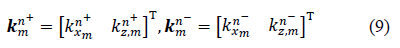
Where T denotes the transpose vector and 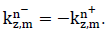 Moreover, applying Snell’s law, the projection of these wave number vectors on the x-axis for all the modes in all layers should be equal, which gives

with being the wave number in the incidence medium. In general, for a plane wave of index in layer , the wave number can be expressed as
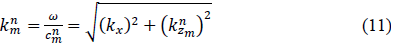
with being the corresponding wave velocity and the radial frequency.
Therefore, the total displacement in a given layer is the summation of all displacements relative to each propagating wave mode and is expressed as follows:
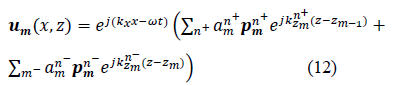
Where is the amplitude of the displacement and is the normalized displacement polarization vector that is parallel to the wave number vector for a longitudinal wave and orthogonal to it for a transverse wave. The harmonic time dependence term is intentionally suppressed in the following. An algorithm based on a matrix formalism was developed to deepen the understanding of the ultrasonic behavior of multilayer human tissue. The reflection and transmission of ultrasonic waves in a combination of different layers (lobular, fat...) were studied. Based on such an algorithm, the refraction coefficient diagrams were quantified with varying frequencies and wave angles of incidence.

Figure 4: A Multilayered structure consisting of N layers.
2.2.2 Model Validation: As discussed previously, the phantoms consist of a collection of target points in a highly diffusive region (ROI with edges). The phantoms are generated by finding their random position in a large cube, then assigning Gaussian amplitude to each phantom (Figure 5).

Figure 5: Numerical model based on the incursion, in a given volume (same order of size as the breast), of heterogeneous porosities with various physical properties. This model, dedicated to the detection of internal boundaries through ultrasound groups in Emission/Reception, includes 10 sensors evenly distributed around a circular ring.
In order to define the boundary conditions of the different interfaces encountered by the propagation of the wave (breast anatomy) and to quantify the necessary non-detrimental energy for optimal detection, a discrete study based on one ultrasonic ring was carried out in which we introduced phantoms in a given elementary volume. If the diffuser resided in a healthy region, the amplitude was set to zero. In a highly scattering region, the amplitude was multiplied by 10. The target points were fixed a tan amplitude of 10 compared to the standard deviation of the Gaussian distributions of 1. The quality of the ultrasound diagnosis depends on the operator as well as the position of the probe and the section considered. In fact, conventional ultrasound scans orthogonal to the path of ducts neglect an important marker, which is based on the symmetrical anatomy of the breast. Even though the anatomy varies more or less from one person to another, our approach not only provides a positioning reference system but also an effective inspection strategy. Physical models are based on the equidistant distribution of ultrasonic sensors with circumferences of different diameters centered on the horizontal axis passing through the nipple (Figure 6).

Figure 6: Illustration showing images of different lateral sections of the breast applying a detection threshold based on the BIC value applied.
Figure 7 shows the results from the model based on the detection of phantoms imitating biological breast tissue. Based on the contribution of the sum of the refracted amplitudes received by the different receivers, the images show lateral sections of the breast given by each ultrasound ring. From a physical point of view and for in-vivo applications, the characteristics of each elementary sensor were adapted to obtain a wide lateral radiation field (Figure 7) to compare the critical shape threshold for each E / R group by exploiting the symmetrical similarity of the lateral sections of the breast.

Figure 7: Ultrasonic radiation field and physical characteristics of each elementary Emitter/Receiver sensor.
To minimize the computation time, we considered an area with a circumferential distribution (2D) whose spatial distribution of the sensors, uniformly distributed, respects the boundary conditions and the interference phenomenon. To cover the 2D plane of a lateral breast section, the ultrasound excitation/reception protocol follows a cyclic rotation so that the transmitter at the starting time t0 becomes a receiver at t(0 + 1) after a full rotation. Starting from a spatial reference based on the BIC (not exceeding a critical threshold) accessible by analysis of the signals from the successive E / R groups, the signal processing algorithm could be significantly reduced by eliminating data (signals) with a very high correlation coefficient and focusing only on the areas where the gamma mixture was detectable.
3. Results
3.1 Spatial Speckle detection and delimitation
In practical terms, the likelihood algorithm was applied to compare the two signals received by receivers R1 and R(k+1) located on either side of the emitter Ei (Figure 8). For each transmission/reception trio (Ei / R1; R (k + 1)) associated with a given pixel, the morphology of the envelopes and the wave travel times were taken into account to estimate the intensities received and the exact spatial location of the “pixel”concerned.

Figure 8: Ultrasonic measurement principle adopting a cyclic Emission/Reception protocol taking into account the wave propagation time of flight and the angle of refraction at the tissue interfaces.
To define a spatial reference for the positioning of the ultrasound ring, we considered the tendency towards zero for Eq. 6. In other words, the maximum resemblance between two signals received jointly by the receivers forming the group E / Ri, R (k + 1). Consequently, the transfer function governing the position of the scattering point will allow its spatial identification, which leads to the measurement of the time of flight of the wave emitted and refracted by the ROI in the mass. Indeed, the analysis of the ultrasonic magnitudes of the signals received will make it possible, based on exceeding a certain critical similarity threshold between the two receivers, to define the existence of the interfaces in a separate gamma mixture and consequently suspicious ROI. For the latter, the amplitudes resulting from the contribution of different sensors are then added together until a significant image of the suspicious speckle is obtained. Clinically, a bra equipped with 10 ultrasonic sensors integrated into a ring 10 cm in diameter covering the base of the breast was used to compare data obtained in a real situation using our concept and other techniques such as X-Rays. A 1000 x 1000-pixel sample of the lateral section of the breast was obtained with spatial identification of each pixel. Physically, these results in a spatial sampling of the computing grid equivalent to a wavelength of 0.3 mm. Each pixel on the map is assigned an ultrasonic velocity, an impedance, and an angle of refraction, which are assumed to be representative of the type of tissue constituting the breast, e.g. fat, lobes.
From a statistical point of view, the spatial correlation functions per sensor group (E / Ri, Rj) were used to describe the size, shape, distribution, and mechanical properties of the medium. By exploiting the Gaussian form factor and the density of the envelope intensity, we were able to isolate and then amplify the ROI zone, thus expressing the presence of heterogeneity that goes beyond the anatomical standard of the breast. In the medical field, this would indicate the presence of structural anomalies. Figure 9 shows good agreement between the 2D image, the sample from the model adopted in this study, and the X-Ray mammography.

Figure 9: In vivo clinical application showing the speckle detection potential using a prototype ultrasound “bra” compared with an X-Rayimage.
4. Discussion
To make this concept useful, reliable, and safe, the bra covering the whole breast will be equipped with a "mechatronics" system thus ensuring the standardization of the measurement parameters (normalized positioning of the sensors) with optimal physical adaptation. This "Hard" concept of optimal coupling conditions (medical gel microinjection, if necessary, between the sensor and the breast) will optimize the transition and the reliability of the
information carried by the ultrasonic signal and consequently ensure minimum uncertainty regarding the analyses and an optimized algorithm for "real-time" diagnosis. Moreover, a communication module and "smart phone" interface will be integrated into the bra to make the overall concept autonomous and connected.
5. Conclusion
In this work, we implemented "soft" ultrasound characterization and imaging technology for diagnosing breast cancer. One of the objectives of this work was to attain unrestricted access to early screening and apply the result to a preventive therapeutic tool to mitigate overall breast cancer metastasis. The information resulting from an application like this will have a preventive role through an individual examination in order to:
- Evaluate the variation in the physical properties of the matter in relation to normal biological variations (stress, hardening, calcification...)
- Verify good conditions for prosthesis implantation: physical compatibility
- Use radiation-free, "soft" technology that monitors the progression of the physical condition of a “treated organ”, especially for people at risk who have undergone surgery and/or chemotherapy.
In this context, a prototype instrumented bra (possibility of being connected to a cell phone interface) was developed using ultrasonic sensors with optimized field radiation integrated in torings to cover the entire organ under investigation.
Acknowledgments
We are grateful to the Institute of Electronics, Microelectronics and Nanotechnology laboratory in Villeneuve d’Ascq (France) and the Signal processing laboratory of the “Université des Sciences et Technologie 'Oran” for their ultrasound concept design and Computer Sciences analysis support.We would also like to thank the medical establishment that allowed us to conduct tests on its premises.
Funding
This work was supported by grants from the Swedish Cancer Society (CAN 2012/406; CAN 2015/311; K H), the King Gustav V Jubilee Clinic Cancer Research Foundation (2016:65; KH), and the LUA/ALF-agreement in the West of Sweden health care region (PK).
Availability of data and materials
Not applicable.
Authors’ contributions
GN and KH were responsible for the overall study concept. AG was responsible of signal analysis algorithm and signal processing concept. GN and NS contributed to the experimental concept design. AG and GN collected the physiological data. PK, TZP and EH contributed to the statistical analyses. KH, PK and EH provided technical and material support. GN, AG and TZP performed the experiments. AG, GN, KH and TZP wrote the manuscript. All authors reviewed, edited, and approved the final manuscript.
Authors’ information
Not applicable.
Ethics approval
Not applicable
Consent for publication
Not applicable.
Competing Interests
The authors declare that they have no competing interests.
References
- DeSantis C, Ma J, Sauer AG, et al. Breast Cancer Statistics, Racial Disparity in Mortality by State, CA: CANCER Journal for Clinicians 67 (2017): 439-448.
- Balazs Gyorffy, Christos Hatzis, Tara Sanft, et al. Multigene prognostic tests in breast cancer: past, present, future. Breast Cancer Research 11 (2015): 1-7.
- Amy E McCart Reed, Jamie R Kutasovic, Sunil R Lakhani, et al. Invasive lobular carcinoma of the breast: morphology, biomarkers and ’omics. Breast Cancer Research 17 (2015): 1-11.
- Luciano G Martelotto, Charlotte KY Ng, Salvatore Piscuoglio, et al. Breast cancer intra-tumor heterogeneity. Breast Cancer Research 16 (2014): 1-11.
- Mikael Eriksson, Kamila Czene, Yudi Pawitan, et al. A clinical model for identifying the short-term risk of breast cancer. Breast Cancer Research (2017): 1-8.
- Daniel A Haber. Molecular detection and characterization of circulating tumor cells. Proceedings of the AACR-NCI-EORTC International Conference: Molecular Targets and Cancer Therapeutics (2017).
- Timco Koopman, Henk J Buikema, Harry Hollema, et al. Digital image analysis of Ki67 proliferation index in breast cancer using virtual dual staining on whole tissue sections: clinical validation and inter-platform agreement. Breast Cancer Research and Treatment 169 (2018): 33-42.
- Tasleem J Padamsee, Celia E Wills, Lisa D Yee, et al. Decision making for breast cancer prevention among women at elevated risk, Breast Cancer Research (2017): 1-12.
- Mark A Anastasio and Patrick La Riviere. Emerging Imaging Technologies in Medecine, CRC Press, Taylor and Francis Group (2013).
- Reiser and GlickS. Tomosynthesis Imaging, CRC Press, Taylor and Francis Group (2014).
- Ruiter NV, Schwarzenberg GF, Zapf M, et al. 3D ultrasound computer tomography: Results with a clinical breast phantom. In Proceedings of IEEE International Ultrasonics Symposium (2006).
- Ruiter NV, Gobel G, Berger L, et al. Realization of an optimized 3D USCT. In Proceedings of SPIE Medical Imaging (2011): 7968-7905.
- Rouyer J, Mensah S, Franceschini E, et al. Conformal Ultrasound Imaging System for Anatomical Breast Inspection. IEEE Transactions on Ultrasonics, Ferroelectrics, and Frequency Control 59 (2012): 1457-1469.
- Mayo Clinic, A to Z Health Guide. Ed.: Scott C Litin (2015).
- Lockwood JC andWillette G. High-speed method for computing the exact solution for the pressure variations in the near field of a baffled piston. Journal of Acoustics Society of America 53 (1973): 735-741.
- Shankar PM. A general statistical model for ultrasonic scattering from tissues. IEEE Transaction on Ultrasonics, Ferroelectrics and Frequency Control 47 (2000): 727-736.
- Shankar PM. Statistics of Boundaries in Ultrasonic B-Scan Images. Ultrasound in Medicine and biology 41 (2015): 268-280.
- Destrempes F and Cloutier G. A critical review and uniformized representation of statistical distributions modeling the ultrasound echo envelope. Ultrasound in Medicine and Biology 36 (2010): 1037-1051.
- Destrempes F, Franceschini E, Yu FTH, et al. Unifying concepts of statistical and spectral quantitative ultrasound techniques. IEEE Transaction on Ultrasonics, Ferroelectrics and Frequency Control 35 (2016): 488-500.
- Tsui PH, Wan YL, Tai DI, et al. Effects of Estimators on Ultrasound Nakagami Imaging in Visualizing the Change in the Backscattered Statistics from a Rayleigh Distribution to a Pre-Rayleigh Distribution. Ultrasound in Medicine and Biology 41 (2015): 2240-2251.
- Atapattu S, Tellambura C, Jiang H. 2011 A mixture gamma distribution to model the SNR of wireless channels. IEEE Transaction on Wireless Communication 10 (2011) 4193-4203.
- Pereyra M, Dobigeon N, Batatia H, et al. Segmentation of skin lesions in 2-D and 3-D ultrasound images using a spatially coherent generalized Rayleigh mixture model. IEEE Transaction on Medical Imaging 31 (2012): 1509-1520.
- Vegas-Sanchez-Ferrero G, Seabra J, Rodriguez-Leor O, et al. Gamma mixture classifierfor plaque detection in intravascularultrasonicimages. IEEE Transaction on Ultrasonics, Ferroelectrics and Frequency Control 61 (2014): 44-61.
- Neath AA and Cavanaugh JE. The Bayesian information criterion: background, derivation, and applications. Wiley Interdisciplinary Reviews: Computational Statistics 4 (2012): 199-203.
- Almhana J, Liu Z, Choulakian V, et al. A recursive algorithm for gamma mixture models, Proc. IEEE International Conference on Communications (2006): 197-202.
- Claeskens G. Statistical Model Choice. Annual review of statistics and its application 10 (2016): 233-256.

 Impact Factor: * 4.1
 Acceptance Rate: 74.74%
  Time to first decision: 10.4 days
  Time from article received to acceptance: 2-3 weeks