Same-species Contamination Detection with Variant Calling Information from Next-generation Sequencing
Tao Jiang1 and Alison A. Motsinger-Reif2
1Department of Statistics, North Carolina State University, Raleigh, NC, USA Bioinformatics Research Center, North Carolina State University, Raleigh, NC, USA
2Biostatistics and Computational Biology Branch, National Institute of Environmental Health Sciences, Research Triangle Park, NC, USA
*Corresponding author:Alison A. Motsinger-Reif, Biostatistics and Computational Biology Branch, National Institute of Environmental Health Sciences, Research Triangle Park, NC, USA
Received: December 13, 2023; Accepted: December 20, 2024; Published: January 12, 2024
Article Information
Citation:
Tao Jiang, and Alison A. Motsinger-Reif. Same-species Contamination Detection with Variant Calling Information from Next-generation Sequencing. Journal of Cancer Science and Clinical Therapeutics 8 (2024): 59-69.
View / Download Pdf Share at FacebookAbstract
Background: Same-species contamination detection is an important quality control step in genetic data analysis. Due to a scarcity of methods to detect and correct for this quality control issue, same-species contamination is more difficult to detect than cross-species contamination. We introduce a novel machine learning algorithm to detect same-species contamination in next-generation sequencing data using a support vector machine (SVM) model.
Methods: In the first stage, a change-point detection method is used to identify copy number variations (CNVs) and copy number aberrations (CNAs) for filtering. Next, single nucleotide polymorphism (SNP) data is used to test for same-species contamination using an SVM model. Based on the assumption that alternative allele frequencies in next-generation sequencing follow the beta-binomial distribution, the deviation parameter ρ is estimated by the maximum likelihood method. All features of a radial basis function (RBF) kernel SVM are generated using publicly available or private training data.
Results: We provide an R software implementation of the approach, which we used to conduct simulation experiments with real data to evaluate our approach. The datasets combine, in silico, exome sequencing data of DNA from two lymphoblastoid cell lines (NA12878 and NA10855). We generated variant call format (VCF) files using variants identified in these data and then evaluated the power and false-positive rate. In these real data, the approach detected contamination levels as low as 5% with a reasonable false-positive rate. The results had sensitivity above 99.99% and specificity of 90.24%, even in the presence of degraded samples with similar features as contaminated samples.
Conclusions: Our approach uniquely detects contamination using variant calling information stored in VCF files for DNA or RNA. Importantly, it can differentiate between same-species contamination and mixtures of tumor and normal cells. Accordingly, it represents an important tool that can be applied within the quality control process.
Keywords
<p>Same-species contamination, Variant call format, Support vector machine, Machine learning: Beta-binomial distribution.</p>
Article Details
Introduction
High-throughput next-generation sequencing (NGS) has advantages over traditional Sanger sequencing and microarrays in terms of accuracy, cost, and speed [1, 2]. As NGS technologies have matured, best practices for quality control and data processing procedures have been developed [3]. Detecting
sample contamination is a necessary quality control step for the NGS data analysis pipeline because contamination can occur during sample preparation and sequencing analysis. Sample contamination affects downstream sample analysis and may even generate misleading results, leading to false- positive associations and genotype misclassification [4].
Contamination happens when a sample contains tissues from more than one source and can occur in NGS samples for various reasons. Despite best practices, the use of unclean lab devices can introduce unexpected materials such as mycoplasma [5]. This occurs in projects of all scales, including the large-scale 1000 Genomes Project [6]. Contamination can also arise from sample handling, sample extraction, library preparation and amplification, sample multiplexing, and inaccurate barcode sequencing [7]. Existing contamination detection methods are mainly based on sequencing and allele frequency information for samples and can be categorized into two groups based on the source of contamination: cross- species contamination and same-species contamination.
Cross-species contamination has been well-studied, and modern metagenomics approaches are extensions of cross- species contamination detection approaches. There are several methods for detecting cross-species contamination [8-11]. For example, [10] developed DeconSeq, a framework for identifying and removing human contamination from microbial metagenomes during sequencing alignment. [1] scanned samples from Bos taurus, the domestic cow, using microbiome analysis software and found small contigs from microbial contaminants. In these approaches, data are generally assembled from available Sanger reads for known species, and then the unmapped contigs within the assembly are classified by k- mer matching to a RefSeq database containing all bacteria, archaea, and viruses. The presence of contigs that align with other genomes is a sign of contamination.
In contrast, detecting same-species or within-species contamination is more challenging, and there are few valid, robust approaches. The most commonly implemented approach and the earliest developed is ContEst [12], a module in the Genome Analysis ToolKit (GATK) software [13]. ContEst uses a Bayesian method to calculate the posterior probability of a specific contamination level and find the maximum a posteriori probability (MAP) estimate of the contamination level at homozygous loci. Assuming a uniform prior distribution, Uni f (0, 1), on the contamination level, the posterior distribution of the contamination level is proportional to the joint distribution of observed alleles, given the base-calling qualities and the probability of observing true alleles in a contaminated sample. Thus, ContEst requires variant call format (VCF) and binary alignment map (BAM) input and general population frequency information such as base identities and quality scores from sequencing data.
Another approach, the VerifyBamID package, detects same-species contamination of human DNA samples in both sequence- and array-based data [4]. VerifyBamID implements likelihood- and regression-based approaches that assume a tested DNA sample contains no more than one contaminant. The probability of a sample having a particular contamination level is maximized through a grid search over each contamination level. While VerifyBamID has demonstrated good sensitivity in real-data experiments, copy number alterations (CNAs) in tumor samples shift allele frequencies away from those outside CNA regions, resulting in the misinterpretation of copy number-driven shift as contamination [14]. To address this, the Conpair method builds on the statistical model introduced in VerifyBamID and focuses on homozygous loci to detect additional sources of same-species contamination in samples containing a mixture of tumor and normal cells from the same individual [14]. Given that homozygous markers are invariant to copy number changes, Conpair uses pre-selected, highly informative genomic homozygous markers to perform contamination detection.
More recently developed methods use haplotype structure for contamination detection in NGS data [15]. In one approach, closely spaced single nucleotide polymorphism (SNP) pairs within a sequencing region are identified from the 1000 Genomes database [16], and read haplotypes are inferred for the selected SNP pairs. A human-human admixture is suggested if more than two read haplotypes are observed at a given locus in a sample. The estimated level of contamination for each sample is twice the mean frequency of the minor haplotype.
Current approaches for same-species contamination detection have been successful in a broad range of applications, but there are major limitations. We address these limitations with our approach, which provides substantial improvements in both the practical implementation of quality control procedures and the statistical model used. While existing approaches rely on sizeable human reference genome data as well as at least two large, memory-intensive files, either tumor and normal BAM files (Conpair), or VCF files and BAM files (VerifyBamID and ContEst), our method directly uses information in VCF files through a combination of beta- binomial assumption and support vector machines (SVMs) to detect same-species contamination. Even for tumor- normal paired samples, which are common for individuals with cancer, no additional information is required. The change points of B-allele frequencies (from the VCF file) are detected and then all chromosomes are separated into shorter sequences. Sequences overlapping any copy number variations (CNVs) or aberration regions are detected and filtered. We applied this method in both real and simulated data and found that it has excellent sensitivity and specificity for both types of data. To assist in real-data applications, we developed an R package implementation of the method.
Materials and Methods
Features in the support vector machine (SVM)
All SNPs distributed across chromosomes are classified as either homozygous (1/1) or heterozygous (0/1). The loss of heterozygosity (LOH) value is the ratio of heterozygous SNP loci to homozygous SNP loci. A large LOH value means a sample has more heterozygous SNP loci.
Each SNP locus has a respective B-allele frequency (BAF), which is the percentage of the depth alternative allele from the total depth at each SNP locus. For example, BAF ∈ [0, 1] and three cut-off values could be applied to separate the support set of BAF, [0, 1], into four sub-regions: HomRate [0.99, 1], HighRate [0.7, 0.99], HetRate [0.3, 0.7], and LowRate [0, 0.3]. A pure sample would then be expected to have higher HomeRate and HetRate values than a contaminated sample.
- HomRate is the number of loci with BAF [0.99, 1] over the total number of SNP loci in a
- HighRate is the number of loci with BAF [0.7, 99] over the total number of SNP loci in a sample.
- HetRate is the number of loci with BAF [0.3, 7] over the total number of SNP loci in a sample.
- LowRate is the number of loci with BAF [0, 3] over the total number of SNP loci in a sample.
For SNP loci distributed within the HomRate region as defined above, the variance of BAF values is defined as HomVar. HetVar is calculated using a similar procedure. A pure sample is expected to have lower HomeVar and HetVar values than a contaminated sample.
The BAF of an SNP locus is assumed to follow the beta- binomial distribution. A reference sample assumed to be pure is used to calculate the maximum likelihood estimators for parameters p and p in the beta-binomial distribution. Subsequently, the log-likelihood values of all SNP loci in the sample are summed. For comparability purposes, the log- likelihood sum is then divided by the number of loci in each sample, so that the final outcome is the average log- likelihood across all loci in a sample. A pure sample is expected to have a higher average log-likelihood value than a contaminated sample.
Tunable hyper-parameters
Two hyper-parameters—the soft margin constant C and the inverse-width parameter of Gaussian kernel γ—are optimized using grid search and cross-validation. Grid search is used to explore the two-dimensional space (C, γ). The grid points of C are chosen on an exponential scale of (2−4, 212), and the grid points of γ are chosen between (2−4, 24). Sensitivity and specificity are estimated for each point on the grid.
Simulation and real application studies
Change-point analysis for approximate copy number region detection: If the copy number information of a sample is not provided, change-point analysis can be conducted to find its copy number regions. The rmChangePoint() function included in the vanquish package imports cpt.var() from a change-point package [17]. The pruned exact linear time (PELT) method [17] and the Changepoints for a Range of PenaltieS (CROPS) algorithm [18] are employed to search for variance changepoints. Figure 1A plots the B-allele frequencies between 0.05 and 0.95 of corresponding loci in the input VCF files. In the CNV patterns, the red vertical lines indicate where variance changes were detected. The plot is separated into sections by these change points. If more than 10% of loci have a B-allele frequency between 0.45 and 0.55 and the skewness is higher than 0.5, the section is included in further analysis. Figure 1B shows the result after filtering. See the documentation of the vanquish package for more details.
Beta-binomial parameter estimation for reference samples: To calculate likelihood-based features for further analysis, maximum likelihood estimators of ρ for beta- binomial distribution of heterozygous and homozygous models are estimated. For the B- allele frequency, the theoretical value of parameter p is 0.5 in the heterozygous model and 1 in the homozygous model. p is fixed at 0.5 and

Figure 1: Change-point analysis for copy number region detection. The Y-axis shows the B- allele frequency, and the X-axis shows the location number of each variant from chromosomes 1 to 22. (A) is before copy number region filtering. Red lines indicate the variance change based on detection results. (B) is after copy number region filtering when most copy number patterns have been removed.
0.999 to search for ρ in the corresponding model. L-BFGS-B [19] is applied for maximum value searching. For instance, NA10855 was chosen as a reference sample, and five replicates were sequenced by Q2 Solutions. The maximum likelihood estimator of ρ in each sample was estimated by the ρ estimating function in the vanquish package (Table 1). The sample averages were used for further analysis. The value of the estimator highly depends on the variant caller, so using the same variant caller for the reference sample, training sample, and test samples is recommended.
Features in the classification and regression models
To train the classification and regression model, 238 samples were sequenced by Q2 Solutions as a training data set. Of the 238 samples, 124 were pure and 114 were contaminated. Briefly, genomic DNA was sheared to an average fragment size of 200 bp or 300 bp on Covaris S220 (Covaris). Ten nanograms of fragmented DNA was used as input for the library preparation. Samples were sequentially end-repaired, A-tailed, and adapter-ligated. Aliquots were analyzed for quality control on a 0.4% agarose gel containing ErBr, which was subjected to an electric potential of 58 V for a duration of 1.75 hours. The libraries for each sample were synthesized using the 10X Genomics Chromium Genome kit following the manufacturer's protocol. Each library underwent sequencing on a single lane of an Illumina HiSeqX platform. The raw sequence data underwent demultiplexing and conversion into barcode and read data FASTQ files using the 10X Genomics Long Ranger mkfastq version 2.2.1. Using the TruSeq DNA PCR-Free sample preparation kit (Illumina Inc., San Diego, CA, USA), sequencing libraries were generated following the recommendations of the manufacturer, and index codes were added. The library quality was evaluated with the Qubit@ 2.0 fluorometer (Thermo Scientific, CA, USA) and Agilent Bioanalyzer 2100 device. Finally, the Illumina NovaSeq 6000 platform was used to sequence the library.
Some samples were purposely contaminated in a wet lab, and others were simulated in silico by two pure FASTQ format files [20]. The B-allele frequency patterns differ between pure and contaminated samples. Only the heterozygous loci
Table 1: Maximum likelihood estimator ρˆ of NA10855 samples. ρˆ of heterozygous and homozygous models was estimated for each sequencing replicate. The sample mean can be used for generating features from the training data set.
|
Heterozygous ρˆ |
Homozygous ρˆ |
|
|
NA10855-1 |
0.154 |
0.0269 |
|
NA10855-2 |
0.223 |
0.0253 |
|
NA10855-3 |
0.177 |
0.021 |
|
NA10855-4 |
0.187 |
0.031 |
|
NA10855-5 |
0.169 |
0.0274 |
|
Sample mean |
0.182 |
0.0263 |
detected in samples are plotted in Figure 2. Pure samples (Figure 2A) have a narrow horizontal band, and contaminated samples (Figure 2B) have a relatively uniform distribution for B-allele frequency. Eight boxplots, along with t-tests (null hypothesis of no differences), show the difference between pure and contaminated samples for each feature (Figure 3). Among the eight features, HomVar, HetVar, and HighRate had significant P-values of 1.786−9, 1.750−6, and 4.540−20, respectively.
Tuning cost and gamma parameters in the radial kernel SVM
We used the Monte Carlo method (1000 times) and tune () from R package e1071 to tune the cost and gamma parameters in the SVM. The 238 samples were split into training (70%, 167 samples) and test (30%, 71 samples) sets. For the training set, we used grid search to tune the cost parameter in the range of (2−4, 212) and the gamma parameter in the range of (2−4, 24). We then calculated sensitivity and specificity from the test set using tuned cost and gamma. Table 2 shows the results of the Monte Carlo simulation, including median
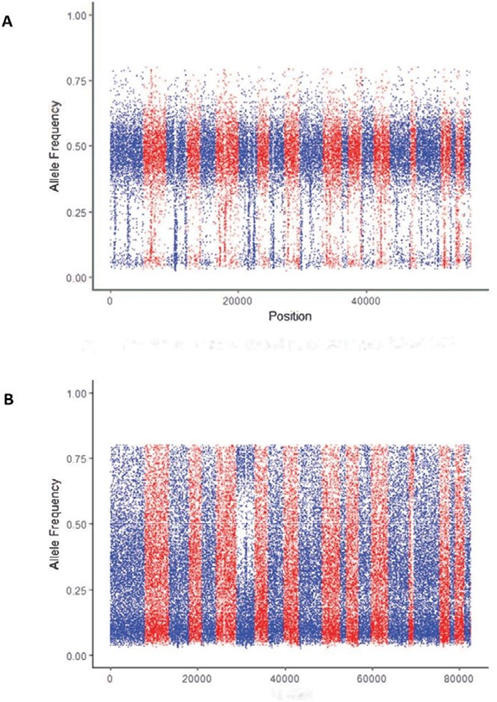
Figure 2: Difference in allele frequency between pure and contaminated curves. A) Example of a pure sample of exome sequencing data of DNA from NA24143, a lymphoblastoid cell line. B) Example of a contaminated sample of exome sequencing data from a multiplex reference.
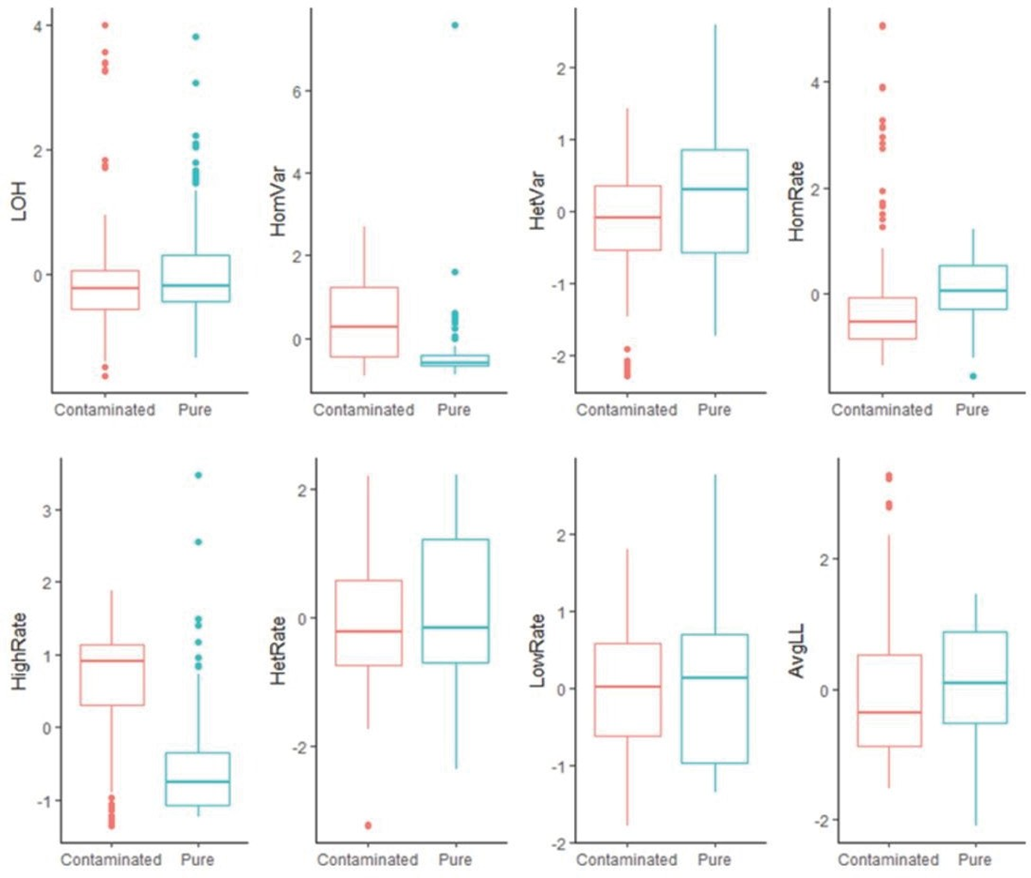
Figure 3: Boxplots of all features for pure samples (n=124) vs. contaminated samples (n=114). Among the eight t-tests (null hypothesis of no difference), HomVar, HetVar, and HighRate had significant P-values of 1.786−9, 1.750−6, and 4.540−20, respectively.
Table 2: Monte Carlo test results for parameter tuning and performance testing.
|
Median cost |
Median gamma |
Average sensitivity |
Average specificity |
|
16 |
0.25 |
97.65% |
96.27% |
values of cost (16) and gamma (0.25) and mean values of sensitivity (97.65%) and specificity (96.27%). We used the tuned cost and gamma parameter in a radial kernel SVM model for contamination prediction.
Results
Beta-binomial model of allele frequency in next- generation sequencing (NGS)
Our method is designed for human applications and assumes a diploid genome. For each locus that contains a single nucleotide variant (SNV) called from NGS data, we define the allele frequency as the number of counts for the alternative (non-reference genome) allele over the total number of depth. For any diploid genome, if an individual is homozygous for the alternative allele (denoted as alternative/ alternative, 1/1), the expected allele frequency is 1; if an individual is heterozygous (denoted as reference/alternative, 0/1) at a locus, 0.5 is the expected allele frequency. These theoretical expectations motivated our use of the binomial distribution for the number of reads at each locus,

where n is the total number of depth at the locus, p is the theoretical allele frequency, and x is the number of counts for the alternative allele.
While a simple model is intuitively appealing, previous studies have discovered extra binomial dispersion, specifically, overdispersion of allele frequency distributions [21-24]. This overdispersion results in higher variability than binomial distribution, so a distribution that models such large variance is needed. Previous studies have demonstrated the beta-binomial distribution as an appropriate model for allele frequencies at a particular locus in a subpopulation [25, 26]. The beta-binomial distribution is a discrete hierarchical model containing the beta distribution and binomial distribution, where the probability follows the beta distribution and the response follows the binomial distribution. Hence, the probability mass function of the beta-binomial distribution is

where n is the total number of reads at the locus; B(a,b) is the beta function theoretical allele frequency; and x is the number of counts for the alternative allele. This model has been applied in several studies, and the advantages of beta-binomial distribution compared to binomial distribution when dealing with overdispersion have been repeatedly demonstrated [25, 26]. Prior work using this model motivates our use of the beta-binomial distribution.
Quality control of variant call format (VCF) files
The input format for our method is the well-established VCF format [27]. To our knowledge, ours is the first method to detect same-species contamination using VCF. VCF files contain all the SNV information required in the subsequent steps, but quality control is needed to filter noise and unnecessary information. Because they use various algorithms, different variant calling tools generate different allele frequency patterns. It is strongly suggested that the same software is used for training and testing data to ensure that the features in models are consistent and the classification or regression results are accurate. The recommended quality control and processing steps are outlined below and represent additional quality control steps beyond the processing conducted to produce the VCF files.
Step 1: Insertion/deletion (indel) filtering
SNVs (not CNVs such as indels) are used as substitution variants. Only substitution mutations result in heterozygous and homozygous genotypes that can be appropriately modeled by the beta-binomial distribution. Indels, identified as any mutation segments with a length of more than one base pair, are thus filtered/dropped in this step.
Step 2: Homozygous and heterozygous genotype calling
The genotypes for modeling are then called, generating new information that summarizes the genotype in reference to the alternative allele. For any SNV, there is a homozygous and heterozygous genotype for an alternative allele. Suggested genotypes are listed in the GT (genotype) field of the VCF file, where 0/0 is a homozygous reference, 0/1 is a heterozygous reference (“Het”), and 1/1 is a homozygous alternative (“Hom”). This results in two categories of called variants, each of which corresponds with its own beta-binomial model. Homozygous references (0/0) and heterozygous genotypes (1/2, 2/3, and so on) are labeled as “Complex” and are not included in further calculations.
Step 3: Low- and high-depth filtering
This step identifies whether a sequence is a true call or a sequencing error by setting thresholds for coverage depth. A reasonable read-depth threshold should be chosen according to the average read depths of a testing sample. Read depths >50 provide acceptable sensitivity and specificity for mutation detection [28].
Step 4: Change-point detection for CNVs
The features of a pure sample with a CNV region are similar to those of a region with more than one contributor (i.e., same-species contamination). Hence, the CNV region must be filtered before generating features. If CNVs have already been generated, the function vanquish::defcon() can directly filter the CNV region. Otherwise, a change-point detection method is used to detect the CNV region. Variances of BAF (alternative allele frequency) at heterozygous loci have been reported to differ among normal, duplication, deletion, and LOH [29]. Therefore, change-point analysis can be employed to detect the change point of variance (i.e., the border of a copy number region). The change-point package is applied only for heterozygous positions to search for multiple change points of variance [17].
Distribution and likelihood-based features
The next step of our approach generates variables/features used in a model to predict same-species contamination in a sample. Two types of features are generated and used in model building: distribution-based features and likelihood- based features.
Distribution-based features are generated using allele frequency, which is a real number between 0 and 1. Allele frequency is categorized into four regions, as shown in Figure 4: low alternative allele frequency (LowRate), heterozygous alternative allele frequency (HetRate), high alternative allele frequency (HighRate), and homozygous alternative allele frequency (HomRate). Figure 2 shows the difference between pure and contaminated curves.
The model-building steps generate eight distribution-based features, which are shown in Table 3. These features reflect the distribution of allele frequencies in an entire file, instead of at each variant calling position. Therefore, each input sample/VCF file is represented by one set of features.
The likelihood-based feature is the average likelihood of all loci in a VCF file, calculated by applying the beta-binomial distribution. Using a reference genome, the maximum likelihood estimator is calculated for parameters p and p in the beta-binomial distribution. The log-likelihood of all loci is calculated with pˆ and pˆ, generating their average value.
Support vector machine model
After generating features, a classification method determines whether a sample is from a single or multiple contributors. Utilizing the e1071 R package [30], an SVM model is applied because of the complexity of pattern recognition within the feature space [31]. The SVM method fits a hyperplane between single and multiple contributor regions for optimal classification determination. Since a linear model is not guaranteed, the Gaussian radial basis function (RBF) kernel is used to avoid parametric assumptions. As
Table 3: Classification model features and their descriptions
|
Name |
Description |
|
LOH |
Het/Hom, the ratio of heterozygous and homozygous markers within a sample |
|
HomRate |
The percentage of the loci in the HomRate region |
|
HighRate |
The percentage of the loci in the HighRate region |
|
HetRate |
The percentage of the loci in the HetRate region |
|
LowRate |
The percentage of the loci in the LowRate region |
|
HomVar |
The variance of allele frequencies in the HomRate region |
|
HetVar |
The variance of allele frequencies in the HetRate region |
part of the SVM analysis, the cost and gamma parameters are tuned using the parallel searching method. A grid search is conducted on an exponentially growing sequence of cost and gamma parameters to find optimized paired values. The estimated parameters may differ depending on the training data set.
R package: Variant Quality Investigation Helper
Our novel approach detects same-species or within- species contamination using BAF from only variant call information. The contamination detection procedure comprises the following steps, also outlined in Figure 5:
Step 1: The VCF generated by a variant caller is read into R using the vanquish:: read_vcf function. The supported variant callers are GATK, VarDict, and strelka2.
Step 2: CNV regions in the VCF file are detected and filtered
using the vanquish:: update_vcf function.
Step 3: Features for the radial kernel SVM model are extracted from each sample using the vanquish::generate_ feature function.
Step 4: Parameter cost and gamma for kernel SVM are tuned. Step 5: Contamination of a test sample is predicted.
The ability of our approach to determine contamination can be affected by two scenarios. First, normal-tumor samples comprising a mixture of tumor and normal cells from the same individual may be misclassified as contaminated. Second, for test samples of very low quality, it may be impossible to determine a clear BAF pattern, so they will not be considered contaminated.
Results of tests with simulated data
To apply our method in real data, we used two reference samples from the 1000 Genomes Project [32], NA12878 and NA10855, sequenced at Q2 Solutions. We obtained two pairs of FASTQ format files from sequencing results and resampled and mixed them to different proportions using seqtk [33],
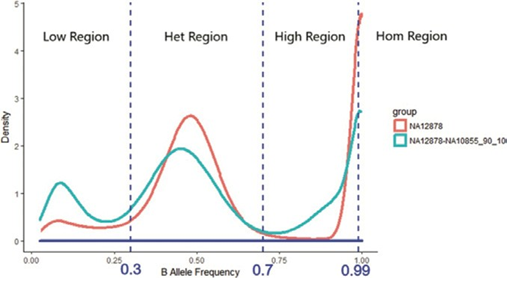
Figure 4: Allele frequency categorization. Allele frequency is categorized into four regions: low alternative allele frequency (LowRate), heterozygous alternative allele frequency (HetRate), high alternative allele frequency (HighRate), and homozygous alternative allele frequency (HomRate).
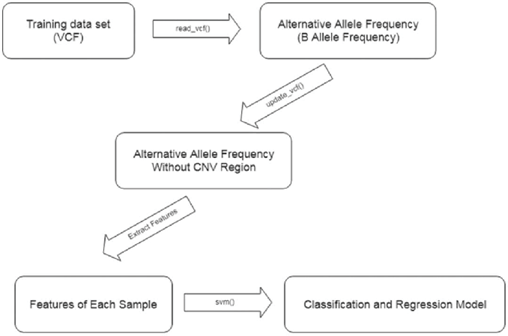
Figure 5: Contamination detection procedure steps.
as shown in Table 4. For this simulated test, we treated NA12878 as the sample and assumed that NA10855 was mixed into the NA12878 sample at percentages ranging from 0.5% to 20%. We calculated the detection rate for various levels of contamination. There was a total of 50 million reads for the six mixture samples. Contamination percentages above 5% were readily detected while lower percentages were not (Table 2). Accordingly, the detection analysis has sensitivity above 5% contamination. For contaminants with less similarity to the sample with which they are mixed, the detection sensitivity will be lower; on the other hand, for contaminants with greater similarity, contamination detection will be more challenging.
Results of tests with real data
After quantitative simulation testing, we applied the trained model in a set of real data comprising 22 samples. Table 5 displays the range of cell types and samples used, and the results. The samples are ranked by regression values from e1071::svm(). While predictions for 20 of the 22 samples were correct according to prior identification, two human-T- lymphoblast samples (see bold text in Table 5) were predicted as pure but were contaminated. In response, we checked the B-allele frequency distribution for these two samples (Figure 6). The middle area of the CNV pattern was shifted lower from 0.5 to 0.3, indicating the samples were tumor-normal
Table 4: Contamination detection for a simulated data series (M: million).
|
Sample Component |
Reads (NA12878) |
Reads (NA10855) |
Test Results |
|
NA12878 (80%) + NA10855 (20%) |
40M |
10M |
Contaminated |
|
NA12878 (90%) + NA10855 (10%) |
45M |
5M |
Contaminated |
|
NA12878 (95%) + NA10855 (5%) |
47.5M |
2.5M |
Contaminated |
|
NA12878 (97.5%) + NA10855 (2.5%) |
48.75M |
1.25M |
Pure |
|
NA12878 (99%) + NA10855 (1%) |
49.5M |
0.5M |
Pure |
|
NA12878 (99.5%) + NA10855 (0.5%) |
49.75M |
0.25M |
Pure |
Table 5: Contamination detection for a real-data series. Predictions for 20 of the 22 samples were correct according to prior identification. Two human T- lymphoblast samples (bold text) were predicted as pure but were contaminated.
|
Sample Name |
Classification |
Regression |
Prior Identification |
|
Human B-Lymphocyte L8 |
1 |
1.9243094 |
1 |
|
Human B-Lymphocyte 2 L20 |
1 |
1.9209875 |
1 |
|
Human Breast 2 L16 |
0 |
1.483925 |
0 |
|
Human Breast L4 |
0 |
1.463376 |
0 |
|
Human T-Lymphoblast 2 L21∗ |
0 |
1.3622305 |
1 |
|
Human T-Lymphoblast L9 |
0 |
1.3472358 |
1 |
|
Human Brain L3 |
0 |
1.3147938 |
0 |
|
Human Brain 2 L15 |
0 |
1.303287 |
0 |
|
Human Testis L12 |
0 |
1.245767 |
0 |
|
Human Cervix 2 L17 |
0 |
1.2429423 |
0 |
|
Human Testis 2 L24 |
0 |
1.2424441 |
0 |
|
Human Cervix L5 |
0 |
1.203943 |
0 |
|
Human Macrophage L10 |
0 |
1.158416 |
0 |
|
Human Macrophage 2 L22 |
0 |
1.1582528 |
0 |
|
Human Liver 2 L18 |
0 |
1.1442246 |
0 |
|
Human Liposarcoma L7 |
0 |
1.1406007 |
0 |
|
Human Liposarcoma 2 L19 |
0 |
1.132044 |
0 |
|
Human Skin 2 L23 |
0 |
1.1209464 |
0 |
|
Human Skin L11 |
0 |
1.1194772 |
0 |
|
Human Liver L6 |
0 |
1.1170909 |
0 |
|
Human Reference DNA Male L1 |
0 |
1.0945151 |
0 |
|
Human Reference DNA Male 2 L13 |
0 |
1.0906951 |
0 |
∗This is a mixture of tumor and normal cells. See Figure 4 for the B-allele frequency distribution of this sample.
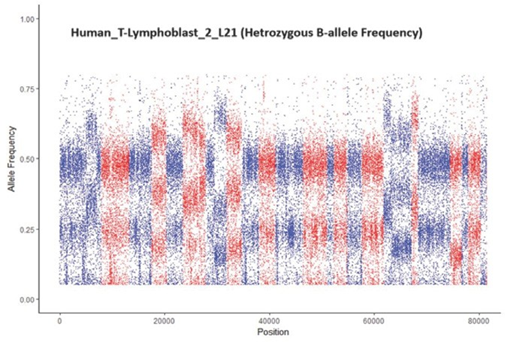
Figure 6: A sample that was incorrectly classified as pure by vanquish::defcon() but was contaminated. The CNV pattern is shifted lower from 0.5 to 0.3 because the sample was a mixture of tumor-normal cells from the same individual.
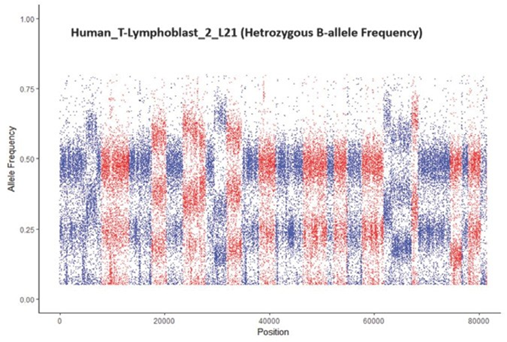
Figure 7: Degraded formalin-fixed paraffin-embedded (FFPE) tissue. This sample produced a false-positive prediction result because of the similarity of its features with those of contaminants.
cells from the same individual. The distance of the shift in the CNV pattern reflects the percentage of tumor and normal cells in a sample.
We tested the model with a second data set comprising
53 samples. Twelve samples were purposely mixed with a contaminant, and 41 samples were pure. The test results showed sensitivity > 99.99% and specificity of 90.24%. Four false-positive samples were detected by our method. These false positives were all in formalin-fixed paraffin- embedded (FFPE) tissue samples that were likely degraded (Figure 7). The false positives may be because the features generated from a degraded sample are similar to those from a contaminated sample.
Discussion
In this study, we introduce a novel strategy to detect same-species contamination using BAF from only variant call information. We produced an R package, vanquish:
Variant Quality Investigation Helper, for real-data applications. Results on simulated data with a range of contamination levels indicate that our method is sensitive to even low levels of contamination, with an extremely low false-positive rate. We followed up with additional analyses using real data on a range of tissue types, with different sample preparations. The results again indicate our method has excellent performance, with outstanding sensitivity and few false positives. Upon further inspection, the few false positives were from FFPE samples and likely occurred due to degradation of the samples.
The user-friendly R package enables rapid detection of same-species contamination. Uniquely, our tool performs this important quality control step from VCF files, resulting in improvements to performance and memory requirements. Figure 8 summarizes the run time of CNA region removal and feature generation (Hardware: Dell R820, 512GB of RAM). We ran five samples without a known change point 10 times each, with a uniform maximum number of runs of the algorithm, to determine the average run time. Following our expectation, larger samples require more run time for change- point detection and feature generation. Samples with more change points also require a longer run time.
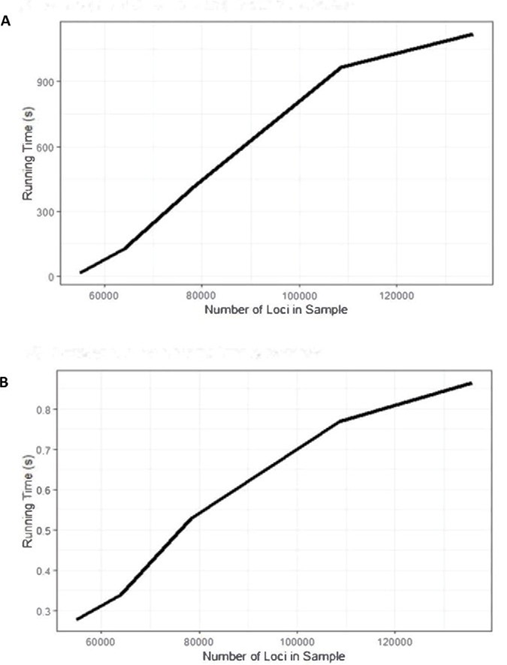
Figure 8: Run time of CNA region removal and feature generation with Dell R820 (512GB of RAM). A) Average run time for change- point detection. B) Average runtime for feature generation.
As demonstrated in our data analysis, for samples with both tumor and normal cells, a shift in the CNV distribution reflects the proportion of the cell types. Estimating the percentage of tumor cells within a sample is an active area of bioinformatics research [34]. In ongoing work, we are extending the method to produce quantitative estimates.
Conclusions
While cross-species contamination in NGS is well- studied, few approaches have been proposed for detecting same-species contamination. In the current study, we demonstrate a machine learning approach that uses reference samples to build an SVM that classifies samples as either pure or contaminated. The growing number of available reference genomes available through initiatives such as the 1000 Genomes Project allows end-users to readily access and download reference samples. We demonstrate the utility of our approach with both samples mixed in silico and samples mixed at the bench. Our method has excellent sensitivity, with controlled false positives across a range of contamination levels and tissue and cell types. One of the major advantages of our approach is that it can be performed after variant calling, allowing the user to interact efficiently with the VCF file only.
Acknowledgements
The authors would like to thank Dr. Chad Brown for discussion on same-species contamination and machine learning methods. The authors also thank Martin Buchkovich and Gunjan Hariani for assistance with the sequencing data and Hannah Collins Cakar for assistance with manuscript preparation.
Conflicts of interest: The authors declare they have no conflicts of interest.
References
- Merchant S, Wood DE, and Salzberg SL. Unexpected cross-species contamination in genome sequencing PeerJ 2 (2014): e675.
- van Dijk EL, Auger H, Jaszczyszyn Y, et Ten years of next generation sequencing technology. Trends in Genetics 30 (2014): 418-426.
- Patel RK, and Jain M. NGS QC Toolkit: a toolkit for quality control of next generation sequencing data. PloS One 7 (2012): e30619.
- Jun G, Flickinger M, Hetrick KN, et al. Detecting and estimating contamination of human DNA samples in sequencing and array-based genotype American Journal of Human Genetics 91 (2012): 839-848.
- Schmidt T, Hummel S, and Herrmann Evidence of contamination in PCR laboratory disposables. Naturwissenschaften 82 (1995): 423-431.
- Langdon Mycoplasma contamination in the 1000 Genomes Project. Biodata Mining 7 (2014):3.
- Simion P, Belkhir K, François C, et al. A software tool 'CroCo' detects pervasive cross-species contamination in next generation sequencing data. BMC Biology 16 (2018): 28.
- Korneliussen TS, Albrechtsen A, and Nielsen ANGSD: Analysis of Next Generation Sequencing Data. BMC Bioinformatics 15 (2014): 356.
- Laurence M, Hatzis C, and Brash Common contaminants in next-generation sequencing that hinder discovery of low-abundance microbes. PloS One 9 (2014): e97876.
- Schmieder R, and Edwards Fast identification and removal of sequence contamination from genomic and metagenomic datasets. PloS One 6 (2011): e17288.
- Strong MJ, Xu G, Morici L, et Microbial contamination in next generation sequencing: implications for sequence- based analysis of clinical samples. PLoS Pathogens 10 (2014): e1004437.
- Cibulskis K, McKenna A, Fennell T, et ContEst: estimating cross-contamination of human samples in next-generation sequencing data. Bioinformatics 27 (2011): 2601-2602.
- McKenna A, Hanna M, Banks E, et al. The Genome Analysis Toolkit: a MapReduce framework for analyzing next-generation DNA sequencing Genome Research 20 (2010): 1297-1303.
- Bergmann EA, Chen BJ, Arora K, et Conpair: concordance and contamination estimator for matched tumor-normal pairs. Bioinformatics 32 (2016): 3196- 3198.
- Sehn JK, Spencer DH, Pfeifer JD, et al. Occult specimen contamination in routine clinical next-generation sequencing American Journal of Clinical Pathology 144 (2015): 667-674.
- Clarke L, Zheng-Bradley X, Smith R, et al. The 1000 Genomes Project: data management and community Nature Methods 9 (2012): 459-462.
- Killick R and Eckley I. changepoint: An R package for changepoint analysis. Journal of Statistical Software 58 (2014): 1-19.
- Haynes K, Eckley IA and Fearnhead P. Efficient penalty search for multiple changepoint problems. arXiv preprint arXiv (2014):14123617.
- Byrd RH, Lu P, Nocedal J, et al. A limited memory algorithm for bound constrained SIAM Journal On Scientific Computing 16 (1995): 1190-1208.
- Cock PJ, Fields CJ, Goto N, et The Sanger FASTQ file format for sequences with quality scores, and the Solexa/ Illumina FASTQ variants. Nucleic Acids Research 38 (2010):1767-1771.
- Esteve-Codina A, Kofler R, Palmieri N, et al. Exploring the gonad transcriptome of two extreme male pigs with RNA-seq. BMC Genomics 12 (2011):
- Pickrell JK, Marioni JC, Pai AA, et al. Understanding mechanisms underlying human gene expression variation with RNA Nature 464 (2010): 768-772.
- Skelly DA, Johansson M, Madeoy J, et al. A powerful and flexible statistical framework for testing hypotheses of allele-specific gene expression from RNA- seq data. Genome Research 21 (2011): 1728-1737.
- Zhang S, Wang F, Wang H, et Genome-wide identification of allele-specific effects on gene expression for single and multiple individuals. Gene 533 (2014): 366-373.
- Chen J, Rozowsky J, Galeev TR, et A uniform survey of allele-specific binding and expression over 1000-Genomes-Project individuals. Nature Communications 7 (2016): 11101.
- Mayba O, Gilbert HN, Liu J, et al. MBASED: allele- specific expression detection in cancer tissues and cell Genome Biology 15 (2014): 405.
- Danecek P, Auton A, Abecasis G, et al. The variant call format and VCFtools. Bioinformatics 27 (2011): 2156-
- Morgan JE, Carr IM, Sheridan E, et al. Genetic diagnosis of familial breast cancer using clonal sequencing. Human Mutation 31 (2010): 484-491.
- Ku CS, Polychronakos C, Tan EK, et A new paradigm emerges from the study of de novo mutations in the context of neurodevelopmental disease. Molecular Psychiatry 18 (2013): 141-153.
- Meyer D, Dimitriadou E, Hornik K, et Package ‘e1071’. The R Journal (2019): 1-67.
- Cortes C, and Vapnik Support-vector networks. Machine Learning 20 (1995): 273-297.
- Auton A, Brooks LD, Durbin RM, et A global reference for human genetic variation. Nature 526 (2015): 68-74.
- Li seqtk Toolkit for processing sequences in FASTA/Q formats. GitHub 767 (2012): 69.
- Yadav VK, and De S. An assessment of computational methods for estimatin purity and clonality using genomic data derived from heterogeneous tumor tissue samples. Briefings in Bioinformatics 16 (2015): 232-241.


 Impact Factor: * 4.1
 Acceptance Rate: 74.74%
  Time to first decision: 10.4 days
  Time from article received to acceptance: 2-3 weeks