Estimation of the Fractal Dimension of Thyroid Nodules as a Complementary Diagnostic Tool for Predicting Malignancy
Philippe LOTHAIRE, MD1*, Pierrick UZUREAU, PhD2, Karim ZOUAOUI BOUDJELTA, PhD2, Nathalie NAGY, MD3, Carine MICHIELS, PhD4#, Timoteo CARLETTI, PhD5#
1Department of Head and Neck Surgery, CHU Charleroi, Belgium
2Laboratory of Experimental Medicine (ULB 222), Medicine Faculty, Université libre de Bruxelles, CHU Charleroi, Belgium
3Department of Pathology, CHU Charleroi, Belgium
4Department of Biology, URBC, NARILIS, UNamur, Belgium
5Department of Mathematics, Naxys, NARILIS, UNamur, Belgium
#These authors codirected equally this study
*Corresponding Author: Philippe LOTHAIRE, Department of Head and Neck Surgery, CHU Charleroi, 6110 Montigny le Tilleul, Belgium
Received: 18 November 2021; Accepted: 02 December 2021; Published: 03 January 2022
Article Information
Citation: Lothaire P, Uzureau P, Boudjelta Kz, Nagy N, Michiels C, Carletti T. Estimation of the fractal dimension of thyroid nodules as a complementary diagnostic tool for predicting malignancy. Journal of Cancer Science and Clinical Therapeutics 6 (2022): 1-15.
View / Download Pdf Share at FacebookAbstract
Rationale and objectives: Ultrasound-guided fine-needle aspiration is the most sensitive investigation procedure in the evaluation of patients with thyroid nodules; however, despite the level of achieved precision, it is still impossible to preoperatively discriminate between follicular adenomas and carcinomas. Thus, no current detection tool of thyroid nodule has both high sensitivity and high positive predictive value for the diagnosis of thyroid cancer. Ultrasound images provide information that are currently missed due to visual interpretation, including the roughness of the echotexture. However, such information can be retrieved using the measurement of the fractal dimension (FD).
Materials and methods: This retrospective study was approved by the ethic committee of CHU Charleroi. According to the boxcounting method, we measured the FD of the echotexture of ultrasound images of 13 benign thyroid nodules and 14 malignant thyroid nodules compared to normal thyroid tissue from 10 men and 16 women (mean age 40).
Results: The difference of the FD value between malignant nodules (median FD 2.31) and corresponding normal tissues (median FD 2.184) was significant (p<0.001) while the FD values for the benign nodules (median FD 2.21) and for corresponding normal tissues (median FD 2.231) could not be distinguished (p=0.78).
Conclusion: This preliminary work revealed that FD would be an additional feature to discriminate benign from malignant nodules. A larger sampling is now required to confirm the possible utilization of FD in the thyroid cancer diagnosis in clinical practice.
Keywords
Cancer; Fractal dimension; Image analysis; Thyroid nodules; Ultrasonography
Cancer articles; Fractal dimension articles; Image analysis articles; Thyroid nodules articles; Ultrasonography articles
Thyroid cancer articles Thyroid cancer Research articles Thyroid cancer review articles Thyroid cancer PubMed articles Thyroid cancer PubMed Central articles Thyroid cancer 2023 articles Thyroid cancer 2024 articles Thyroid cancer Scopus articles Thyroid cancer impact factor journals Thyroid cancer Scopus journals Thyroid cancer PubMed journals Thyroid cancer medical journals Thyroid cancer free journals Thyroid cancer best journals Thyroid cancer top journals Thyroid cancer free medical journals Thyroid cancer famous journals Thyroid cancer Google Scholar indexed journals Fractal dimension articles Fractal dimension Research articles Fractal dimension review articles Fractal dimension PubMed articles Fractal dimension PubMed Central articles Fractal dimension 2023 articles Fractal dimension 2024 articles Fractal dimension Scopus articles Fractal dimension impact factor journals Fractal dimension Scopus journals Fractal dimension PubMed journals Fractal dimension medical journals Fractal dimension free journals Fractal dimension best journals Fractal dimension top journals Fractal dimension free medical journals Fractal dimension famous journals Fractal dimension Google Scholar indexed journals Image analysis articles Image analysis Research articles Image analysis review articles Image analysis PubMed articles Image analysis PubMed Central articles Image analysis 2023 articles Image analysis 2024 articles Image analysis Scopus articles Image analysis impact factor journals Image analysis Scopus journals Image analysis PubMed journals Image analysis medical journals Image analysis free journals Image analysis best journals Image analysis top journals Image analysis free medical journals Image analysis famous journals Image analysis Google Scholar indexed journals Thyroid nodules articles Thyroid nodules Research articles Thyroid nodules review articles Thyroid nodules PubMed articles Thyroid nodules PubMed Central articles Thyroid nodules 2023 articles Thyroid nodules 2024 articles Thyroid nodules Scopus articles Thyroid nodules impact factor journals Thyroid nodules Scopus journals Thyroid nodules PubMed journals Thyroid nodules medical journals Thyroid nodules free journals Thyroid nodules best journals Thyroid nodules top journals Thyroid nodules free medical journals Thyroid nodules famous journals Thyroid nodules Google Scholar indexed journals Ultrasonography articles Ultrasonography Research articles Ultrasonography review articles Ultrasonography PubMed articles Ultrasonography PubMed Central articles Ultrasonography 2023 articles Ultrasonography 2024 articles Ultrasonography Scopus articles Ultrasonography impact factor journals Ultrasonography Scopus journals Ultrasonography PubMed journals Ultrasonography medical journals Ultrasonography free journals Ultrasonography best journals Ultrasonography top journals Ultrasonography free medical journals Ultrasonography famous journals Ultrasonography Google Scholar indexed journals small papillary cancers articles small papillary cancers Research articles small papillary cancers review articles small papillary cancers PubMed articles small papillary cancers PubMed Central articles small papillary cancers 2023 articles small papillary cancers 2024 articles small papillary cancers Scopus articles small papillary cancers impact factor journals small papillary cancers Scopus journals small papillary cancers PubMed journals small papillary cancers medical journals small papillary cancers free journals small papillary cancers best journals small papillary cancers top journals small papillary cancers free medical journals small papillary cancers famous journals small papillary cancers Google Scholar indexed journals malignant nodules articles malignant nodules Research articles malignant nodules review articles malignant nodules PubMed articles malignant nodules PubMed Central articles malignant nodules 2023 articles malignant nodules 2024 articles malignant nodules Scopus articles malignant nodules impact factor journals malignant nodules Scopus journals malignant nodules PubMed journals malignant nodules medical journals malignant nodules free journals malignant nodules best journals malignant nodules top journals malignant nodules free medical journals malignant nodules famous journals malignant nodules Google Scholar indexed journals follicular adenomas articles follicular adenomas Research articles follicular adenomas review articles follicular adenomas PubMed articles follicular adenomas PubMed Central articles follicular adenomas 2023 articles follicular adenomas 2024 articles follicular adenomas Scopus articles follicular adenomas impact factor journals follicular adenomas Scopus journals follicular adenomas PubMed journals follicular adenomas medical journals follicular adenomas free journals follicular adenomas best journals follicular adenomas top journals follicular adenomas free medical journals follicular adenomas famous journals follicular adenomas Google Scholar indexed journals carcinomas articles carcinomas Research articles carcinomas review articles carcinomas PubMed articles carcinomas PubMed Central articles carcinomas 2023 articles carcinomas 2024 articles carcinomas Scopus articles carcinomas impact factor journals carcinomas Scopus journals carcinomas PubMed journals carcinomas medical journals carcinomas free journals carcinomas best journals carcinomas top journals carcinomas free medical journals carcinomas famous journals carcinomas Google Scholar indexed journals echotexture articles echotexture Research articles echotexture review articles echotexture PubMed articles echotexture PubMed Central articles echotexture 2023 articles echotexture 2024 articles echotexture Scopus articles echotexture impact factor journals echotexture Scopus journals echotexture PubMed journals echotexture medical journals echotexture free journals echotexture best journals echotexture top journals echotexture free medical journals echotexture famous journals echotexture Google Scholar indexed journals
Article Details
1. Introduction
Thyroid cancer remains rare but its incidence increased due to the better detection of small papillary cancers [1]. Thus, Ultrasound (US) imaging of the thyroid is increasingly performed and can detect nodules as small as 0.2 cm [2]. Sonographic features for discriminating benign and malignant nodules have been extensively studied but no single parameter satisfactorily identifies the subset of patients which diagnosis requires the Fine-Needle Aspiration Biopsy (FNAB) [3]. The Thyroid Imaging Reporting and Data System (TIRADS) is a standardized tool designed to avoid unnecessary FNAB [4]. The TIRADS implements a large number of US patterns (echogenicity, echostructure, shape, borders, calcifications, vascularization) to improve the clinical power of US to discriminate nodules. However even with such standardization, the inter-individual variability among radiologists and the use of different US devices impairs the reproducibility of the conclusions [5,6]. Similarly, ultrasound elastography which analyses the stiffness of the nodules could discriminate malignant from benign lesions but this technique requires an additional procedure and lacks reproducibility [7]. Papillary and follicular thyroid carcinomas are well-differentiated thyroid carcinomas and represent about 95% of all thyroid cancers. While US discrimination between benign and malign nodules has been reported in the case of papillary carcinoma, the sonographic features of follicular adenoma and follicular carcinoma are very similar and as a consequence, follicular carcinoma diagnosis using US is still challenging [8].
Fractal analysis has already many applications in the field of medicine; one of them is the analysis of anatomic structures such as vascular or bronchial trees [9] or the haemodynamic effects of several types of diseases [10,11]. A fractal structure is characterized by a Fractal Dimension (FD) allowing for a quantitative assessment of parameters such as heterogeneity, irregularity or complexity. Several image analysis techniques have been published in order to characterize pathological tissues such as abnormal liver tissue or endobronchial nodes [12,13]. Hereby, we computed the FD of ultrasound images in order to determine if differences between normal tissue, benign and malignant thyroid nodules could be evidenced. The image requirements to draw accurate results are also investigated.
2. Material and Methods
2.1. Clinical data
All US thyroid images were retrospectively reviewed with approval of the ethic committee from CHU Charleroi (OM008) under Eudract B325201526259. As a retrospective study, there was no need to obtain informed consent. US examinations were performed by 4 different experienced radiologists, using Siemens ACUSON Antares, Philips iU22 and Philips EPIQ 5G ultrasound systems, with 5 to 12 MHz multifrequency probes. The images corresponded to 2 group of patients. The first group of 13 patients with thyroid follicular carcinoma underwent a total thyroidectomy at the CHU Vésale from July 2009 to September 2013 (Table 1). There were 7 females and 6 males; the median age was 39.6 (from 10 to 69 years) and 1 patient had 2 malignant nodules. FNAB was performed in 10 cases but cancer was never diagnosed preoperatively. Definitive histopathology was reviewed by one experienced endocrine pathologist. The second group of 11 patients underwent a thyroid loboisthmectomy for a single benign unilateral nodule between November 2010 and July 2014 (Table 2). There were 8 females and 3 males; the median age was 41.2 (from 17 to 54 years). Two supplementary benign nodules were identified in the contralateral lobe of the thyroid of 2 patients from the first group operated for malignant nodule (patients n° 1 and 4, see Table 1). FNAB was performed preoperatively for the 11 single nodules.
2.2. Image analyses
Original native images, issued from the database, were recorded in Tagged Image File Format (TIFF). Due to technical limitations of Matlab algorithms, images were converted to JPEG format with minimum compression. Sizes of all images are displayed in table 2. When multiple images were available, selection was performed as follow. Images where the zone of interest was partly masked by annotations were excluded. The image showing the largest view of the zone of interest was selected for further analysis. The algorithm used for the measure of the FD (see Supplemental Material) was based on the Matlab software programming language and the Image Processing Toolbox (http://nl.mathworks.com/). The original image was converted to gray-scale and cropped to restrict the analysis to the relevant zone. The FD was calculated using the box-counting method (14): the principle is to cover an image J with a grid whose mesh size is hereby name r, to count the number N of boxes which are covering the object and repeat the calculation by shrinking the size (r) of the boxes. The FD of an image is defined as D = limr >0 log(Nr)/log(1/r). The image normalization to 256 gray levels determined the “height” of the image, seen as a fractal embedded in a 3D space (Figure 1). The quantity Nr is thus the number of boxes needed to cover such a fractal surface.
Table 1: Clinical data and corresponding image information (malignant nodule group).
Table 2: Clinical data and corresponding image information (benign nodule group).
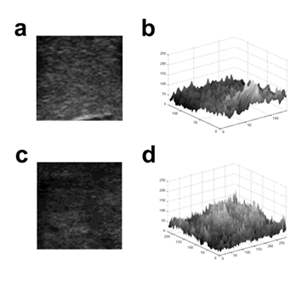
Figure 1: Conversion of 2D US image into 3D surface Lothair, et al.
Images of benign (a) and malignant nodules (c) were converted into 3D surface using gray values of pixels (b and d respectively) for fractal analysis.
2.3. Data analyses
Statistical analyses of differences of FD between normal thyroid tissue and benign nodules on the one hand and normal thyroid tissue and malignant nodules on the other hand were performed with the Wilcoxon signed rank test.
3. Results
3.1. Algorithm design and validation on reference images
We have developed dedicated algorithm which approximated the FD of a given image using the box-counting method. We benchmarked the algorithm on synthetic images whose FD is explicitly computable, namely the Sierpinski triangle (log3/log2 = 1.585), the Sierpinski carpet (log8/log3 = 1.8928) and the dragon curve (log 2/log √2 = 2) and on the D03 texture image from the Brodatz album which estimated FD ranged from 2.60 to 2.69 [15] (Figure 2). The FD values of the Sierpinski triangle, the Sierpinski carpet and the dragon curve measured by the algorithm strictly corresponded to the theoretical values (Figure 3). The FD value of 2.66 measured for the D03 Brodatz image was within the previously published range [15] (Figure 3).
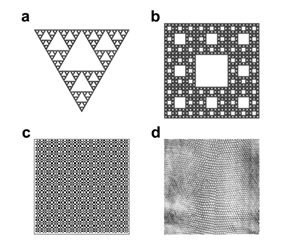
Figure 2: Figures selected to validate the algorithm Lothaire, et al.
(a) The Sierpinski triangle was built starting from a full equilateral triangle, divided into 4 equals smaller triangles and then, removing the “central one”. Iterating this process yields a structure whose theoretical FD is 1.585. (b) The Sierpinski carpet was obtained by dividing a square into 9 smaller squares and then removing the “central one”. The structure obtained by iterating the previous construction will have a theoretical FD of 1.89. (c) The Dragon curve is a space-filling curve with a theoretical FD of 2.0. (d) The grayscale texture D03 which belongs to the standard Brodatz texture album has a FD varying from 2.60 till 2.69 [15].
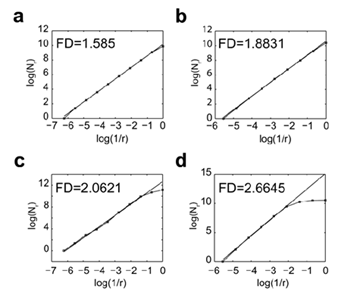
Figure 3: Measurement of the FD of reference images using the algorithm Lothaire, et al.
The FD values of the Sierpinski triangle (a), the Sierpinski carpet (b), the Dragon curve (c) and the Brodatz D03 texture (d) were calculated using the box counting method. The number of boxes (N) required to cover the whole image is plotted against the reduction factor (r) of the box sizes between each iteration of the analysis. The linear best fit of the log(N) = f (log(1/r)) curve whose slope corresponds to the FD is represented.
3.2. Algorithm validation according the size of images
When assayed on the Brodatz D03 texture image using different resolutions, the algorithm gave reproducible and reliable values of the FD of the image (Figure 4a). This suggested that the reduction of the resolution did not affect the result of the computed FD. We also observed that reducing the image size altered the accuracy of the FD measure which reached a plateau when image surface was greater than 10 000 pixels2 (Figure 4a). When using the same image with different H/L ratio, we observed that a minimum height of 80 pixels was required for accurate FD measurement (Figure 4b). Image size limitations were confirmed on US images of normal tissue (Figure 5a), benign nodule (Figure 5b) and a malignant nodule (Figure 5c) at different sizes. The threshold value for the size of the image required to limit FD variability to 5% started at 7 000 pixels2 for the normal tissue and 10 000 pixels2 for both nodules (Figure 5d).
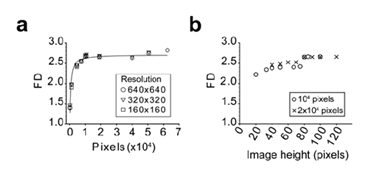
Figure 4: Assessment of the method limits using the Brodatz D03 texture image Lothaire, et al.
The importance of the image size (a) and the height over length ratio (b) was evaluated. The image was iteratively and symmetrically fractionated in smaller parts and the FD of each fragment was calculated using the algorithm. The mean FD is plotted against the fragment image size (a) or image height (b). In panel A, the Brodatz D03 texture was analyzed using different starting resolution as indicated. In panel B, image fragments from the 640x640 image were analyzed as indicated.
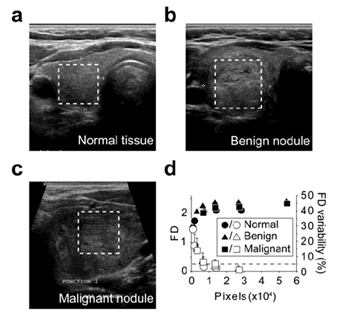
Figure 5: Assessment of the method using the US images Lothaire, et al.
FD was calculated using images of normal thyroid tissue (a), benign nodule (b) and malignant nodule (c). The boxed regions within the full size US (a,b,c) indicate the areas selected for FD calculation (d). The so-obtained images (a : 169x168; b : 228x238; c : 125x128) were iteratively and symmetrically fractionated and the FD of each fragment was calculated using the algorithm. The mean FD is plotted (solid symbols) against the fragment image size (d). The standard deviations of the FD are indicated. Open symbols represent the mean delta between the FD of the fragments and the FD of the full size area (last solid symbol). The error bar on open symbols correspond to the maximum delta. The dashed line represents the 5% variability level.
3.3. FD calculation of thyroid US images
The FD of the images of 13 benign thyroid nodules, 14 malignant thyroid nodules and the neighbouring normal thyroid tissues was calculated using the algorithm (Tables 1&2). The median FD of images corresponding to benign nodules was 2.2146 (2.146/2.251) and, the median FD of malignant nodules, 2.310 (2.259/2.361).The median FD of the corresponding normal thyroid tissues were 2.231 (2.098/2.288 [25%/75%]) and 2.184 (2.117/2.235 [25%/75%]) respectively. While the FD of benign nodules was not statistically different from the FD of the corresponding normal tissue (p=0.78; Figure 6a), the FD of malignant nodules was statistically different from normal tissue (p<0.001; Figure 6b).
The Delta FD calculated as the FD of the nodules minus the FD the corresponding normal tissue is presented in figure 6c. While the Delta FD of all the malignant nodules of the present study were strictly positive, the Delta FD of the benign nodules were evenly distributed around the zero value (Figure 6c).
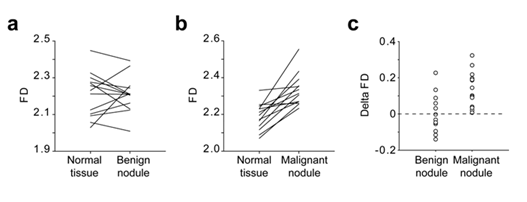
Figure 6: Comparison of the FD of normal thyroid tissue, benign nodule and malignant nodule Lothaire et al.
US images from patients with benign nodules (a; n=13) and malignant nodules (b; n=14) were analysed using the algorithm. The FD of each nodule was compared to the FD of the adjacent normal tissue. The Delta FD between the FD of the nodules and the FD of the corresponding normal tissue was calculated as follow FD = FDnodule-FDnormal and plotted in panel c.
4. Discussion
A thyroid US is recommended in the assessment of any suspected thyroid nodule detected by palpation or another imaging modality (computed tomography, magnetic resonance imaging, 18F- fluorodeoxyglucose positron emission tomography, technetium Tc 99m sestamibi scan) [16-18]. Echogenicity of homogeneous normal thyroid parenchyma appears increased in relation to the adjacent muscles but the echotexture of a nodule may be homogeneous or heterogeneous and is not a helpful finding in distinguishing malignant nodules from benign nodules [19]. Thus, no differences between the US features (size and echogenicity) of benign and malignant nodules have been reported to date [20]. Although the majority of papillary carcinoma are currently diagnosed by US and cytological findings of FNAB, the preoperative discrimination between benign and malignant follicular tumour is still difficult [21]. As it is the less frequent of the differentiated thyroid carcinomas, the sample size of the present retrospective study was restricted to 13 benign and 14 malignant nodules only.
Using the simple and cost-effective thyroid US, we made use of the fractal dimension of the US images in order to discriminate benign and malignant nodules using the objective measure of the FD. Other techniques have previously been used in order to improve the discriminatory power of the US. Shao and col. [22] suggested that the combination of ultrasonic scores and elasticity scores could be an alternative to obtain higher sensitivity and specificity in the diagnosis of malignant thyroid nodules. However, the results rely on the observer's experience. Similarly, Acoustic Radiation Force Impulse (ARFI), a newer ultrasound elastography technique that evaluates the tissue stiffness qualitatively and quantitatively, seems to be helpful to predict malignant thyroid lesions but has many limitations due to technical factors [23,24]. Unfortunately, only a minority of follicular carcinomas are included in these studies. Here, because echographic examinations were performed on standard US devices and by different radiologists, the images selected for the studies were unlikely to be observer-dependent and the procedure could be easily applied in any care center.
Our analysis pointed at the importance of the size of the images and the existence of a threshold value for the size of the image as a whole and for the length of each side, threshold beyond which the value of the measured FD was stable and close to the known FD value in the case of the reference images. Using the algorithm, the threshold varied between images, being around 7 000 pixels2 for homogeneous images (normal thyroid tissue) and 10 000 pixels2 for heterogeneous images (benign and malignant nodules). The minimal values of surface and length reported here are easily achievable in clinical practice using regular US devices. In this study, we reported the increased FD value of malignant thyroid nodules compared to normal tissue, while benign nodules and normal tissue could not be distinguished using this parameter. We postulated that the grayscale levels of each pixel would bring supplementary information and therefore should not be discarded. Therefore, we chose to convert the 2D US image to the 3D object that includes information about each pixel gray level. The main advantage of such a procedure is the lack of preliminary transformation of the image on contrary to previous reports that focused on objects boundaries [12,25]. Our strategy has proven accurate on reference images. Finally, our observation is in accordance to the fact that the rougher the appearance of the image, the larger the FD value, which fitted with the qualitative examination of the US images.
Nevertheless, since FD is not able to completely capture the complexity of a image, two different objects may have an identical FD. Therefore inter-sample comparison was not meaningful and the comparison of normal and pathologic tissues is mandatory for an accurate evaluation of the malignancy of the nodule.The Delta FD between nodule and normal tissue is a promising candidate for diagnostic purpose. Thus, in the present study, only benign nodules showed a negative Delta FD and we could have identified 61% of the studied benign nodules using this threshold. The preliminary results of this study showed that FD could be an additional discriminating feature between benign and malignant thyroid nodules. Further work will implement these first results on a broad scale by evaluating the algorithm on a larger database of native thyroid US images and correlating our findings with the known US patterns
References
- Davies L, Welch HG. Increasing incidence of thyroid cancer in the United States, 1973- 2002. JAMA 295 (2006): 2164-2167.
- Wiest PW, Hartshorne MF, Inskip PD, et al. Thyroid palpation versus high-resolution thyroid ultrasonography in the detection of nodules. J Ultrasound Med 17 (1998): 487-496.
- Cappelli C, Castellano M, Pirola I, et al. The predictive value of ultrasound findings in the management of thyroid nodules. QJM 100 (2007): 29-35.
- Kwak JY, Han KH, Yoon JH, et al. Thyroid imaging reporting and data system for US features of nodules: a step in establishing better stratification of cancer risk. Radiology 260 (2011): 892-899.
- Kwak JY, Jung I, Baek JH, et al. Image reporting and characterization system for ultrasound features of thyroid nodules: multicentric Korean retrospective study. Korean J Radiol 14 (2013): 110-117.
- Friedrich-Rust M, Meyer G, Dauth N, et al. Interobserver Agreement of Thyroid Imaging Reporting and Data System (TIRADS) and Strain Elastography for the Assessment of Thyroid Nodules. PLoS One 8 (2013): 77927.
- Merino S, Arrazola J, Cardenas A, et al. Utility and interobserver agreement of ultrasound elastography in the detection of malignant thyroid nodules in clinical care. AJNR Am J Neuroradiol 32 (2011): 2142-2148.
- Sillery JC, Reading CC, Charboneau JW, et al. Thyroid follicular carcinoma: sonographic features of 50 cases. AJR Am J Roentgenol 194 (2010): 44-54.
- Kamiya A, Takahashi T. Quantitative assessments of morphological and functional properties of biological trees based on their fractal nature. J Appl Physiol (1985) 102 (2007): 2315-2323.
- Karshafian R, Burns PN, Henkelman MR. Transit time kinetics in ordered and disordered vascular trees. Phys Med Biol 48 (2003): 3225-3237.
- Grauslund J, Green A, Kawasaki R, et al. Retinal vascular fractals and microvascular and macrovascular complications in type 1 diabetes. Ophthalmology 117 (2010): 1400-1405.
- Fiz JA, Monte-Moreno E, Andreo F, et al. Fractal dimension analysis of malignant and benign endobronchial ultrasound nodes. BMC Med Imaging 14 (2014): 22.
- Lee WL. A robust algorithm for the fractal dimension of images and its applications to the classification of natural images and ultrasonic liver images. Signal Processing 90 (2010): 1894- 1904.
- Li J, Du Q, Sun C. An improved box-counting method for image fractal dimension estimation. Pattern Recognition 42 (2009): 2460-2469.
- Novianto S, Suzuki Y, Maeda J. Near optimum estimation of local fractal dimension for image segmentation. Pattern Recognition Letters 24 (2003): 365-374.
- Gharib H, Papini E, Valcavi R, et al. American Association of Clinical Endocrinologists and Associazione Medici Endocrinologi medical guidelines for clinical practice for the diagnosis and management of thyroid nodules. Endocr Pract 12 (2006): 63-102.
- Bastin S, Bolland MJ, Croxson MS. Role of ultrasound in the assessment of nodular thyroid disease. J Med Imaging Radiat Oncol 53(2009): 177-187.
- Pacini F, Castagna MG, Brilli L, et al. Differentiated thyroid cancer: ESMO clinical recommendations for diagnosis, treatment and follow-up. Ann Oncol 20 (2009): 143-146.
- Moon WJ, Jung SL, Lee JH, et al. Benign and malignant thyroid nodules: US differentiation--multicenter retrospective study. Radiology 247 (2008): 762-770.
- Samulski TD, Shutty C, LiVolsi VA, et al. The reliability of thyroid nodule ultrasound features and size to predict malignancy in fine needle aspiration specimens: Practical utility for the evaluating pathologist. Diagn Cytopathol 43 (2015): 471-477.
- Miyakawa M, Onoda N, Etoh M, et al. Diagnosis of thyroid follicular carcinoma by the vascular pattern and velocimetric parameters using high resolution pulsed and power Doppler ultrasonography. Endocr J 52 (2005): 207-212.
- Shao J. Ultrasound scoring in combination with ultrasound elastography for differentiating benign and malignant thyroid nodules. Clinical Endocrinology 83 (2014): 254-260 .
- Zhuo J, Ma Z, Fu WJ, et al. Differentiation of benign from malignant thyroid nodules with acoustic radiation force impulse technique. Br J Radiol 87 (2014): 20130263.
- Xu JM, Xu XH, Xu HX, et al. Conventional US, US elasticity imaging, and acoustic radiation force impulse imaging for prediction of malignancy in thyroid nodules. Radiology 272 (2014): 577-586.
- Kikuchi A, Kozuma S, Sakamaki K, et al. Fractal tumor growth of ovarian cancer: sonographic evaluation. Gynecol Oncol 87 (2002): 295-302.


 Impact Factor: * 4.1
 Acceptance Rate: 74.74%
  Time to first decision: 10.4 days
  Time from article received to acceptance: 2-3 weeks