Nutritional Assessment of HIV/AIDS patients in Centre Region of Cameroon: A pilot study
Fokam Fossoh D. Perpetue1*, Kotue Taptue Charles2, Pieme Constant Anatole1
1Laboratory of Biochemistry, Physiology and Pharmacology, Faculty of Medicine and Biomedical Sciences/University of Yaounde 1, Cameroon
2Laboratory of Food Science and Metabolism, Department of Biochemistry, Faculty of Sciences, University of Yaounde 1, Cameroon
*Corresponding Author: Fokam Fossoh D. Perpetue, MD, MSc, Laboratory of Biochemistry, Physiology and Pharmacology, Faculty of Medicine and Biomedical Sciences/University of Yaounde 1, Cameroon
Received: 15 April 2021; Accepted: 22 April 2021; Published: 26 April 2021
Article Information
Citation: Fokam Fossoh D. Perpetue, Kotue Taptue Charles, Pieme Constant Anatole. Nutritional Assessment of HIV/AIDS patients in Centre Region of Cameroon: A pilot study. Journal of Food Science and Nutrition Research 4 (2021): 77-93.
DOI: 10.26502/jfsnr.2642-11000064
View / Download Pdf Share at FacebookAbstract
Optimal nutrition is critical to minimize the susceptibility to opportunistic infections and HIV/AIDS progression. We assessed the nutritional status of people with HIV/AIDS living in Centre Region of Cameroon to help filling the knowledge gap in adult patients care. Cross-sectional analysis of 82 adults patients between 21 and 39 years old with an undetectable viral load at Saint Martin de Porrès Hospital in Yaounde was conducted. Body weight, height, waist and hip circumferences were measured for anthropometric variables. Plasma and serum total proteins, albumin, globulin, CD4 count were determined in blood samples. Patients provided 7-day food records for nutrients intakes. 56.1% of participants had received nutritional counselling. Undernutrition represented 8.5%. Obesity (11%) was concerning only women. Abdominal obesity was high (60.8%). Food consumption score was acceptable for 97.5%. Food diversity score was average for 51.9%. Participants had higher daily consumption of proteins (74.03[51-97.87] g) and carbohydrates (261.96 ± 107.38 g). Daily fats intake (70.31 ± 29.42 g) was normal for women. Total energy was lower (2012 ± 773.82 kcal) than needed. Plasma proteins (70.37 ± 9.70 g/L), serum proteins (70.24 ± 9.90 g/L), albumin (39.23 ± 9.58 g/L), globulins (31.00 ± 11.72 g/L), CD4 T cells (475.50 [273.75-692.00]/µL) were normal. Our findings suggest that, although the participants maintained a normal weight, their food intake was not enough adequate for nutrients needs. This could contribute to worsening HIV/AIDS progression. There is a need for development of effective strategies to improve nutritional status of people with HIV/AIDS, using locally available foods.
Keywords
Nutritional status, HIV/AIDS, Adults, Cameroon
Nutritional status articles; HIV/AIDS articles; Adults articles; Cameroon articles
Nutritional status articles Nutritional status Research articles Nutritional status review articles Nutritional status PubMed articles Nutritional status PubMed Central articles Nutritional status 2023 articles Nutritional status 2024 articles Nutritional status Scopus articles Nutritional status impact factor journals Nutritional status Scopus journals Nutritional status PubMed journals Nutritional status medical journals Nutritional status free journals Nutritional status best journals Nutritional status top journals Nutritional status free medical journals Nutritional status famous journals Nutritional status Google Scholar indexed journals HIV articles HIV Research articles HIV review articles HIV PubMed articles HIV PubMed Central articles HIV 2023 articles HIV 2024 articles HIV Scopus articles HIV impact factor journals HIV Scopus journals HIV PubMed journals HIV medical journals HIV free journals HIV best journals HIV top journals HIV free medical journals HIV famous journals HIV Google Scholar indexed journals AIDS articles AIDS Research articles AIDS review articles AIDS PubMed articles AIDS PubMed Central articles AIDS 2023 articles AIDS 2024 articles AIDS Scopus articles AIDS impact factor journals AIDS Scopus journals AIDS PubMed journals AIDS medical journals AIDS free journals AIDS best journals AIDS top journals AIDS free medical journals AIDS famous journals AIDS Google Scholar indexed journals Adults articles Adults Research articles Adults review articles Adults PubMed articles Adults PubMed Central articles Adults 2023 articles Adults 2024 articles Adults Scopus articles Adults impact factor journals Adults Scopus journals Adults PubMed journals Adults medical journals Adults free journals Adults best journals Adults top journals Adults free medical journals Adults famous journals Adults Google Scholar indexed journals antiretroviral therapy articles antiretroviral therapy Research articles antiretroviral therapy review articles antiretroviral therapy PubMed articles antiretroviral therapy PubMed Central articles antiretroviral therapy 2023 articles antiretroviral therapy 2024 articles antiretroviral therapy Scopus articles antiretroviral therapy impact factor journals antiretroviral therapy Scopus journals antiretroviral therapy PubMed journals antiretroviral therapy medical journals antiretroviral therapy free journals antiretroviral therapy best journals antiretroviral therapy top journals antiretroviral therapy free medical journals antiretroviral therapy famous journals antiretroviral therapy Google Scholar indexed journals international cuisines articles international cuisines Research articles international cuisines review articles international cuisines PubMed articles international cuisines PubMed Central articles international cuisines 2023 articles international cuisines 2024 articles international cuisines Scopus articles international cuisines impact factor journals international cuisines Scopus journals international cuisines PubMed journals international cuisines medical journals international cuisines free journals international cuisines best journals international cuisines top journals international cuisines free medical journals international cuisines famous journals international cuisines Google Scholar indexed journals meat articles meat Research articles meat review articles meat PubMed articles meat PubMed Central articles meat 2023 articles meat 2024 articles meat Scopus articles meat impact factor journals meat Scopus journals meat PubMed journals meat medical journals meat free journals meat best journals meat top journals meat free medical journals meat famous journals meat Google Scholar indexed journals nutrition counselling articles nutrition counselling Research articles nutrition counselling review articles nutrition counselling PubMed articles nutrition counselling PubMed Central articles nutrition counselling 2023 articles nutrition counselling 2024 articles nutrition counselling Scopus articles nutrition counselling impact factor journals nutrition counselling Scopus journals nutrition counselling PubMed journals nutrition counselling medical journals nutrition counselling free journals nutrition counselling best journals nutrition counselling top journals nutrition counselling free medical journals nutrition counselling famous journals nutrition counselling Google Scholar indexed journals diabetes mellitus articles diabetes mellitus Research articles diabetes mellitus review articles diabetes mellitus PubMed articles diabetes mellitus PubMed Central articles diabetes mellitus 2023 articles diabetes mellitus 2024 articles diabetes mellitus Scopus articles diabetes mellitus impact factor journals diabetes mellitus Scopus journals diabetes mellitus PubMed journals diabetes mellitus medical journals diabetes mellitus free journals diabetes mellitus best journals diabetes mellitus top journals diabetes mellitus free medical journals diabetes mellitus famous journals diabetes mellitus Google Scholar indexed journals
Article Details
1. Introduction
The expansion of the availability of antiretroviral therapy (ART) in Cameroon has revolutionized the treatment of patients affected with human immunodeficiency virus (HIV) infection and acquired immune deficiency syndrome (AIDS), and led to the decline in HIV transmission [1]. Once a fatal infection, HIV is considered nowadays as a chronic, manageable condition [2]. HIV infection not only impairs the immune system, but it also affects the nutritional status by increasing energy requirements, reducing food intake, and adversely affecting nutrients absorption and metabolism [3,4]. Therefore, nutritional care of persons living with HIV/AIDS (PLWHA) is an essential component of comprehensive HIV medical management in addition to ongoing ART [5-7]. With good adherence to ART and appropriate nutrition, PLWHA have a life expectancy comparable with that in the general population [8-10]. Several studies have shown that maintaining an optimal nutritional status of PLWHA - eating the correct amounts of macronutrients and micronutrients- is crucial to: (1) maximize ART absorption and tolerance; (2) improve the functioning of the immune system; (3) help better manage symptoms; and (4) reduce the burden of disease and enhance their overall health and quality of life [11-16]. Therefore, attention is increasingly being given to the examination of nutritional status among PLWHA, as part of HIV strategic plans.
The staple foods of Cameroon vary from region to region and depend on climate, urbanization, household income, nutritional education, health, gender, and age group [17,18]. Despite the presence of restaurants, which offer a variety of international cuisines (e.g. French, Italian, Chinese, Asian, Middle Eastern, etc.) and international fast-food chains in urban areas, Cameroonian meal patterns are still heavily guided by traditional food practices rather than individual nutritional needs. In general, starchy foods (e.g. corns; cassava, Manihot utilissima; yam, Dioscorea sp.; cocoyam, Xanthosoma sp.; potatoes; plantains; unripe bananas; and rice) dominate in Cameroonian dishes and are served with sauces, which usually contain leafy vegetables, legumes and seeds with meat or fish added, depending on affordability, availability and cultural habits [19,20]. Meal frequency varies between twice or thrice per day, depending mainly on the affordability [17,19].
To our knowledge, the nutritional condition of PLWHA has not been studied in Cameroon context in general and in the Centre Region of Cameroon in particular. Therefore, this study was carried to assess nutritional status of PLWHA in the Centre Region of Cameroon. The outcome of this study would be the evidence to inform the improvement of nutrition counselling resources for HIV-infected patients tailored to the local diet context.
2. Materials and Methods
2.1 Study site
This cross-sectional study was conducted between July and October 2018 at the Saint Martin de Porres Dominican Hospital located in Mvog Betsi, one of the suburbs of Yaounde, the capital of Cameroon [21]. Established in 2007, this modern general hospital is operated by the religious Dominican sisters and is supported by national and international organizations. It has been offering several medical services and programs, including a unit for HIV testing and pre- and post test counseling, HIV care and support, ART and prevention to the communities of Centre Region of Cameroon. During this study, the HIV unit was providing care and treatment counselling to 1,443 HIV- positive patients. This hospital is renowned in the country for his high-quality medical care and efficient staff.
2.2 Ethical Clearance and Consent to Participate
Prior to starting this research study, ethical approval was obtained from the authorities of the hospital and the Regional Ethics Committee for Human Health Research of the Cameroon Centre Region (Reference Number 0519/CRERSHC/2018). A note containing key informations regarding the study was giving everyday to the patients coming for their follow-up. They were asked to participate in the study with the assurance that participation is completely voluntary, and that it can be denied or discontinue at any time. All the volunteer individuals who were eligible to participate signed an informed consent form prior to enrollment. For the protection of the participants, anonymity and confidentiality were preserved by assigning a code to each participant.
2.3 Study Participants
HIV-positive patients receiving care and the antiretroviral combination therapy that included Tenofovir, Lamivudine, and Efavirenz since at least 24 weeks prior to study initiation at the Saint Martin de Porres Dominican Hospital of Mvog-Betsi, were randomly selected for participation. They were living in the Centre Region of Cameroon. Eligibility criteria for this study were as follows: (1) to be at least 21 years of age or older; (2) to be enrolled on Tenofovir-Lamivudine-Efavirenz antiretroviral therapy for at least 24 weeks; (3) to be asymptomatic with an undetectable viral load (< 40 copies per milliliter of blood); (4) to not be affected by nutrient-related diseases and conditions necessitating special diets (e.g., cardiovascular disease, hypertension, cancer, and diabetes mellitus); (5) to live in the Centre Region of Cameroon for at least six months.
2.4 Data Collection
2.4.1. Questionnaire Participants were required to complete an in-person interview questionnaire designed by us at the start of the study to determine their sociodemographic characteristics, including gender, age, area of residence, religion, marital status, employment status, estimated average monthly income, their clinical history of HIV and their perception of nutritional counselling, including knowledges about type of HIV, number of months on ART, HIV status of the partner, nutritional counselling.
2.4.2. Anthropometric measurements Height, body weight, waist and hip circumference were measured with standard procedure, during the in-person interview. Anthropometric indices, body mass index (BMI) and waist-hip ratio (WHR), were determined. BMI (kg/m2) was calculated as a proxy nutritional status by dividing body weight (kg) by the square of the height (m2). It was classified into four categories, according to the conventional classification of the World Health Organization: underweight (BMI ≤ 18.5 kg/m2), normal weight (18.5 > BMI ≥ 24.9 kg/m2), overweight (25 > BMI ≥ 29.9 kg/m2) and obese (BMI ≥30 kg/m2) [22]. Abdominal obesity was assessed by calculating the WHR as waist circumference (cm) divided by hip circumference (cm). The cut-off value of abdominal obesity was considered as WHR > 0.85 for women and WHR > 0.90 for men [23].
2.4.3. Dietary intake Dietary frequency and diversity were assessed, using food consumption score (FCS) questionnaire and food diversity score (FDS) questionnaire, as indicators of the nutrients adequacy of the diet of the participants [24]. The FCS was calculated using the frequency of consumption of seven food groups (cereals; legumes; vegetables and fruits; meat and fish; milk; sugar; and oil) that was consumed by each individual during the 7 days prior to the in-person interview questionnaire [25]. On the other hand, the FDS was estimated by simply counting each of the following nine food groups (starches; dark green leafy vegetables; fruits and other vegetables rich in vitamin A; other fruits and vegetables; organ meats; meat and fish; eggs; legumes, nuts and seeds; milk and dairy products) that each individual had reported on 24-hour dietary recalls [24]. Furthermore, participants were required to record all the foods and beverages consumption of 7 consecutive days in food diaries. They were asked to carry diary with them and to record foods as eaten in real-time, as well as the location, time, whether or not during special occasions (e.g., birthdays, weddings, funerals, etc.). The food diaries were used for the determination of food consumption and average nutrients intakes to estimate global nutrients intakes [26]. Nutrient’s composition of each food was determined using food composition tables [19,20,27] and total energy was calculated with the energy values of protein, 1g gives 4 kcal; lipids, 1 g gives 9 kcal; and carbohydrates, 1 g gives 4 kcal.
2.5 Laboratory Analysis
Blood specimens were collected on-site to obtain information about biochemical markers of nutrient status. For each participant, venous blood was obtained by venipuncture at the bend of the elbow, following standard procedures and protocols. Blood samples were taken into: (1) three 1.8 mg/ml ethylene-diamine-tetra-acetic acid (EDTA) tubes, one tube for the determination of plasma total proteins, albumin and globulins; one tube for CD4 T cells count estimation, and the other one for viral load level; and (2) one 5 ml plain tube to capture serum total protein. The collected blood samples were transferred in insulated bags to maintain a suitable ambient temperature to: (1) the study site laboratory where total proteins [28] and albumin [29] were measured by conventional colorimetric method; and CD4 T cells counts were determined using flow cytometry [30]; and (2) the laboratory of the Cameroonian Pasteur Centre where viral load levels were determined using reverse transcriptase polymerase chain reaction [31]. This viral load was done to exclude participants with a detectable result. Except for the blood samples dedicated to measurement of the viral load levels and CD4 T cells counts, the blood specimens used for the measurement of blood biomarkers were centrifuged at 3500 rpm for 5 minutes at ambient temperature. After that, each sample was divided into two aliquots and placed in two separate tubes. The first tube had serum while the second tube had plasma. They were immediately analyzed for plasma total proteins (g/l), serum total proteins (g/l), albumin (g/l) and globulins (g/l).
2.6 Statistical analysis
Data were recorded in Microsoft® Office Excel 2013 software. Statistical analysis was conducted using the statistical software IBM SPSS Statistics version 21.0 (SPSS Inc., Chicago, IL, USA). The graphs were constructed using Microsoft® Office Excel 2013 software. The mean and standard deviation were used for the description of continuous variables. The categorical variables were described in terms of percentage. The comparison of the means of two quantitative variables between two groups was performed using Student's t-test after checking the hypothesis of normality of the sample. The qualitative variables were compared by Fisher's exact test. For all the tests used, differences were considered significant if p <0.05.
3. Results
3.1 Sociodemographic characteristics
Among 104 patients interested by the study, we included 82 adults according to eligibility criterias. Most of the participants were females (76.8%) with a sex ratio of 1:3. The majority of the participants were between 31 and 39 years old (65.9%) with mean age of 33.0 ± 4 years. Fifty-two (65.0%) were Catholic. Large part of the participants 55 (67.1%) were married or in concubinage (or common-law marriage i.e. cohabitation of a couple without legal or formal married but living together in a 'marriage-like' relationship and publicly referring to themselves as partners). Thirty-three (40.2%) were self-employed with an estimated monthly income between 50,001 and 100,000 CFA F (38.3%). Sociodemographic characteristics of the study individuals are shown in Table 1.
|
Variables |
Frequency (n=82) |
Percentage |
|
Gender |
||
|
Male |
19 |
23.2% |
|
Female |
63 |
76.8% |
|
Age |
||
|
21 - 30 years |
28 |
34.1% |
|
31 - 39 years |
54 |
65.9% |
|
Residence area |
||
|
Urban |
58 |
70.7% |
|
Peri-urban |
24 |
29.3% |
|
Marital status |
||
|
Married/concubinage |
55 |
67.1% |
|
Single |
23 |
28.0% |
|
Divorced/Separated |
3 |
3.7% |
|
Widow (er) |
1 |
1.2% |
|
Religion a |
||
|
Catholique |
52 |
65.0% |
|
Protestant |
23 |
28.8% |
|
Muslim |
1 |
1.3% |
|
Pentecotist/Jehovah’s witness |
4 |
5.0% |
|
Profession |
||
|
Public employee |
7 |
8.5% |
|
Private employee |
22 |
26.8% |
|
Self-employee |
33 |
40.2% |
|
Unemployed |
17 |
20.7% |
|
Student |
3 |
3.7% |
|
Estimated monthly income b (CFA francs) |
||
|
< 25000 |
11 |
13.6% |
|
25001 - 50000 |
27 |
33.3% |
|
50001 - 100000 |
31 |
38.3% |
|
100001 - 200000 |
8 |
9.9% |
|
200001 - 300000 |
4 |
4.9% |
|
> 300000 |
0 |
0.0% |
an = 80 bn = 81
Table 1: Socio-demographic characteristics
3.2 HIV medical history and perception of nutritional counselling
Table 2 below shows the HIV medical history and the perception of nutritional advices by the participants. Seventy-two (98.6%) of participants didn’t know their type of HIV. The median of months on ARV therapy was 37.5 [18.0-51.25]. Fifty-six (68.3%) of participants had taken the therapy for 12-60 months. The majority of participants (62.2%) known their partners HIV status, for which 24 (52.2%) were negative. Between the positive partners, 18 (90.0%) were taking ART therapy. Forty-six (56.1%) participants said they have received nutritional counselling sometimes (45.7%) during their follow-up consultation. All participants found useful to receive nutritional advices (100.0%). Sixty-two (75.6%) participants were not taking their ARV therapy with meals, as an advice getting from the hospital (96.7%).
|
Variables |
Frequency |
Percentage |
|
Type of VIH (n = 73) |
||
|
HIV 1 |
1 |
1.4% |
|
Do not know |
72 |
98.6% |
|
Number of months on ARV therapy |
||
|
< 12 |
12 |
14.6% |
|
12-60 |
56 |
68.3% |
|
> 60 |
14 |
17.1% |
|
Knowing partner status |
||
|
Yes |
46 |
62.2% |
|
No |
28 |
37.8% |
|
Partner HIV result (n = 46) |
||
|
Positive |
21 |
45.7% |
|
Negative |
24 |
52.2% |
|
Undetermined |
1 |
2.2% |
|
Partner on ARV (n = 20) |
||
|
Yes |
18 |
90.0% |
|
No |
2 |
10.0% |
|
Nutritional advices received in consultation |
||
|
Yes |
46 |
56.1% |
|
No |
36 |
43.9% |
|
Frequency of nutritional councellinga |
||
|
Sometimes |
21 |
45.7% |
|
Often |
8 |
17.4% |
|
Always |
17 |
37.0% |
|
Importance of nutritional councelling |
||
|
Yes |
82 |
100.0% |
|
No |
0 |
0.0% |
|
ARV with meals |
||
|
Always |
5 |
6.1% |
|
Sometimes |
15 |
18.3% |
|
Never |
62 |
75.6% |
|
If never, why? (n = 60) |
||
|
Eating early |
2 |
3.3% |
|
Advices from hospital |
58 |
96.7% |
aSometimes: 1 consultation over 3; Often: 2 consultations over 3; Always: 3 consultations over 3.
Table 2: HIV medical history and perception of nutritional councelling
3.3 Anthropometric parameters
3.3.1. Body mass index
The average of BMI of study population was 24.56 ± 4.97 kg/m2. The prevalence of underweight was 8.5%, whereas 45.1%; 35.4% and 11% of the participants were normal weight, overweight and obese respectively. Most participants with normal weight were men (47.4%) and aged between 21 and 30 (57.1%). Those falling into the obesity group were essentially women (14.3%) aged between 31 and 39 years (13%). Overweight condition was common in male (42.1%) and participants aged between 31 and 39 (37.0%). The lower prevalence of underweight were dominant in man (10.5%) and for 31 and 39 years old participants (11.1%). Figure 1 images the variation of BMI status (underweight, normal weight, overweight and obesity) of all participants. Figures 2 and 3 show the distribution of BMI per gender and per age group respectively.
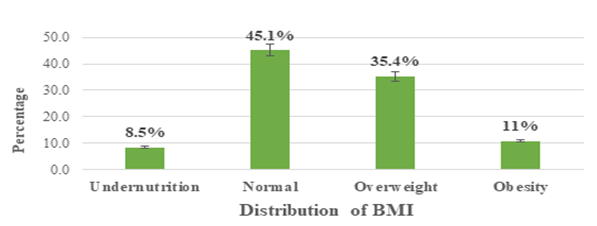
Figure 1: BMI distribution
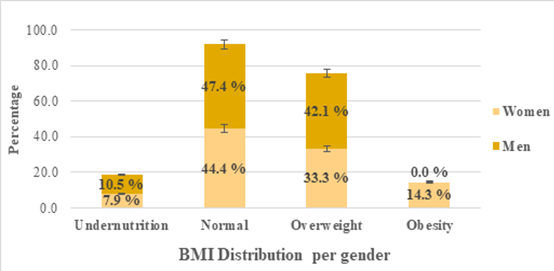
Figure 2: BMI distribution by gender
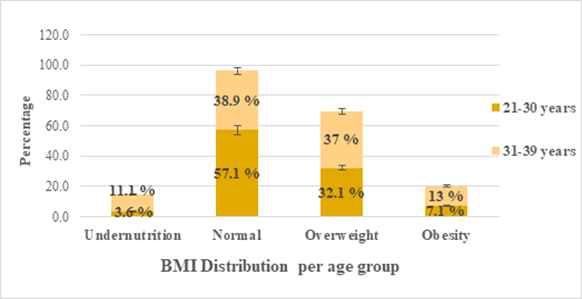
Figure 3: BMI distribution by age group
3.3.2. Waist-hip ratio
The WHR average was 0.89 ± 0.1 in study population. Figure 4 reveals the variation of WHR in the study population. Abdominal obesity was found in 48 (60.8%) of participants whereas 31 (39.2%) had normal morphotype. Figure 5 states that abdominal obesity was more present in men (82.4%) than in women (54.8%), with a statistical difference (p = 0.01). Figure 6 presents the variation of WHR by age group. Abdominal obesity was dominant in both age group, 55.6% for participants aged between 21 and 30 years old and 63.5% for those between 31 and 39 years old.
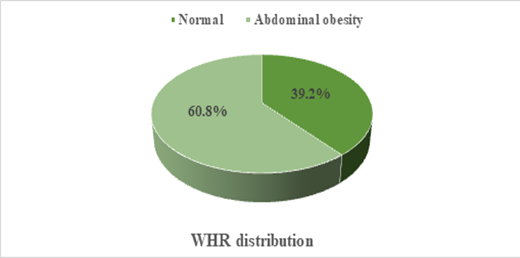
Figure 4: WHR variation of study population
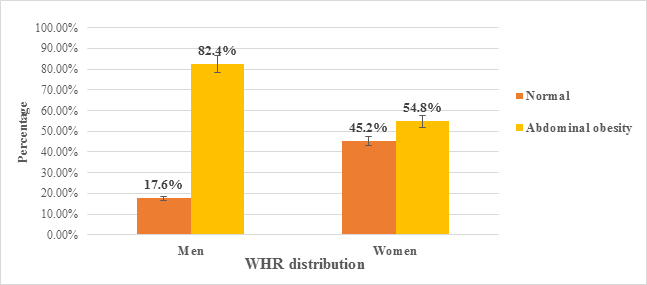
Figure 5: WHR distribution by gender
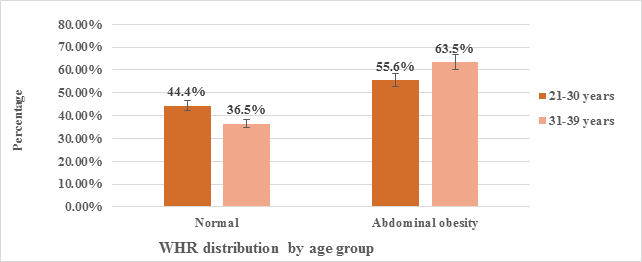
Figure 6: WHR distribution by age group
3.4 Dietary survey
3.4.1. Food consumption score
As our participants ate sugar and oil every day, we considered FCS less than 28 as poor, between 28.5 and 42 as borderline, and more than 42 as acceptable [25]. Figure 7 shows the distribution of FCS. Seventy-nine (97.5%) participants had an acceptable FCS whereas 2 (2.5%) had a borderline FCS. A poor FCS was not found in our study cohort.
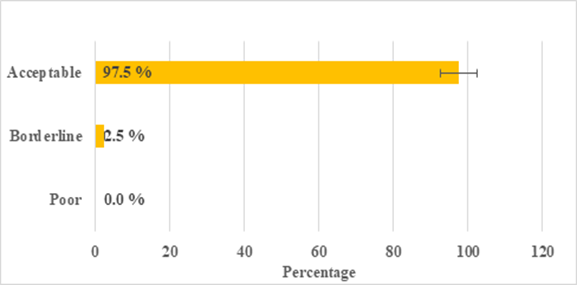
Figure 7: Food consumption score of study population
3.4.2. Food diversity score
We considered low any score less than or equal to 3, average between 4 and 5, and high, more than or equal to 6 [24]. Figure 8 presents the distribution of FDS. For 42 (51.9%) participants food diversity was average. Four (4.9%) had a high FDS whereas 35 (43.2%) had a low FDS. Figure 9 shows the variation of FDS by gender and age group. FDS was average for 34 (54.8%) women. It was also average for 15 (53.6%) participants aged between 21 and 30 years old and 27 (50.9%) participants between 31 to 39 years old. Men FDS was low for 9 (47.4%) of them. Starches (37.37%) and meat/fish (19.55%) were the two dominant groups of food items.
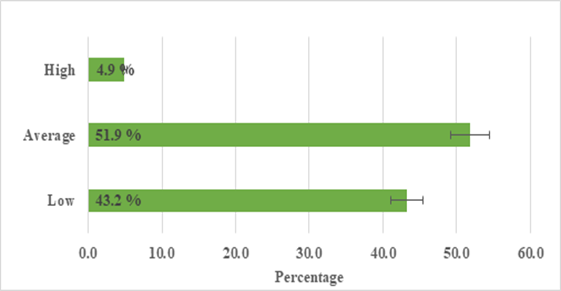
Figure 8: Food diversity score of study population
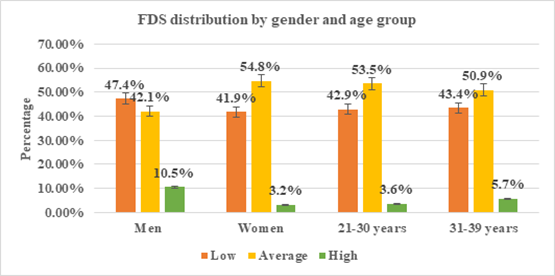
Figure 9: FDS distribution by gender and age group
3.4.3. Daily nutrients intake
Sixty-three food diaries were recovered, and 44 were included in the study after validation. Table 3 presents the means and median of macronutrients daily intake of participants. The median of protein (74.03 g) was higher than the daily required proteins. The mean of fats intake (70.31 g) was normal for women and low for men. The consumption of carbohydrates was two times (261.96 g) higher than the daily recommendation. Total energy was lower (2012 kcal) than needed in both men and women. These differences were not statistically significant for gender and age group. However we found a statistical difference between areas (urban versus peri-urban) for lipids (p = 0.01), carbohydrates (p = 0.03) and energy (p = 0.007).
|
Parameters |
Mean ±SD/Median [Q25-Q75] |
Normal range |
|
Proteins (g) |
74.03 [51 - 97.87] |
M: 56 g/j; F: 46 g/day |
|
Fats (g) |
70.31 ± 29.42 |
M: 93g/j; F: 70g/day |
|
Carbohydrates (g) |
261.96 ± 107.38 |
130 g/day |
|
Energy (kcal) |
2012.38 ± 773.82 |
M: 2670-3420 kcal/daya F: 2400-2760 kcal/daya |
M=Male F= Female aFor PLHIV in Cameroon [32]
Table 3: Means and median of macronutrients daily intake
The recommended range are 11-15% for proteins, 35-40% for fats and 50-55% for carbohydrates per day [33]. Table 4 reveals the distribution of percentage of macronutrients and energy of participants. Most of them were consuming more than 15% of proteins (75%) and more than 55% of carbohydrates (88.6%) everyday. All of them were eating less than 35% of lipids (100%) everyday, according to the food diaries. Daily energy intakes was low for 38 (86.4%) patients.
|
Parameters/Range |
Frequency |
Percentage |
|
Proteins |
||
|
< 11% |
3 |
6.8 % |
|
11-15% |
8 |
18.2 % |
|
> 15% |
33 |
75.0 % |
|
Fats |
||
|
< 35% |
44 |
100.0% |
|
35 - 40% |
0 |
0.0% |
|
> 40% |
0 |
0.0% |
|
Carbohydrates |
||
|
< 50% |
1 |
2.3 % |
|
50 - 55% |
4 |
9.1 % |
|
> 55% |
39 |
88.6 % |
|
Energy |
||
|
Low |
38 |
86.4 % |
|
Insufficient |
4 |
9.1 % |
|
High |
2 |
4.5 % |
Table 4: Distribution of macronutrients and energy intake
3.5. Biochemical and immunological markers
Table 5 resumes the means or median of biochemical parameters and CD4 T cells levels of participants. All markers were in normal range: 70.37 g/L for plasma total proteins; 70.24 g/L for serum total proteins; 39.23 g/L for albumin; 31 g/L for globulins and 475.50 /µL for CD4 T cells. The difference between men and women was statistically significant (p = 0.008) for albumin level.
|
Parameters |
Mean ±SD/Median [Q25-Q75] (n = 82) |
Normal range |
|
Plasma total proteins (g/L) |
70.37 ± 9.70 |
66-87 g/L |
|
Serum total proteins (g/L) |
70.24 ± 9.90 |
64-83 g/L |
|
Albumin (g/L) |
39.23 ± 9.58 |
34-48 g/L |
|
Globulins (g/L) |
31.00 ± 11.72 |
30-35 g/L |
|
CD4 (per μL) |
475.50 [273.75 - 692.00] |
< 350/µL |
Table 5: Means/median of biochemical and immunological markers
The normal range was 66 to 87 g/L for plasma total proteins; 64 to 83 g/L for serum total proteins; 34 to 83 g/L for albumin; 30 to 35 for globulins; and more or equal to 350 CD4 T cells/µL. Table 6 states that most of participants had normal values of plasma total proteins (65.8%); serum total proteins (69.5%); albumin (58.5%); and CD4 T cells (70.7%). Low globulins levels were dominant (51.2%) in the study population.
|
Variables |
Frequency (n = 82) |
Percentage |
|
Plasma total proteins |
||
|
< 66 g/L |
26 |
31.7% |
|
66 - 87 g/L |
54 |
65.8% |
|
> 87 g/L |
2 |
2.5% |
|
Serum total proteins |
||
|
< 64 g/L |
18 |
22% |
|
64 - 83 g/L |
57 |
69.5% |
|
> 83 g.L |
7 |
8.5% |
|
Albumin |
||
|
< 34 g/L |
19 |
22% |
|
34 - 48 g/L |
48 |
69.5% |
|
> 48 g/L |
15 |
8.5% |
|
Globulins |
||
|
< 30 g/L |
42 |
51.2% |
|
30 - 35 g/L |
12 |
14.6% |
|
> 35 g/L |
28 |
34.2% |
|
CD4 |
||
|
< 350/µL |
24 |
29.3% |
|
≥ 350/µL |
58 |
70.7% |
Table 6: Variation of biochemical and immunological markers
4. Discussion
Nutrition plays an important role in immunity and influences the ability of the immune system to respond to infections. It is therefore a key part of the management of HIV infection. The aim of this pilot study was to determine the nutritional status of persons living with HIV in the Centre Region of Cameroon. Our results show that all patients aren’t receiving nutritional advices during their follow-up. All of them found useful to have a nutritional counselling. This suggest that the reinforcement of caregiver’s implication on nutritional education of patients should be improve. Moreover, our study findings reveal that there is high burden of malnutrition for PLWHA, both undernutrition and overnutrition. Undernutrition affects approximatively 1 over 10 patients, whereas overweight touched around 4 over 10, and obesity, more than 1 patient over 10. We observe that women were more affected by obesity than men, and men were more affected by overweight than women. On the other hand, undernutrition was dominant in men compare to women, similar to the study carried out by Takarinda et al. in Zimbabwe [34]. The presence of undernutrition after at least 24 weeks of ARV therapy with an undetectable viral load might be due to the quality and quantity of food intake or physiological status of concerned participants. Overweight and obesity were more dominant in our study than undernutrition, despite the lower daily total energy. This result suggest that the issue concern the quality of food consumed by participants. Moreover, only women were obese in our study cohort, aged between 31 and 39 years old. The reason might be the quality of food items intake, but also the physiological composition of women for that age. Abdominal obesity was dominant in our study population. It is probably due to the high prevalence of obesity in our cohort. However, abdominal obesity might reflect metabolic syndrome, knowing that this syndrome affects 32.8% of PLWHA in Cameroon [35]. FCS was acceptable for the majority of participants. Meaning that there is a good accessibility to food for participants. However, FDS that reflect the quality of food was high for few of them, whereas more than a half had a moderated FDS. The study carried out by Mukabana & Masika in Kenya [36] revealed that more than a half of PLWHA had a moderated FDS, whereas 35.5% had a high FDS, making the difference with our findings. Our results suggest that the diet of participants was not enough varied. Moreover, starches, which are rich in carbohydrates, were more consume by participants. This finding is similar to those of Tesfaw et al. in Ethiopia [37]. Starchy food was followed by meat and fish item. The reasons might be due to the study area, cultural habits, socio-economic status [18-20]. And this can explained the prevalence of overweight and obesity of this study population. The daily intake of proteins and carbohydrates were higher than the recommanded values. This finding is in line with the FDS of participants. The consumption of fats was lower than the daily recommandation. The reason might be one of the limits of food diaries, that is the report of the quantity of fats daily intake. Although this was not the objective of this study, the trend showed a significant difference between participants from urban areas and those from peri-urban areas about fats, carbohydrates and energy. An in-depth study in this direction might provide important informations. Despite macronutrients intake was not normal in majority of participants, we found that biochemical parameters (albumin, plasma and serum total proteins) were normal. This result suggest that because of their better immunologic status, nutrients are well metabolised. This might be due to ART, undetectable viral load, clinical status of participants. But, low globulins level was predominant in more than a half of participants. Knowing that serum globulins level is a good biomarker of inflammation and the immune status of the body [38], there is a need for PLWHA to have optimal globulins levels in their diet to improve their immune system and ability to defense against infections.
This study revealed some implications. Firstly, malnutrition, both undernutrition and overnutrition, are present amongst persons living with HIV in the Centre Region of Cameroon. Therfore, it is important to sensitize caregivers about it, to assess and well register anthropometrics parameters starting by the first visit to the health facilities and during individual follow-up. Secondly, overweight and obesity are some of risk factors for cadiovascular diseases. Our findings suggest that there is an urgent need to screen and manage systematically cardiovascular risks and diseases at every follow-up consultation of HIV patients in health care centers, especially overweight and obese patients, to reduce the morbidity and the mortality due to this category of illness. Thirdly, studies might be done to formulate globulins locally available food supplement for PLWHA to help to improve their immunological status.
The investigation into causal relationship between determinents and outcomes of nutritional status of our study population is limited because of the cross-sectional nature of this study. Then, further analytical studies might be done for better results and conclusions. Additionally, a more representative study of the Centre Region of Cameroon might refine the results. And, as key limitations, this study may be affected by some systematic errors, for example recall bias for self-reported components and measurement errors.
5. Conclusion
Our findings reveals that there is a double burden of undernutrition and over-nutrition in HIV population of Centre Region of Cameroon, with a high prevalence of overweight and obesity than undernutrition among these HIV patients taking ARV therapy for more than 24 weeks with an undetectable viral load. Women were concern by overweight and obesity, while men were concern by overweight. Nutritional counselling, nutritional assessment and screening of cardiovascular diseases should be an important part of PLWHA routine follow-up, using available local foods.
Acknowledgements
The authors sincerely thank the administrative and caregivers staff of Saint Martin de Porres Dominican Hospital of Yaounde, the PLWHA who accepted to participate to the study, the Cameroonian Pasteur Centre and the Faculty of Medicine and Biomedical Sciences of University of Yaounde 1.
Conflicts of interest
There were no conflicts of interest between authors.
References
>
- UNAIDS Data 2019 (2019).
- Deeks SG, Lewin SR, Havlir DV. The end of AIDS: HIV infection as a chronic disease. Lancet 382 (2013): 1525-1533.
- Besoins en nutriments des personnes vivant avec le VIH/SIDA: rapport d’une consultation technique. Genève. (2003).
- Thapa R, Amatya A, Pahari DP, Bam K, Newman MS. Nutritional status and its association with quality of life among people living with HIV attending public anti-retroviral therapy sites of Kathmandu Valley, Nepal. AIDS Research and Therapy 12 (2015): 14.
- Gerrior JL, Neff LM. Nutrition assessment in HIV infection. Nutrition in Clinical Care 8 (2005): 6-15.
- Naude CE, Du Plessis LM, Hendricks MK. Nutritional Management of HIV/AIDS, TB, and Other Infectious Diseases. Community nutrition for developing countries (2016): 177-205.
- Farhadi S, Ovchinnikov RS. The relationship between nutrition and infectious diseases: A review. Biomed Biotechnol Res J 2 (2018): 168-72.
- Mills EJ, Bakanda C, Birungi J, Chan K, Ford N, et al. Life expectancy of persons receiving combination antiretroviral therapy in low-income countries: a cohort analysis from Uganda. Annals of internal medicine 155 (2011): 209-216.
- Johnson LF, Mossong J, Dorrington RE, Schomaker M, Hoffmann CJ, et al. Life expectancies of South African adults starting antiretroviral treatment: collaborative analysis of cohort studies. PLoS medicine 10 (2013): e1001418.
- Nakagawa F, May M, Phillips A. Life expectancy living with HIV: recent estimates and future implications. Current Opinion in Infectious Diseases 26 (2013): 17-25.
- Tang AM, Graham NM, Kirby AJ, McCall LD, Willett WC, et al. Dietary micronutrient intake and risk of progression to acquired immunodeficiency syndrome (AIDS) in human immunodeficiency virus type 1 (HIV-1) - infected homosexual men. American Journal of Epidemiology 138 (1993): 937-951.
- Tang AM, Graham NM, Saah AJ. Effects of micronutrient intake on survival in human immunodeficiency virus type 1 infection. American Journal of Epidemiology 143(1996): 1244-1256.
- Semba RD, Tang AM. Micronutrients and the pathogenesis of human immunodeficiency virus infection. The British Journal of Nutrition 81(1999): 181-189.
- Gillespie S, Kadiyala S. HIV/AIDS, food and nutrition security : from evidence to action. Food Policy Review 7 (2005).
- Katona P, Katona-Apte J. The interaction between nutrition and infection. Clinical Infectious Diseases 46 (2008): 1582-1588.
- Diouf A, Badiane A, Manga NM, Idohou-Dossou N, Sow PS, et al. Daily consumption of ready-to-use peanut-based therapeutic food increased fat free mass, improved anemic status but has no impact on the zinc status of people living with HIV/AIDS: a randomized controlled trial. BMC Public Health 16 (2016): 1.
- Mennen LI, Mbanya JC, Cade J, Balkau B, Sharma S, et al. The habitual diet in rural and urban Cameroon. European Journal of Clinical Nutrition 54 (2000): 150-154.
- Nkengfack G, Torimiro J, Ngogang J, Englert H. A Review of Nutrition in Cameroon: Food supply, factors influencing nutritional habit and impact on micronutrient (vitamin A, iodine, iron) status. Health Sciences and Diseases 12 (2011).
- Sharma S, Mbanya JC, Cruickshank K, Cade J, Tanya AK, et al. Nutritional composition of commonly consumed composite dishes from the Central Province of Cameroon. International Journal of Food Sciences and Nutrition 58 (2007): 475-485.
- Kouebou CP, Achu M, Nzali S, Chelea M, Bonglaisin J, et al. A review of composition studies of Cameroon traditional dishes: macronutrients and minerals. Food Chemistry 140 (2013): 483-494.
- Saint Martin de Porres Dominican Hospital. https://hopitaldominicainyaounde.com/ (2019).
- World Health Organization. Physical status: the use and interpretation of anthropometry. Report of a WHO Expert Committee. World Health Organization technical report series 854 (1995): 1-452.
- World Health Organization. Waist circumference and waist-hip ratio: report of a WHO expert consultation. Geneva. (2011).
- Bureau Régional pour l’Afrique de l’Ouest, Dakar. Indicateurs de la sécurité alimentaire: Intégrer les programmes de nutrition et de sécurité alimentaire en situation d’urgence et pour le renforcement de la résilience. Afrique de l’Ouest/Sahel - Saly, Sénégal. (2014).
- Guide pour mesurer la diversité alimentaire au niveau du ménage et de l’individu. (2013). 26. FAO. Dietary Assessment: A resource guide to method selection and application in low resource settings. Rome. (2018).
- Ponka R, Fokou E, Beaucher E, Piot M, Gaucheron F. Nutrient content of some Cameroonian traditional dishes and their potential contribution to dietary reference intakes. Food Science and Nutrition 4 (2016): 696-705.
- Gornall AG, Bardawill CJ, David MM. Determination of serum proteins by means of the biuret reaction. Journal of Biological Chemistry 177 (1949): 751-766.
- Doumas BT, Biggs HG. Standard methods of clinical chemistry. Academic press 7 (1972): 175-188.
- Brown M, Wittwer C. Flow Cytometry: Principles and Clinical Applications in Hematology. Clinical Chemistry 46 (2000): 1221-1229.
- Davis C, Heath A, Best S, Hewlett I, Lelie N, et al. Calibration of HIV-1 working reagents for nucleic acid amplification techniques against the 1st international standard for HIV-1 RNA. Journal of Virological Methods 107 (2003): 37-44.
- Ministère de la Santé Publique. Guide national de prise en charge nutritionnelle et alimentaire des personnes vivant avec le VIH/SIDA (2014).
- Schlienger JL. Nutrition clinique pratique Chez l’adulte, l’enfant et la personne âgée. (2018).
- Takarinda K, Mutasa-Apollo T, Madzima B, Nkomo B, Chigumira A, et al. Malnutrition status and associated factors among HIV-positive patients enrolled in ART clinics in Zimbabwe. BMC Nutrition 3 (2017): 1-11.
- Dimodi HT, Sone Etame L, Signing Nguimkeng B, Essouman Mbappe L, Essola Ndoe N, et al. Prevalence of Metabolic Syndrome in HIV-Infected Cameroonian Patients. World Journal of AIDS 4 (2014): 85-92.
- Mukabana B, Masika F. Factors affecting dietary intake and dietary diversity score among adults living with HIV/AIDS in Uasin Gishu District Hospital, Kenya - A cross-sectional study. Journal of Nursing and Health Science 7 (2019): 10-18.
- Tesfaw A, Jara D, Temesgen H. Dietary Diversity and Associated Factors among HIV Positive Adult Patients Attending Public Health Facilities in Motta Town, East Gojjam Zone, Northwest Ethiopia. Advances in Public Health 2018 (2018).
- Zhou Q, Cao H, Xu Z, Lan R, Chen X, et al. Baseline serum globulin as a predictor of the recurrence of lone atrial fibrillation after radiofrequency catheter ablation. Anatolian Journal of Cardiology 17 (2017): 381-385.


 Impact Factor: * 3.8
 Acceptance Rate: 77.96%
  Time to first decision: 10.4 days
  Time from article received to acceptance: 2-3 weeks