Inference of Angiography Flow Information from Structural Optical Coherence Tomography Images in Cynomolgus Monkeys Using Deep Learning
Peter M Maloca1-3*, Philippe Valmaggia1-3, Nadja Inglin1, Beat Hörmann4, Sylvie Wise5, Philipp Müller3,6,7, Pascal W. Hasler1,2, Nicolas Feltgen1,2, Nora Denk1,2,8
1Department of Ophthalmology, University Eye Hospital Basel, Basel 4031, Switzerland
2Department of Biomedical Engineering, University Basel, 4123 Allschwil, Switzerland
3Moorfields Eye Hospital NHS Foundation Trust, London EC1V 2PD, United Kingdom
4Supercomputing Systems, Zurich 8005, Switzerland
5Charles River Laboratories, Senneville, Quebec, Canada
6Macula Center, Südblick Eye Centers, Augsburg 86150, Germany
7Department of Ophthalmology, University of Bonn, Bonn, Germany
8Pharma Research and Early Development (pRED), Pharmaceutical Sciences (PS), Roche, Innovation Center Basel, Basel 4070, Switzerland
*Correspondingauthors: Peter M Maloca, Department of Ophthalmology, University Eye Hospital Basel, Basel 4031, Switzerland.
Received: 18 August 2025; Accepted: 21 August 2025; Published: 29 September 2025
Article Information
Citation: Peter M Maloca, Philippe Valmaggia, Nadja Inglin, Beat Hörmann, Sylvie Wise, Philipp Müller, Pascal W Hasler, Nicolas Feltgen, Nora Denk. Inference of Angiography Flow Information from Structural Optical Coherence Tomography Images in Cynomolgus Monkeys Using Deep Learning. Journal of Biotechnology and Biomedicine. 8 (2025): 312-321.
DOI: 10.26502/jbb.2642-91280198
View / Download Pdf Share at FacebookAbstract
Introduction: To adapt and replicate deep learning-based methods for the automated detection of flow signals in OCT imaging, focusing on their application to the retinas of healthy cynomolgus monkeys. Methods: From 193 healthy cynomolgus monkeys, an unprecedented number of 382 coregistered OCT and OCTA stack pairs were obtained for training, evaluation, and separate testing. An adapted U-Net architecture with an additional max-pooling layer to account for the large spatial input format was used. The net was trained with an Adam Optimizer and a Mean Squared Error loss function until the loss on the validation set reached a plateau (21,000 steps).The following metrics were calculated for each OCT and OCTA B-scan pair in the test set: mean-squared error (MSE), structural similarity index (SSI), and peak signal to noise ratio (PSNR). Results: The developed deep learning method allowed to automatically detect the flow signal within the native structural OCT scans in animals. The average MSE over all test set image pairs was 0.00370368 with a standard deviation of 0.000825. Average SSI was 0.88339 with a standard deviation of 0.02167 and the average PSNR was 24.43170 dB with a standard deviation of 1.08154 dB. No large difference in the distribution of MSE, SSI, and PSNR were found among eyes and among individual cynomolgus monkeys. Conclusion: Deep learning can reliably detect retinal flow signals from standard OCT scans in healthy cynomolgus monkeys, offering a viable alternative to OCTA imaging and enabling broader access to vascular analysis in preclinical research.
Keywords
Deep learning; Optical coherence tomography angiography; Cynomolgus monkeys
Article Details
Introduction
For decades, the retinal and choroidal vasculatures have mainly been displayed using invasive imaging methods such as fluorescein angiography [1] and indocyanine-green angiography [2]. In recent years, these techniques have been complemented by optical coherence tomography (OCT) imaging, which allows for imaging close to histological resolutions [3-5]. Although vascular signals can be detected in structural OCT images [6], the technical enhancement to OCT angiography (OCTA)[7, 8] has for a long time been more of a research tool, providing new insights into diabetic retinopathy[9], age-related macular degeneration [10], or uveitis [11]. These OCTA data are created by postprocessing OCT data acquired at the same location and highlighting regions with different signal reflectance over a short period. The reasons for the delayed translation from research to clinical practice were the difficulty in interpreting [12] findings due to the occurrence of image artifacts [13] and the relatively long acquisition times due to the repetitive measurement of OCT signals at identical anatomical positions [14]. In addition, the widespread adoption of OCTA is limited because it demands both hardware and software upgrades to existing OCT devices or is only possible with novel and relatively expensive CTA equipment. Convolutional neural networks (CNN) have positively transformed ophthalmology in terms of automated image segmentation [15], disease classification [16], and even the assessment of the need for referral to a clinic [17]. In most cases, supervised deep learning [17, 18] is used, which relies on a high degree of ground-truth labels, which are mostly generated by human experts [19] through a laborious, time-intensive, and consequently expensive procedure [19, 20]. In addition, the learning ability of the deep learning algorithm may be limited and more complex owing to the naturally occurring differences in judgment between human experts [20] and human-derived errors.
OCT images are always simultaneously generated with OCTA data. As OCT and OCTA are indispensably linked [21] to each other, previous studies proposed [22, 23] not to use humans as “ground truth generators” for supervised deep learning but to involve machine learning [24, 25] as a connecting mechanism to automatically detect the flow signal in OCT scans. This recent approach not only reduces the burden on experts and facilitates the generation of more objective training data, but also enables researchers without direct access to high-end OCTA devices to apply the proposed deep learning technology, as it allows for ground truth generation through non-human annotation interactions, thereby minimizing human bias. Furthermore, it also enhances the speed of generating OCTA data and allows for the retrieval of retrospective structural OCT data recorded at a time when OCTA was not yet available and for the gain of new insights into vascular flow. Considering the widespread use of OCT imaging in contrast to the scarce OCTA application in animal models such as the cynomolgus monkey, we adjusted and tested the aforementioned method [22] for the first time in an extensive number of retinas of healthy cynomolgus monkeys, which are frequently used for preclinical research on ocular therapeutics such as drug development [26] or ocular gene therapy [27].
Materials and Methods
Animals, husbandry
The retrospective OCT data consisted of scans centered on the healthy fovea cynomolgus monkeys (Macaca fascicularis) of Asian or Mauritius origin. These data were obtained from routine examinations during pharmaceutical product development; therefore, no further procedures were performed on them. The monkey housing was kept at a constant temperature between 20°C and 26°C, a humidity between 20% and 70%, and a 12:12 h light–dark cycle. The monkeys were fed with a standard diet of pellets enriched with fresh fruits and vegetables. Clean and freely available tap water purified by reverse osmosis and UV irradiation was also provided. The animals were provided with appealing psychological and environmental enrichments. The animals were anesthetized with a mixture of ketamine 10 mg/kg and dexmedetomidine 25 μg/kg IM. Immediately prior to imaging, a single dose of midazolam 0.2 mg/kg IM was administered to maintain the eyes in a central position. Dilated pupils were obtained using topical tropicamide treatment.
OCT imaging
The OCT measurements were performed on a dilated pupil under anesthesia using the Spectralis HRA + OCT Heidelberg device (Heidelberg Engineering, Heidelberg, Germany), as previously reported[28]. Scans consisting of 512 B- scans with 512 × 496 pixels each were performed over an en face area of 10°× 10°. The 3D scans corresponded to a volume of approximately 2.9 × 2.9 ×1.9 mm. Macula OCT scans from 193 healthy cynomolgus monkeys were included in this study. From four individuals, only one eye was available (Table 1). This resulted in 382 coregistered OCT and OCTA scan pairs (193 ´ 2 − 4).
Device generated OCTA ground truth
The deep learning algorithm developed in this study learned from ground truth that consisted of the coregistered OCT and OCTA scan pairs. No additional human ground truth annotation was required since each OCT/OCTA scan pair was automatically coregistered by the manufacturer’s software. The OCT and corresponding OCTA scans were then exported as raw data from OCT devices as sets of two-dimensional (2D), 8-bit grayscale B-scans in the bitmap image data (BMP) format using the Spectralis proprietary built-in software.
Image preparation and preprocessing
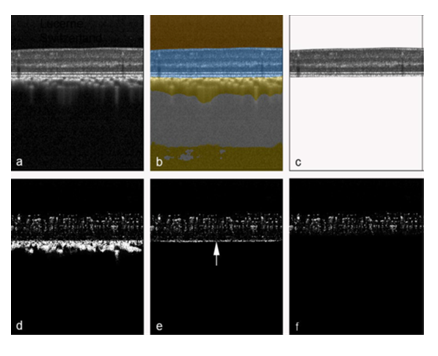
The focus of this study was to infer OCTA data from raw OCT data. In the first step (Fig. 1) a previously developed and validated deep learning network [29] was used to extract retina (Figure 1b) from the original OCT structural B-scan. In the second step, from the original OCTA B-scan, masks were created to extract only the OCTA signal from the retina (Fig. 1d). The extracted OCT and its corresponding original OCTA image were then used as the expected image pair for the training of the deep learning algorithm.
Figure 1: Automatic retina OCT and OCTA segmentation. An original OCT B-scan (a) was processed using a validated deep learning algorithm to compartmentalize the retina (b, highlighted in blue), which was then extracted from the remaining tissue (c). The corresponding original OCTA scan from the same position, generated by the manufacturer's OCTA software (d), was accordingly delineated at the border between retinal pigment epithelium and choriocapillaris (e). Then, all pixels below a virtual line located 20 pixels above the inner edge of the choriocapillaris-retinal pigment epithelium complex (e, arrow) were masked to remove hyperreflective regions not belonging to the retinal OCTA signal. This procedure resulted in a structural retinal B-scan (c) and its corresponding OCTA B-scan (f), which were subsequently utilized for training and testing of the deep learning algorithm.
Ground-truth generation
The basic dataset was split randomly for deep learning with a 4:1:1 ratio (Table 1) to generate a training, validation, and test sets. Each OCT and OCTA volume consisted of 512 B-scans.
|
Training Set |
Validation Set |
Test Set |
|
|
Number of individuals |
129 |
32 |
32 |
|
Number of eyes |
254 |
64 |
64 |
|
Number of OCT-OCTA B-scan pairs |
130,048 |
32,768 |
32,768 |
Table 1: Ground-truth distribution for deep learning.
All B-scans were resized to 512-by-512 pixels to be used as inputs for the deep learning algorithm. No normalization or image augmentation was applied to the input images.
Deep learning training and validation
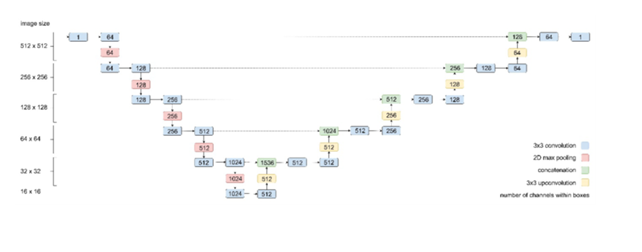
An adapted and validated U-Net architecture[19] with an additional max- pooling layer to account for the large spatial input format was used (Fig. 2). The neural network architecture applied in this study was a convolutional neural network (CNN) whose architecture is related to the architecture of a CNN used in a previous study [30]. In contrast to that in the previous study, the output of the last convolutional layer of the current CNN was one channel instead of four, representing the pixel intensities of an OCTA B-scan on a continuous scale in the interval [0, 1]. The CNN was trained with an Adam optimizer and a mean squared error (MSE) loss function until the loss calculated over the validation set reached a plateau (21,000 steps). A batch size of 8 was used, and training was performed on a NVIDIA GeForce GTX TITAN X GPU. The neural network was trained in Python 3.5 using TensorFlow v1.14. Hyperparameters were tuned and set as described in the comparable study [19]. Therefore, hyperparameters were initially selected based on domain knowledge and subsequently fine-tuned to achieve optimal model accuracy. The learning rate, set at 6e-5, was chosen based on initial exploratory runs to ensure stable convergence. Additionally, experiments were conducted to assess the impact of different batch sizes, settling on a batch size of 8 to balance computational efficiency and model performance. Early stopping based on validation loss was employed to determine the optimal number of training iterations, preventing overfitting.
Statistical analysis, evaluation metrics, and visualizations
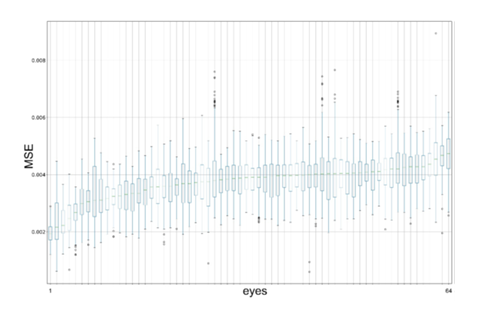
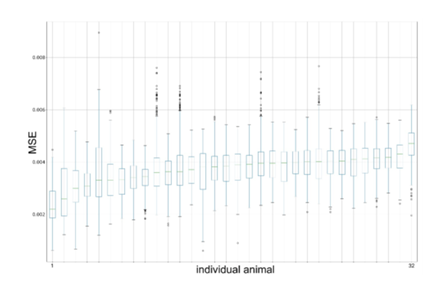
The following metrics were calculated for each OCT and OCTA B-scan pair in the test set: mean squared error (MSE), structural similarity index (SSI), and peak signal-to-noise ratio (PSNR). The MSE was aggregated with respect to each eye and its distribution was visualized with box plots. The data in the box plots were sorted with respect to the mean MSE per eye. The box plots were drawn using Matplotlib v3.3.4 in Python 3.8.
Qualitative evaluation
As the 2D OCTA data used in this study were relatively difficult to evaluate in a cross-sectional display, the data were computed in an en face data representation and in the 3D realm as previously reported [30, 31]. For this purpose, volume-rendered 3D reconstructions as described earlier [31, 32] of the retinal vessels were depicted in Figs. 6 and 7 using the AMIRA software (version 2020.1; Thermo Fisher Scientific, Waltham, US).
Results
Quantitative evaluation
Table 2 provides a summary of the analysis results. The mean (standard deviation [SD]) squared error (MSE) of all normalized test set image pairs was 0.0037 (0.0008). The mean (SD) structural similarity index (SSI) was 0.8834 (0.0217), and the mean (SD) peak signal-to-noise ratio (PSNR) was 24.4317 (1.0815).
|
Mean Squared Error |
Minimum Squared Error |
Maximum Squared Error |
Standard Deviation Squared Error |
Structural Similarity Index |
Peak Signal-to-Noise Ratio in dB |
|
|
count |
32768 |
32768 |
32768 |
32768 |
32768 |
32768 |
|
mean |
0.0037 |
0 |
0.9944 |
0.0404 |
0.8834 |
24.4317 |
|
std |
0.0008 |
0 |
0.0110 |
0.0055 |
0.0217 |
1.0815 |
|
min |
0.0006 |
0 |
0.5320 |
0.0085 |
0.7315 |
0.1943 |
|
25% |
0.0031 |
0 |
0.9922 |
0.0376 |
0.8744 |
23.6606 |
|
50% |
0.0038 |
0 |
1 |
0.0409 |
0.8867 |
24.2501 |
|
75% |
0.0043 |
0 |
1 |
0.0440 |
0.8973 |
25.0371 |
|
max |
0.0089 |
0 |
1 |
0.0618 |
0.9290 |
32.0591 |
Table 2: Summary of deep learning performance.
No substantial differences in the distributions of MSE, SSI, and PSNR were found among the eyes. The distribution of the observed MSE values was visualized as box plots for the eyes (Figure 3) and individual animals (Figure 4).
Qualitative evaluation
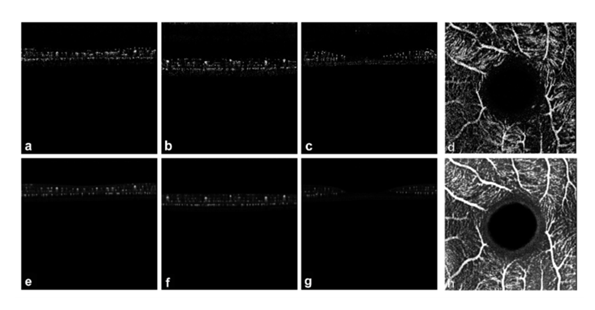
The predictions by the deep learning algorithm on the test set showed a clear delineation of vessels (Fig. 5).
Figure 5: Visualization of inferred OCTA deep learning based on data from the test set. In the original crosse-sectional OCTA B-scans from three eyes (a–c), the OCTA signals are recognizable as a cluster of whitish dots with a narrowing in the area of the fovea (in the center of the image). The bottom row contains the respective predictions of the neural network of the corresponding location (e–g). Furthermore, an original en face projection from individual in a) of the OCTA signal was depicted from (d) and its corresponding deep learning en face predicition (h).
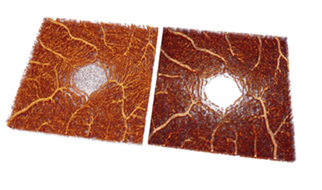
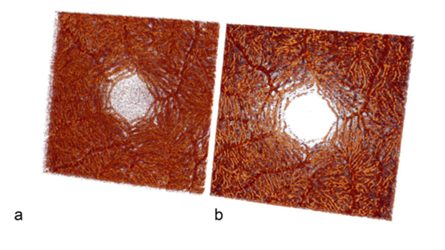
The three-dimensional (3D) reconstructions derived from the original and predicted OCTA stacks effectively illustrate the detailed architecture of the retinal vascular system. (Figures 6 and 7).
Figure 7: Visualization of volume-rendered OCTA images of the fovea of an original OCTA stack (a) and a predicted OCTA stack (b) from the test set in the posterior view. The same data set is used in Fig. 5d, h. The massive increased capillarity of the deep retinal vascular complex is thus well visualized.
Discussion
OCTA allows for the in vivo depiction of the retinal microvasculature [21]. By default, an appropriate OCTA instrument [26] and sophisticated OCTA algorithms must be used to generate OCTA data [21]. However, in a recent study [22], deep learning was implemented to circumvent the former existing technical OCTA constraints and allowed for the extraction of the retinal vasculature from retrospective OCT data in humans. A central strength of this study is its capability to generate OCTA-like visualizations directly from standard structural OCT data, effectively functioning as an OCT-to-OCTA translation model. This approach is particularly valuable as it broadens access to vascular imaging by eliminating the need for specialized OCTA hardware, thereby enabling wider adoption of advanced retinal vascular analysis in both clinical and research settings.
Motivated by this advantage, we investigated the feasibility of applying this deep learning–based OCTA synthesis in cynomolgus monkey retinas. This species is of particular relevance in ophthalmic research due to its close genetic and anatomical resemblance to humans, making it a widely accepted preclinical model for drug development. However, despite its importance, only limited OCTA data were made available for cynomolgus monkeys. In this context, our study is the first to demonstrate in the maculae of healthy cynomolgus monkeys that retinal perfusion can be inferred digitally from structural OCT using deep learning, thereby confirming earlier findings. Notably, when comparing our results with those of Lee et al. [22], we observed comparable performance in terms of mean squared error (MSE), further supporting the robustness of this method in non-human primates.
Therefore, we were interested in evaluating the feasibility of such OCTA deep learning technology in cynomolgus monkey retinas. This is all the more important because the cynomolgus monkey [26, 33] has become a commonly used preclinical species for ophthalmic drug development owing to its genetic and anatomical similarities to humans [4, 34] and only a few OCTA reports exist in this species [35, 36].
For the first time in the maculae of healthy cynomolgus monkeys, the present study confirms earlier results [22, 37] that indicated that the retinal blood flow can be displayed with a digital interpretation from OCT images by deep learning algorithms. When comparing the results with those of Lee et al. [22], we found comparable values for deep learning performance in terms of MSE. Compared with the previous OCTA inference studies [22, 23], this study applied a simplistic approach by using only one deep learning model with a larger input size and no dropout layers. It may well be that another neural network could have initiated and performed better. A minor deviation could be due to the amount of noise in the OCTA scans, which appeared less noisy and more homogeneous in an earlier work [22] and therefore influenced the measured values. This could be due to different types of OCT scanners used. In addition, the region of interest in the previous work was focused on the fovea as opposed to a region including the optic disc with larger vessels, which might be easier to detect for the network. However, the 3D reconstruction and single OCTA B-scan in the present study showed qualities comparable with those of the original OCTA data. Therefore, the OCTA inference methodology used appeared promising and applicable to animal models.
Despite being useful for the training and validation of the neural network, MSE does not sufficiently represent the quality of predictions. In addition, cynomolgus monkeys from two origins were also integrated [28], which in turn caused heterogeneity in the initial data. For future research, other scores and measures might improve the quality of predicted OCTA scans.
A limitation of the study is that only healthy eyes were enrolled, excluding segmentation results from diseased conditions. This limitation may limit the generalizability of the results to populations with ocular pathology, where segmentation patterns and results may be significantly different. As Choroid and RPE was cut off, this might not be of great influence. Nevertheless, the deep learning algorithm may not predict as well if retinal or choroidal pathologies are present. This must be investigated in future studies.
Another limitation is that we used a single U-Net architecture and did not compare it with other algorithms such as generative adversarial networks (GANs) or Denoising Diffusion Probabilistic Models (DDPMs) [38, 39]. While the U-Net architecture employed in this study has proven effective for the OCT to OCTA conversion task, recent advancements in generative models such as Generative Adversarial Networks (GANs) and Denoising Diffusion Probabilistic Models (DDPMs) offer exciting future avenues.GANs, known for their ability to produce high-quality synthetic images by training a generator and discriminator adversarially [40], have shown promise in improving image quality and could enhance OCTA image synthesis by capturing complex vascular structures [41]. Similarly, DDPMs, which iteratively denoise data to model complex distributions, demonstrate robust capabilities in generating high-fidelity images, as seen in recent medical imaging applications [42], [43], [44], [45], [46], [47]. These models may be suitable to capture the subtle details of vascular networks within OCTA scans more accurately and should be included in upcoming studies to further improve the results.
The decision to choose a U-shaped model was based on its good performance in past studies and the feasibility of OCTA data synthesis was proven in this study [39, 48]. The use of a 2D U-Net, which processes B-scans independently, may limit the model’s ability to capture full 3D spatial context.
However, the model performs well and offers a strong foundation for future improvements—especially since the shared weights allow for continued development by the community. There is no comparison with existing models on similar tasks using either human or animal data, making it difficult to assess how competitively the proposed method performs. However, this gap can be addressed in future studies.
In addition, future studies will need to demonstrate whether the developed model is compatible with images acquired by other OCT systems. Another limitation was that no data on peripheral OCTA were included in the current analysis. Nevertheless, good performance of the model used for data near the fovea, the location of sharpest vision, was found.
Conclusion
A significant contribution of this study is the development of a deep learning model trained on an extensive dataset of cynomolgus monkey retinal images. Comparable to human data, this model reliably detects retinal flow signals from standard OCT scans in healthy monkeys, offering a practical alternative to OCTA and expanding access to vascular analysis in preclinical research. A major strength of this study is its capacity to synthesize OCTA-like representations directly from conventional structural OCT data, thereby functioning as a translation framework from structural OCT to OCTA imaging.
Acknowledgments
We are thankful for financial support from Hoffmann–La Roche Ltd., Pharma Research and Early Development (pRED), Pharmaceutical Sciences (PS), Basel, Switzerland. We also thank Pascal Kaiser, Zurich, Switzerland, for the valuable advice on the statistical analyses and Fabian Lutz, Flumedia Ltd. Lucerne, Switzerland, for coding advice. All illustrations were created by the authors mentioned above and finalized using Adobe Photoshop without the use of touch-up tools (Creative Cloud Version 24.6, ID C5004899101EDCH, Adobe Inc., San Jose, US).
Statement of Ethics
We confirm that the study is in accordance with ARRIVE and the ARVO Statement for the Use of Animals in Ophthalmic and Vision Research guidelines. Approval for the studies was granted by one of the following institutional animal care and use committees: Charles River Laboratories Montreal ULC Institutional Animal Care and Use Committee (CR-MTL IACUC), the IACUC Charles River Laboratories Reno (OLAW Assurance No. D16- 00594), and the Institutional Animal Care and Use Committee (Covance Laboratories Inc., Madison, WI; OLAW Assurance No. D16-00137 [A3218- 01]).
Conflict of Interest Statement
P.M.M. and P.W.H. are consultants at Roche, Basel, Switzerland. B.H. is a salaried employe of Supercomputing Systems, Zurich, Switzerland. N.D. is a salaried employee of Roche, Basel, Switzerland. S.W. is a salaried employee of Charles River Laboratories, Canada. Outside of the present study, the authors declare the following competing interests: P.M.M. is a consultant at Roche (Basel, Switzerland), Zeiss Forum, and holds intellectual property for machine learning at MIMO AG and VisionAI, Switzerland.
P.V. received funding from the Swiss National Science Foundation (grant No. 323530_199395) and the Janggen-Pöhn Foundation.
P.M.: Bayer, Germany, Roche, Germany, Novartis, Germany, Alcon, Germany. The other coauthor declares no conflicts of interest.
Funding Sources
Research support was granted from Roche, Basel, Switzerland, especially with the data collection and decision to publish. Roche had no role and did not interfere in the conceptualization or conduct of this study.
Author Contributions
P.M.M.: Conceptualization, Data curation, Formal analysis, Funding acquisition, Investigation, Methodology, Project administration, Resources, Software, Supervision, Validation, Visualization, Writing – original draft, and Writing – review and editing.
P.V.: Visualization, Data curation, Writing – original draft, Resources, Software, and Writing – review and editing.
B.H.: Conceptualization, Data curation, Formal analysis, Funding acquisition, Investigation, Methodology, Project administration, Resources, Software, Supervision, Validation, Visualization, Writing – original draft, and Writing – review and editing.
N.I.: Visualization, Data curation, Writing – original draft, Resources, and Writing – review and editing.
S.W.: Writing – original draft, – review and editing. P.M.: Writing – original draft, – review and editing.
P.W.H.: Visualization, Writing – original draft, and Writing – review and editing. N.D.: Conceptualization, Data curation, Formal analysis, Funding acquisition, Investigation, Methodology, Project administration, Resources, Software, Supervision, Validation, Visualization, Writing – original draft, and Writing – review and editing.
Data availability statement
The neural network weights and source code to predict OCTA from OCT as described in this study are available on https://github.com/peter- maloca/OCTA-Infer[49].
References
- Novotny HR, Alvis A method of photographing fluorescence in circulating blood in the human retina. Circulation 24 (1961): 82-86.
- Slakter JS, Yannuzzi LA, Guyer DR, et al. Indocyanine-green angiography. Curr Opin Ophthalmol 6 (1995): 25-32.
- Drexler W, Morgner U, Ghanta RK, et al. Ultrahigh- resolution ophthalmic optical coherence tomography. Nat Med 7 (2001): 502-507.
- Anger EM, Unterhuber A, Hermann B, et al. Ultrahigh resolution optical coherence tomography of the monkey Identification of retinal sublayers by correlation with semithin histology sections. Exp Eye Res 78 (2004): 1117-1125.
- Mrejen S, Spaide Optical coherence tomography: imaging of the choroid and beyond. Surv Ophthalmol 58 (2013): 387-429.
- Spaide RF, Jaffe GJ, Sarraf D, et al. Consensus Nomenclature for Reporting Neovascular Age-Related Macular Degeneration Data: Consensus on Neovascular Age-Related Macular Degeneration Nomenclature Study Ophthalmology 127 (2020): 616-636.
- Kashani AH, Chen CL, Gahm JK, et al. Optical coherence tomography angiography: A comprehensive review of current methods and clinical applications. Prog Retin Eye Res 60 (2017): 66-100.
- Hormel TT, Hwang TS, Bailey ST, et al. Artificial intelligence in OCT angiography. Prog Retin Eye Res 85 (2021): 100965.
- Agemy SA, Scripsema NK, Shah CM, et al. Retinal Vascular Perfusion Density Mapping Using Optical Coherence Tomography Angiography In Normals And Diabetic Retinopathy Patients. Retina 35 (2015): 2353-2363.
- Lupidi M, Cerquaglia A, Chhablani J, et al. Optical coherence tomography angiography in age-related macular degeneration: The game changer. Eur J Ophthalmol 28 (2018): 349-357.
- Invernizzi A, Cozzi M, Staurenghi Optical coherence tomography and optical coherence tomography angiography in uveitis: A review. Clin Exp Ophthalmol 47 (2019): 357-371.
- Greig EC, Duker JS, Waheed A practical guide to optical coherence tomography angiography interpretation. Int J Retina Vitreous 6 (2020): 55.
- Spaide RF, Fujimoto JG, Waheed IMAGE ARTIFACTS IN OPTICAL COHERENCE TOMOGRAPHY ANGIOGRAPHY. Retina 35 (2015): 2163-2180.
- Spaide RF, Fujimoto JG, Waheed Optical Coherence Tomography Angiography. Retina 35 (2015): 2161-2162.
- Maloca PM, Lee AY, de Carvalho ER, et Validation of automated artificial intelligence segmentation of optical coherence tomography images. PLoS One 14 (2019): e0220063.
- Ting DSW, Pasquale LR, Peng L, et al. Artificial intelligence and deep learning in Br J Ophthalmol 103 (2019): 167-175.
- De Fauw J, Ledsam JR, Romera-Paredes B, et Clinically applicable deep learning for diagnosis and referral in retinal disease. Nat Med 24 (2018): 1342-1350.
- Schmidt-Erfurth U, Sadeghipour A, Gerendas BS, et al. Artificial intelligence in retina. Prog Retin Eye Res 67 (2018): 1-
- Maloca PM, Lee AY, de Carvalho ER, et Validation of automated artificial intelligence segmentation of optical coherence tomography images. PLoS One 14 (2019): e0220063.
- Maloca PM, Müller PL, Lee AY, et al. Unraveling the deep learning gearbox in optical coherence tomography image segmentation towards explainable artificial intelligence. Commun Biol 4 (2021): 170.
- Spaide RF, Fujimoto JG, Waheed NK, et al. Optical coherence tomography angiography. Prog Retin Eye Res 64 (2018): 1-55.
- Lee CS, Tyring AJ, Wu Y, et Generating retinal flow maps from structural optical coherence tomography with artificial intelligence. Sci Rep 9 (2019): 5694.
- Zhang Z, Ji Z, Chen Q, et al. Texture-Guided U-Net for OCT-to-OCTA Generation. Pattern Recognition and Computer Vision; 2021 2021//; Cham: Springer International Publishing.
- Le D, Son T, Yao Machine learning in optical coherence tomography angiography. Experimental Biology and Medicine 246 (2021) :2170 - 2183.
- Jiang Z, Huang Z, Qiu B, et Weakly Supervised Deep Learning- Based Optical Coherence Tomography Angiography. IEEE Trans Med Imaging 40 (2020): 688-698.
- Adamson P, Wilde T, Dobrzynski E, et al. Single ocular injection of a sustained-release anti-VEGF delivers 6months pharmacokinetics and efficacy in a primate laser CNV model. J Control Release 244 (2016): 1-13.
- Tobias P, Philipp SI, Stylianos M, et Safety and Toxicology of Ocular Gene Therapy with Recombinant AAV Vector rAAV.hCNGA3 in Nonhuman Primates. Hum Gene Ther Clin Dev 30 (2019): 50-56.
- Maloca PM, Seeger C, Booler H, et al. Uncovering of intraspecies macular heterogeneity in cynomolgus monkeys using hybrid machine learning optical coherence tomography image segmentation. Sci Rep 11 (2021): 20647.
- Maloca PM, Freichel C, Hänsli C, et Cynomolgus monkey's choroid reference database derived from hybrid deep learning optical coherence tomography segmentation. Sci Rep 12 (2022): 13276.
- Spaide Volume-Rendered Angiographic And Structural Optical Coherence Tomography. Retina 35 (2015): 2181-2187.
- Reich M, Dreesbach M, Boehringer D, et al. Negative Vessel Remodeling in Stargardt Disease Quantified with Volume-Rendered Optical Coherence Tomography Angiography. Retina (2021).
- Maloca PM, Spaide RF, Rothenbuehler S, et Enhanced resolution and speckle-free three-dimensional printing of macular optical coherence tomography angiography. Acta Ophthalmol 97 (2019): e317-e319.
- Chen LL, Wang Q, Yu WH, et al. Choroid changes in vortex vein-occluded monkeys. Int J Ophthalmol 11 (2018): 1588-1593.
- Bringmann A, Syrbe S, Görner K, et al. The primate fovea: Structure, function and development. Prog Retin Eye Res 66 (2018): 49-84.
- Garcia Garrido M, Beck SC, Mühlfriedel R, et al. Towards a quantitative OCT image analysis. PLoS One 9 (2014): e100080.
- Choi M, Kim SW, Vu TQA, et al. Analysis of Microvasculature in Nonhuman Primate Macula With Acute Elevated Intraocular Pressure Using Optical Coherence Tomography Angiography. Invest Ophthalmol Vis Sci 62 (2021): 18.
- Yang J, Liu P, Duan L, et al. Deep learning enables extraction of capillary-level angiograms from single OCT volume. arXiv: Medical Physics (2019).
- Li P, O'Neil C, Saberi S, et al., editors. Deep learning algorithm for generating optical coherence tomography angiography (OCTA) maps of the retinal vasculature (2020).
- He, iang, hiyu, et , editors. Comparative study of deep learning models for optical coherence tomography angiography (2020).
- Goodfellow I, Pouget-Abadie J, Mirza M, et Generative adversarial networks. Commun ACM 63 (2020): 139–144.
- Kamran SA, Hossain KF, Tavakkoli A, et al. RV-GAN: Segmenting Retinal Vascular Structure in Fundus Photographs Using a Novel Multi- scale Generative Adversarial Network. Medical Image Computing and Computer Assisted Intervention – MICCAI 2021; 2021 2021//; Cham: Springer International Publishing.
- Jiang H, Imran M, Zhang T, et al. Fast-DDPM: Fast Denoising Diffusion Probabilistic Models for Medical Image-to-Image IEEE J Biomed Health Inform (2025).
- Dorjsembe Z, Odonchimed S, Xiao F, et al. Three-dimensional medical image synthesis with denoising diffusion probabilistic Medical imaging with deep learning (2022).
- Kazerouni A, Aghdam EK, Heidari M, et Diffusion models in medical imaging: A comprehensive survey. Med Image Anal 88 (2023): 102846.
- Bieder F, Wolleb J, Durrer A, et al. Memory-efficient 3d denoising diffusion models for medical image processing. Medical Imaging with Deep Learning (2024): PMLR.
- Wolleb J, Sandkühler R, Bieder F, et al. Diffusion models for implicit image segmentation ensembles. International Conference on Medical Imaging with Deep Learning (2022): PMLR.
- Durrer A, Wolleb J, Bieder F, et al., editors. Denoising diffusion models for 3D healthy brain tissue MICCAI Workshop on Deep Generative Models (2024).
- Kadomoto S, Uji A, Muraoka Y, et al. Enhanced Visualization of Retinal Microvasculature in Optical Coherence Tomography Angiography Imaging via Deep Learning. Journal of Clinical Medicine (2020): 9.
- Maloca Pm et al. Inference of optical coherence tomography angiography flow information from structural optical coherence tomography images in cynomolgus monkeys using deep learning. Neural network weights and source code at https://github.com/peter-maloca/OCTA-Infer (2023).


 Impact Factor: * 5.3
 Acceptance Rate: 75.63%
  Time to first decision: 10.4 days
  Time from article received to acceptance: 2-3 weeks