Personalized Baselines in Vital Signs: Insights from Wearable-Derived Sleep Data in Healthy Adults
Nima Sarani1*, Raymond Che1, Bradley S Jackson1, Cameron Hanson1, Sarah Selby1, Diti Ronvelia1, Michelle Wilson1, Kapil P Gude2, Rohan L Fernandes2
1Department of Emergency Medicine, University of Kansas Medical Center, Kansas City, KS, USA
2Software Services, Data Science, Creative Capsule, Kansas City, KS, USA
*Correspondingauthors: Nima Sarani, Department of Emergency Medicine, University of Kansas Medical Center, Kansas City, KS, USA.
Received: 22 July 2025; Accepted: 24 July 2025; Published: 29 September 2025
Article Information
Citation: Nima Sarani, Raymond Che, Bradley S Jackson, Cameron Hanson, Sarah Selby, Diti Ronvelia, Michelle Wilson, Kapil P. Gude, Rohan L Fernandes. Personalized Baselines in Vital Signs: Insights from Wearable-Derived Sleep Data in Healthy Adults. Journal of Biotechnology and Biomedicine. 8 (2025): 307-311.
DOI: 10.26502/jbb.2642-91280197
View / Download Pdf Share at FacebookAbstract
Population-based thresholds for vital signs, such as defining heart rate above 100 bpm as tachycardia, fail to capture individual physiological variability. Advances in wearable technology have enabled continuous, personalized monitoring of vital signs, offering the possibility of individualized baselines for health assessment. In this study, we examined sleep-derived vital sign data from eight healthy adults who wore Apple Watch devices across multiple nights. Data collected included respiratory rate (RR), heart rate (HR), oxygen saturation (SpO2), heart rate variability (HRV, RMSSD), and skin/wrist temperature (SWT). Participants exhibited unique and stable baselines for each vital sign, underscoring the importance of personalized thresholds in health monitoring. These results suggest that deviations from individual baselines could serve as sensitive markers for early detection of physiological changes, surpassing the limitations of population norms.
Keywords
Population; Respiratory rate; Heart rate; Oxygen saturation; Pathology
Population articles; Respiratory rate articles; Heart rate articles; Oxygen saturation articles; Pathology articles
Article Details
Introduction
Vital signs are a cornerstone of clinical assessment, traditionally interpreted against established population norms. However, these “normal” ranges often overlook individual physiological variability. A heart rate considered normal in one patient might indicate stress or pathology in another. With the emergence of consumer-grade wearable devices, continuous monitoring of vital signs has become feasible outside of clinical settings, providing unprecedented opportunities to understand personal physiological patterns.
Sleep offers a unique window into baseline physiology, minimizing confounding factors like activity, stress, or environmental fluctuations. Tracking vital signs during sleep may reveal individual baselines more accurately than daytime measurements. The concept of personalized baselines, rather than applying universal thresholds, is increasingly recognized as critical for precision medicine and early disease detection [1-4].
This study aimed to evaluate the inter- and intra-individual variability of sleep-derived vital signs using data from Apple Watch devices worn by healthy adults. We hypothesized that individual baselines for vital signs would be distinct and stable over time, supporting the feasibility of personalized health monitoring.
Methods
Study Population
Eight healthy adult participants (3 male, 5 female), aged between 30 and 50 years, were enrolled in this observational study. Participants were anonymized as A through H. All individuals were free from acute or chronic illnesses and not taking medications known to influence vital signs.
Data Collection
Participants wore Apple Watch devices (Series 3 or newer) during sleep over several weeks. For each participant, the following data were recorded:
- • Respiratory Rate: Measured at intervals throughout the night.
- • Heart Rate: Measured approximately every 5-10 minutes during sleep.
- • Oxygen Saturation (SpO2): Available only for participants whose Apple Watch models included blood oxygen sensors (e.g., Series 6 and newer).
- • Heart Rate Variability (HRV_RMSSD): Calculated as the root mean square of successive differences (RMSSD) of interbeat intervals during sleep.
- • Skin/Wrist Temperature (SWT): Available only for devices supporting temperature sensing (Apple Watch Series 8 and Ultra). Apple calculates a single nightly temperature based on multiple sensor readings using proprietary algorithms [5].
All individual measurements for each vital sign during a single sleep period were averaged to create one nightly average per participant. These nightly averages were tracked across multiple nights to evaluate intra-individual stability and inter-individual differences.
Data Analysis
We computed descriptive statistics (minimum, 25th percentile [Q1], median, 75th percentile [Q3], maximum) for each participant and vital sign. Participants with missing data for certain parameters, due to device limitations, were excluded from corresponding analyses.
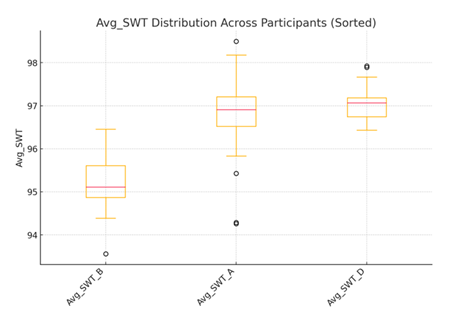
Sorted boxplots were generated for each vital sign to visualize the distribution across participants. Only participants with recorded data were included in each plot.
Results
This study produced comprehensive tables and visualizations to examine personalized baselines for vital signs among eight healthy participants.
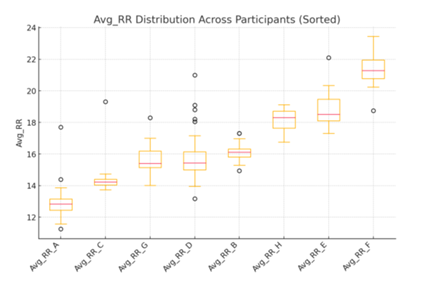
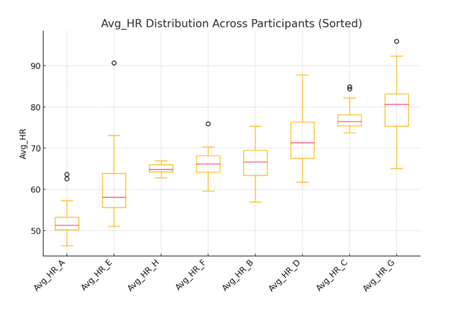
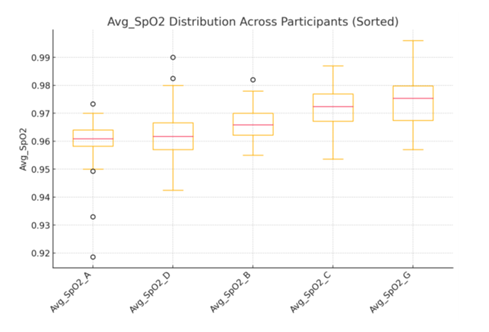
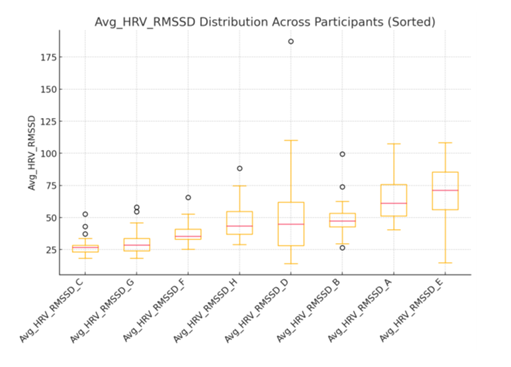
For each vital sign, we calculated descriptive statistics across multiple nights for each participant. Tables 1–5 display the minimum, 25th percentile (Q1), median, 75th percentile (Q3), and maximum nightly averages for:
- • Respiratory rate (Avg_RR)
- • Heart rate (Avg_HR)
- • Oxygen saturation (Avg_SpO2)
- • Heart rate variability (Avg_HRV_RMSSD)
- • Skin/wrist temperature (Avg_SWT)
These tables show the numerical ranges defining each participant’s unique physiological baseline.
In addition to tables, we generated boxplots (Figures 1–5) for each vital sign. Each boxplot displays the distribution of nightly averages per participant. The center red line in each box represents the median nightly average for that participant, while the edges of the box represent the interquartile range (25th to 75th percentile). Whiskers extend to values within 1.5 times the interquartile range, and any points outside the whiskers represent outlier nights where measurements deviated significantly from typical values.
Together, these tables and graphs provide complementary views of the data (numerical and visual) highlighting both the consistency within individuals and the variability between individuals.
Inter-Individual Differences
Each participant demonstrated a unique baseline for every measured vital sign:
- • Avg_RR: Participants’ median respiratory rates ranged from approximately 11.25 to 21.28 breaths per minute.
- • Avg_HR: Median heart rates varied substantially between individuals, ranging from around 50 bpm to over 80 bpm.
- • Avg_SpO2: Participants who had SpO2 measurements consistently maintained high oxygen saturations with low variability, demonstrating minimal inter-individual differences.
- • Avg_HRV_RMSSD: Showed wide inter-individual variability, reflecting differences in autonomic tone.
- • Avg_SWT: Among those with temperature data, stable but distinct personal baselines were observed.
Boxplots for each vital sign (Figures 1–5) illustrate the individualized distributions.
Intra-Individual Stability
Despite differences across participants, vital signs for each individual remained tightly clustered around personal baselines across multiple nights. This indicates strong intra-individual consistency, supporting the feasibility of personalized monitoring.
|
Participant |
Min |
Q1 (25th) |
Median (50th) |
Q3 (75th) |
Max |
|
A |
11.25 |
12.44 |
12.84 |
13.16 |
17.70 |
|
B |
14.95 |
15.82 |
16.11 |
16.31 |
17.31 |
|
C |
13.73 |
14.04 |
14.23 |
14.41 |
19.31 |
|
D |
13.17 |
15.00 |
15.44 |
16.15 |
21.00 |
|
E |
17.30 |
18.11 |
18.51 |
19.47 |
22.10 |
|
F |
18.75 |
20.77 |
21.28 |
21.95 |
23.45 |
|
G |
14.01 |
15.14 |
15.40 |
16.19 |
18.30 |
|
H |
16.75 |
17.64 |
18.31 |
18.71 |
19.12 |
Table 1: Avg_RR Summary Statistics (breaths/min).
|
Participant |
Min |
Q1 (25th) |
Median (50th) |
Q3 (75th) |
Max |
|
A |
46.35 |
50.20 |
51.32 |
53.22 |
63.65 |
|
B |
56.90 |
63.42 |
66.64 |
69.47 |
75.33 |
|
C |
73.74 |
75.37 |
76.45 |
78.10 |
84.89 |
|
D |
61.72 |
67.52 |
71.32 |
76.32 |
87.78 |
|
E |
51.05 |
55.63 |
58.11 |
63.87 |
90.66 |
|
F |
59.59 |
64.20 |
66.18 |
68.16 |
75.93 |
|
G |
65.08 |
75.34 |
80.61 |
83.17 |
95.93 |
|
H |
62.82 |
64.23 |
64.82 |
66.02 |
66.95 |
Table 2: Avg_HR Summary Statistics (bpm).
|
Participant |
Min |
Q1 (25th) |
Median (50th) |
Q3 (75th) |
Max |
|
A |
0.92 |
0.96 |
0.96 |
0.96 |
0.97 |
|
B |
0.95 |
0.96 |
0.97 |
0.97 |
0.98 |
|
C |
0.95 |
0.97 |
0.97 |
0.98 |
0.99 |
|
D |
0.94 |
0.96 |
0.96 |
0.97 |
0.99 |
|
G |
0.96 |
0.97 |
0.98 |
0.98 |
1.00 |
Table 3: Avg_SpO2 Summary Statistics (values between 0 and 1).
|
Participant |
Min |
Q1 (25th) |
Median (50th) |
Q3 (75th) |
Max |
|
A |
40.52 |
51.32 |
61.14 |
75.68 |
107.57 |
|
B |
26.62 |
42.70 |
47.28 |
53.39 |
99.44 |
|
C |
18.29 |
23.20 |
26.81 |
28.37 |
52.76 |
|
D |
14.14 |
28.09 |
44.83 |
61.89 |
187.20 |
|
E |
14.72 |
56.22 |
71.17 |
85.51 |
108.34 |
|
F |
25.36 |
33.02 |
35.33 |
41.04 |
65.61 |
|
G |
18.36 |
23.96 |
28.49 |
33.81 |
58.04 |
|
H |
29.01 |
37.02 |
43.33 |
54.73 |
88.35 |
Table 4: Avg_HRV_RMSSD Summary Statistics (ms).
|
Participant |
Min |
Q1 (25th) |
Median (50th) |
Q3 (75th) |
Max |
|
A |
94.26 |
96.52 |
96.91 |
97.21 |
98.49 |
|
B |
93.56 |
94.87 |
95.11 |
95.61 |
96.45 |
|
D |
96.43 |
96.74 |
97.07 |
97.19 |
97.92 |
Table 5: Avg_SWT Summary Statistics (°F).
Discussion
This study provides strong evidence that healthy individuals maintain unique and stable baselines for vital signs measured during sleep. While traditional medicine relies on population-based reference ranges to define normal physiology, our results underscore the limitations of that approach. Individual variability is not noise – it is meaningful biological information. A single threshold, such as a heart rate over 70 bpm, may flag pathology in one person yet be normal for another, particularly when considering each person’s baseline physiology.
Personalized monitoring offers significant promise for early disease detection. Subtle deviations from an individual’s typical vital sign patterns might indicate early infection, autonomic disturbances, cardiovascular changes, or metabolic stress – even before symptoms become clinically obvious [6]. For example, wearable data revealed that 63% of COVID-19 cases were detected pre-symptomatically, in some cases as early as 9 days before symptom onset, based on deviations in resting heart rate and activity patterns. This underscores the potential of wearables in capturing subtle physiological shifts preceding clinical illness and supports the utility of personalized baseline monitoring demonstrated in our study [7].
Our findings show that wearable devices can capture this individual-specific information reliably. Across participants, the intra-individual variability in nightly averages was remarkably low, suggesting that these devices can establish precise personal baselines over relatively short monitoring periods. In contrast, inter-individual differences were substantial, emphasizing that “normal” ranges must be tailored to the individual rather than universally defined.
Of particular interest is the observation that SWT exhibited consistent patterns among those whose devices measured it. Body temperature is a fundamental indicator of health, yet is often measured sporadically in clinical settings. Continuous monitoring of wrist temperature could become a valuable tool for detecting inflammation, metabolic changes, or circadian rhythm disruptions. However, the proprietary nature of some wearable algorithms, such as Apple’s calculation of nightly SWT, remains a limitation. Greater transparency from manufacturers could enhance the utility of these metrics for clinical research and patient care.
HRV measured here as RMSSD, also demonstrated substantial differences between individuals. HRV is an established marker of autonomic nervous system balance and resilience to stress. The variability in HRV among healthy participants suggests that individual baselines may be influenced by factors such as age, fitness level, mental or physical stress, sleep quality, and genetics. Personalized HRV baselines could thus offer insights not only into physical health but also into psychological and emotional well-being [8].
While our cohort consisted solely of healthy individuals, the implications of this work extend to populations with chronic diseases. For instance, patients with heart failure, chronic lung disease, or diabetes might benefit significantly from personalized monitoring, where deviations from personal baselines could trigger early interventions. Future studies should focus on integrating wearable-derived personal baselines into clinical decision-making algorithms and on establishing thresholds for clinically significant changes.
Despite these promising insights, certain limitations exist. Our sample size was small and relatively homogeneous, limiting generalizability. Furthermore, while Apple Watch devices are convenient and increasingly validated, consumer wearables may not match the precision of clinical-grade devices for all metrics. The proprietary algorithms used to generate summary statistics, especially for SWT, represent a potential “black box” that limits interpretability and cross-device comparison.
Nonetheless, our study highlights the transformative potential of wearable technology in precision medicine. Moving from population-based norms to personalized baselines represents a paradigm shift that could fundamentally change how health and disease are monitored and managed.
Conclusion
Wearable technology enables the definition of personalized baselines for vital signs, revealing meaningful individual variability. Shifting from universal thresholds to personalized monitoring may improve early detection of physiological changes, enhancing the precision of healthcare.
References
- Cohen B, et al. Personalized thresholds for heart rate variability in aging. J Clin Monit Comput 30 (2016): 395-400.
- Kwon OS, et al. Personalized baseline assessment in wearable device monitoring. Int J Med Inform 101 (2017): 1-6.
- Quer G, et al. Inter- and intraindividual variability in daily resting heart rate. PLoS One 15 (2020): e0227709.
- Smuck M, et al. The emerging clinical role of wearables. NPJ Digit Med 4 (2021): 45.
- Apple Inc. About Temperature Sensing on Apple Watch Series 8 and Ultra.
- Goergen CJ, Tweardy MJ, Steinhubl SR, et al. Detection and Monitoring of Viral Infections via Wearable Devices and Biometric Data. Annu Rev Biomed Eng 24 (2022): 1-27.
- Mishra T, Wang M, Metwally AA, et al. Pre-symptomatic detection of COVID 19 from smart-watch data. Nature Biomedical Engineering 4 (2020): 1208-1220.
- Altini M, Plews D. What is behind changes in Resting Heart Rate and Heart Rate Variability? A large-Scale Analysis of Longitudinal Measurements Acquired in Free-Living. Sensonrs 21 (2021) :7932.


 Impact Factor: * 5.3
 Acceptance Rate: 75.63%
  Time to first decision: 10.4 days
  Time from article received to acceptance: 2-3 weeks