GSK343 Potentiates the Response of Paclitaxel in Triple Negative Breast Cancer Cell Lines
Mingzhan Xue1, Reem Elasad1, Sarra Mestiri1, Sujitha Subash Padma Jeya1, Fares Al Ejeh1,2 and Mariam AL-Muftah*, 1, 2
1Qatar Biomedical Research Institute (QBRI), Hamad Bin Khalifa University (HBKU), Qatar Foundation, Doha, Qatar
2College of Health and Life Sciences (CHLS) - Hamad Bin Khalifa University (HBKU), Qatar Foundation, Doha, Qatar
*Corresponding author: Mariam AL-Muftah, College of Health and Life Sciences (CHLS) - Hamad Bin Khalifa University (HBKU), Qatar Foundation, Doha, Qatar.
Received: 08 May 2025; Accepted: 14 April 2025; Published: 19 June 2025
Article Information
Citation: Mingzhan Xue, Reem Elasad, Sarra Mestiri, Sujitha Subash Padma Jeya, Fares Al Ejeh and Mariam AL-Muftah. GSK343 Potentiates the Response of Paclitaxel in Triple Negative Breast Cancer Cell Lines. Fortune Journal of Health Sciences 8 (2025): 582-593.
View / Download Pdf Share at FacebookAbstract
Triple negative breast cancer (TNBC) is the most aggressive breast cancer subtype characterized by poor clinical outcome, high metastatic potential and high rates of relapse. Factors to poor clinical outcome in TNBC patients include limited treatment options, resistance to current therapies and metastasis. Recently, immune checkpoint blockade-based immunotherapy in combination with chemotherapy has been approved as a treatment option for TNBC patients. Cancer cells employ several mechanisms to escape immune surveillance, including epigenetic changes which are key players in cancer progression, immunomodulation and metastasis. The histone methyltransferases EZH2, a promising biomarker of aggressiveness and poor clinical outcome, is over-expressed in TNBC and has been identified as a potential driver of metastasis. Paclitaxel (PTX), a taxane-based chemotherapy, is a standard of care neo adjuvant treatment for TNBC patients. Despite its common use, PTX alone is associated with limited improvement in survival in TNBC. We aimed to assess the efficiency of the combination of anti-proliferative ability of PTX and inhibition of EZH2 with a selective inhibitor (GSK343) in EZH2-overexpressing TNBC cell line MDA-MB-231 versus MCF-7. We report that the combination of PTX with EZH2 inhibitor GSK343 can significantly reduce cell viability, increase apoptosis and reduce both migration and invasion compared to PTX alone. Furthermore, PTX increased PD-L1 expression and tri-methylation of H3K27 in MDA-MB-231 which was mitigated by the addition of GSK343. In 3D model, PTX sensitizes MDA-MB-231 spheroids to GSK343 supporting the potential use of EZH2 inhibition as part of chemo-immunotherapy combination treatment against TNBC.
Keywords
<p>Triple negative breast cancer (TNBC), paclitaxel (PTX), immunotherapy, GSK343</p>
Article Details
Abbreviations: Breast cancer (BC), triple negative breast cancer (TNBC), paclitaxel (PTX)
Introduction
Triple negative breast cancer (TNBC), a subtype that lacks expression of estrogen receptor, progesterone receptor and HER2 overexpression, accounts for approximately 15-20% of breast cancer (BC), remains to be a challenging disease due to its aggressive nature. TNBC associates with earlier age of onset (premenopausal young women), higher rate of relapse and recurrence (25 % of patients relapse), higher metastatic potential (46% of patients develop distant metastasis) and shorter overall survival (mortality rate of 40 % within the first 5 years and median survival of 13.3 months after metastasis) (1-3). Neo-adjuvant cytotoxic chemotherapy including paclitaxel (PTX), doxorubicin, cyclophosphamide, anthracycline or platinum-based agents, is the standard treatment option for TNBC patients. Chemotherapy achieves better responses in TNBC than other BC subtypes and has been shown to improve initial outcome in early-stage and locally advanced patients (4). Recently, immune checkpoint blockade (ICB)-based immunotherapy, in combination with chemotherapy such as PTX, was granted Food and Drug Administration (FDA) approval for locally recurrent, unresectable, or metastatic TNBC tumors with PD-L1 expression ³ 10 combined positive score (5) and as adjuvant treatment for high-risk early-stage TNBC (6). PD-L1 based immunotherapy targets the immune checkpoint inhibitor PD-L1 to re-activate anti-tumor immunity reversing immunological tolerance.
Despite advancement in TNBC treatment, it remains a challenge largely due to resistance to therapy, recurrence and metastasis. Cancer cells employ several mechanisms to evade the immune system which not only contribute to progression, but resistance and metastasis. In fact, metastases resistant to adjuvant therapies are a major contributor to mortality in cancer. Epigenetic changes, including methylation dysregulation, are being increasingly recognized as key players in cancer progression, immunomodulation and metastasis. Methylation has been implicated in ICB resistance in melanoma partly by controlling gene expression of PD-1/PD-L1, interferon (IFN) gene signatures and T-cell exhaustion within the tumor microenvironment (7). Studies are underway targeting epigenetic elements in combination with immunotherapeutic agents (with chemotherapy) to overcome immune evasion and improve patients’ outcome to chemotherapy and immunotherapy (8). The importance of histone methyltransferases (HMTs) in methylation dysregulation in BC has made HMTs, such as EZH2, the focus of much research. EZH2 is highly expressed in TNBC and its expression has been found to be a promising biomarker of aggressiveness and poor clinical outcome (9). EZH2 functions predominantly by catalyzing the trimethylation of histone-3 lysine-27 (H3K27) which in turn transcriptionally silences target genes including genes involved in cancer immunity and metastasis of cancer cells. Bioinformatics analysis of epigenetic-associated genes in TNBC patients identified EZH2 as a potential driver of metastasis (10). The study found that an EZH2high subpopulation within TNBC exhibited enhanced invasion and migration potential and high sensitivity to EZH2 inhibition. There are several available selective and potent EZH2 inhibitors including the S-adenosyl-methionine (SAM)- competitive inhibitor, which binds the site of the substrate SAM in the binding pocket of EZH2 inhibiting its activity (11). One example is Tazemetostat which has been extensively studied and recently received FDA approval as an oral treatment for patients with hematologic and solid malignancies (12). Another example is GSK343 which has been shown to selectively suppress the methylation of histone H3K27 and inhibit EZH2 activity in breast and prostate cancers (13). GSK343 induced cell cycle arrest and senescence in TNBC cell lines in vitro and suppressed tumor growth in TNBC xenograft mouse module in combination with the chemotherapeutic drug Adriamycin (14). PTX, a taxane-based chemotherapy, is a standard of care neo adjuvant treatment for TNBC patients (15). It results in cell cycle arrest and apoptosis by targeting microtubules and disrupting the formation of mitotic spindles. Despite its common use, PTX alone improves progression free survival by 5.5 months in patients with locally advanced or metastatic disease (16), and while 22 % of patients treated with PTX achieve pathological response, patients who do not respond show relatively poor clinical outcome (17). As TNBC is characterized by high metastatic activity, we questioned whether the combination of anti-proliferative activity of PTX, with inhibition of metastasis by limiting EZH2 activity, can further improve the outcome of PTX treatment. The study aimed to assess the efficiency of the combination of PTX and GSK343 in non-TNBC MCF-7 cell line versus TNBC EZH2-overexpressing cell line MDA-MB-231. We also addressed whether the combination of PTX and GSK343 would condition TNBC to immunotherapy.
Results
Cytotoxicity of paclitaxel and GSK343 as single or combination treatment
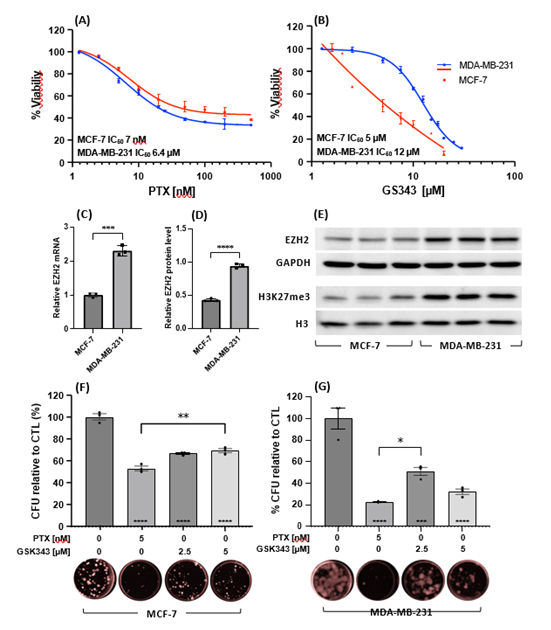
Cytotoxic effects of PTX and GSK343 in MCF-7 and MDA-MB-231 cell were evaluated by treating cells with increasing concentrations of either PTX [0-500 nM] or GSK343 [0-30 μM]. MCF-7 and MDA-MB-231 showed comparable responses to PTX with IC50 of 7 nM and 6.4 nM respectively (Figure 1A). GSK343 showed higher potency in MCF-7 (IC50 5 mM), compared to MDA-MB-231 (IC50 12 mM, Figure 1B). This is explained by higher EZH2 expression in MDA-MB-231 versus MCF-7 at the mRNA transcript (Figure 1C) and protein expression levels (Figure 1D) and higher EZH2 activity as measured by the level of tri-methylated H3K27 (Figure 1E). The prolonged cytotoxic effects of PTX and GSK343 were measured by clonogenic assay of MCF-7 and MDA-MB-231 cells treated for 10 days. PTX [5 nM] and GSK343 [2.5 and 5 μM] significantly reduced the capacity of MCF-7 cells to form viable colonies by 47%, 33% and 30%, (Figure 1F) and in MDA-MB-231 by 78%, 49% and 68% respectively (Figure 1E).
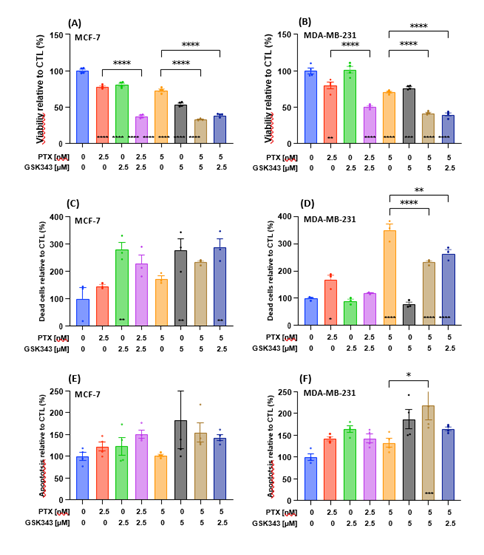
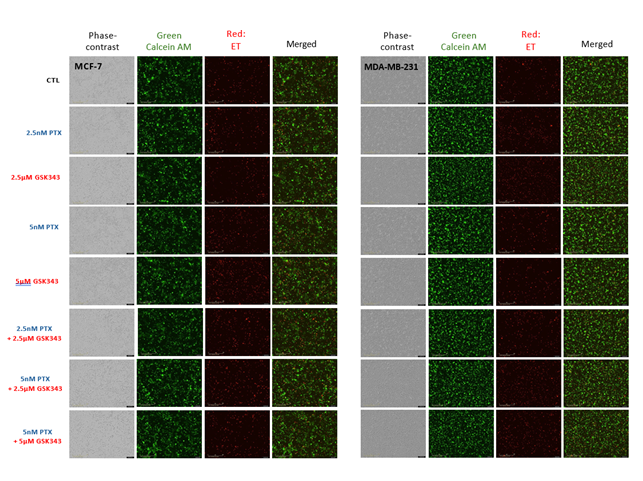
Next, we assessed the effect of selected concentrations of PTX, GSK343 or their combination on the viability of MCF-7 and MDA-MB-231 cells. Treatment with PTX or GSK343 significantly reduced viability of MCF-7, while the combination of PTX and GSK343 further reduced cell viability relative vehicle control and the corresponding treatment of PTX alone (Figure 2A). Similar changes in cell viability were observed in treated MDA-MB-231 cells, with the exception of treatment with 2.5 μM GSK343 which did not affect cell viability (Figure 2B). Treated cells were monitored live on the Incucyte® live-cell analysis system for quantitative detection of live, dead and apoptotic cells (representative images in S1). GSK343 alone and combinational treatment with PTX resulted in significant increase in MCF-7 cell death, while PTX alone did not increase cell death significantly (Figure 2C). Nevertheless, PTX alone increased MDA-MB-231 cell death in a dose-dependent manner and the combination with GSK343 to a lesser extent, while GSK343 as a single treatment did not affect MDA-MB-231 cell death (Figure 2D). The level of apoptosis was not affected significantly by any treatment condition in MCF-7 cells (Figure 2E), while the combination of PTX and GSK343 (5 nM and 5 μM respectively) was associated with increased number of apoptotic cells relative to vehicle control and to PTX alone (Figure 2F). In summary, the combinations of PTX and GSK343 significantly reduced viability of TNBC cells and increased apoptosis compared to PTX alone.
Figure 1: Cytotoxicity of PTX or GSK343 in MCF-7 and MDA-MB-231 cell lines. MCF-7 and MDA-MB-231 cells were treated with increasing concentrations of (A) PTX [0-500 nM] or (B) GSK343 [0-30 μM] and cell proliferation assay was performed 48 hrs post treatment by MTT assay. Relative EZH2 mRNA (C), EZH2 protein (D) and methylated H3K27 (E) were measured in untreated MCF-7 and MDA-MB-231 cell lines. Clonogenic capacity of (F) MCF-7 and (G) MDA-MB-231 cells following treatment with PTX [5 nM] or GSK343 [2.5 or 5 μM] for 10 days. Experiments were performed in triplicates and baseline corrected to 0 hours (A-B) or CTL treatment (F-G). Means of each treatment were statistically calculated using student’s T-test and * on the bar are compared to the control treatment. *** p<0.001, **** p<0.0001
Figure 2: Cytotoxicity of the combination of PTX and GSK343 in MCF-7 and MDA-MB-231 cell lines. Cells were treated with 0, 2.5 or 5 nM PTX or 0, 2.5 or 5 μM GSK343, or their combination. (A-B) Cell viability measured by MTT assay at 48 hrs following treatment. Cells were monitored live on the Incucyte live-cell analysis system and (C-D) the number of dead cells stained red with ethidium homodimer-1 and (E-F) the number of apoptotic cells stained with Annexin V per well. The number of dead cells was measured at 0, 24, 48 and 72 hrs and apoptosis were measured roughly every 5 hours up to 48 hrs post treatment. Areas under the curve were calculated and baseline corrected for the CTL treatment. Means were statistically compared by one-way ANOVA test and * on the bar represents comparison to the CTL treatment. * p<0.05, ** p<0.01, *** p<0.001, **** p<0.0001
The effect of paclitaxel and GSK343 as single or combination treatment on methylation and PD-L1 expression
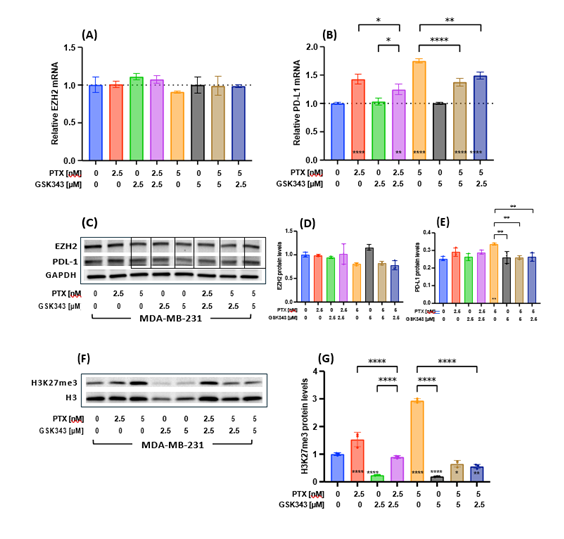
To assess the effect of PTX and GSK343 upon PTX-induced PD-L1-upregulation in MDA-MB-231, the levels of EZH2 and CD274 (PD-L1) mRNA transcript and protein expression were measured post treatment. The level of EZH2 mRNA transcript was unaffected by any treatment condition (Figure 3A). PTX alone was significantly associated with higher CD274 mRNA transcript level, while combination of PTX with GSK343 (either 2.5 or 5 μM) significantly reduced PTX-induced PD-L1-upregulation (Figure 3B). Similar results were observed at the protein level (Figure 3C-E). To assess the effect of different treatment conditions upon EZH2-dependent methylation, the levels of tri-methylated H3K27 were measured. PTX alone significantly increased tri-methylation of H3K27 in MDA-MB-231, while GSK343 significantly reduced the levels of H3K27me3 below vehicle control levels (Figure 3F-G). Interestingly, the combination of PTX and GSK343 resulted in significant reduction in PTX-induced methylation compared to PTX alone and below vehicle control levels. In summary, PTX treatment increased CD274 mRNA and H3K27 tri-methylation, which were both mitigated by the addition of the EZH2 inhibitor GSK343 rationalizing the combination of these two drugs.
Figure 3: Effect of PTX, GSK343 or their combinations on EZH2, PD-l1 and H3K27 methylation. (A) EZH2 and (B) PD-L1 transcript levels were measured with quantitative real time PCR at 48 hrs following treatment and (C) their protein levels measured by western blotting and (D-E) quantified relative to GAPDH. (F) Methylated H3K27 was measured by western blotting and (G) quantified relative to global H3 levels. Experiments were performed in triplicates and baseline correlated to CTL treatment. Means were statistically compared by one-way ANOVA test and * on the bar represents comparison to the CTL treatment. * p<0.05, ** p<0.01, *** p<0.001, **** p<0.0001.
Metastasis-related functions are affected by PTX and GSK343 combination
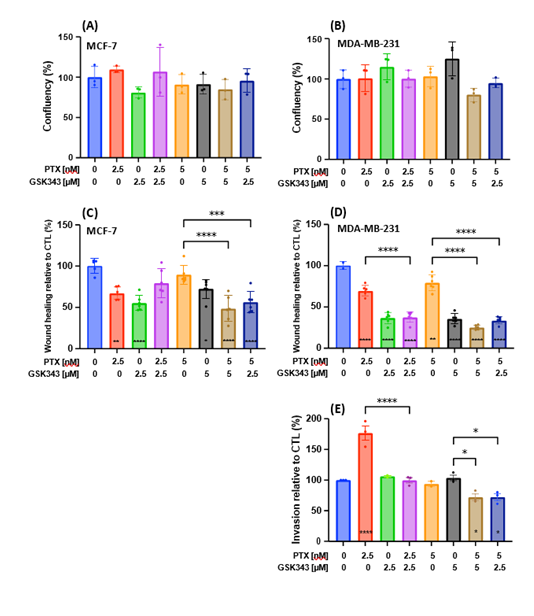
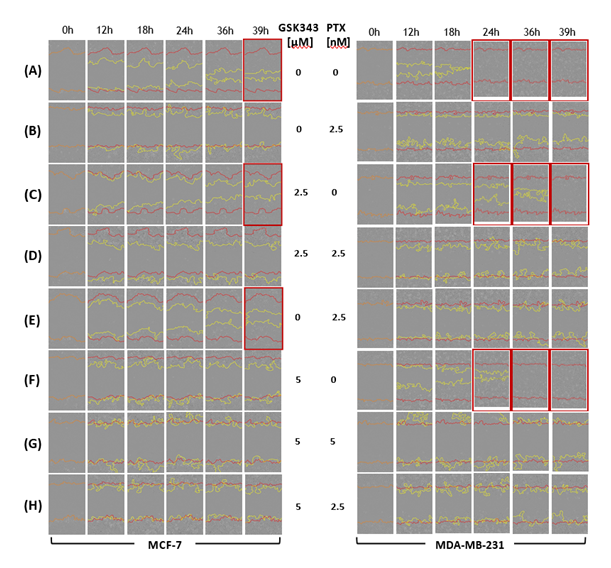
To assess phenotypic changes related to metastasis in treated MCF-7 and MDA-MB-231, first we needed to determine the viability of treated cells within the same time-frame using the Incucyte® live-cell analysis system. Cell viability was not affected significantly by any treatment condition for the first 24 hrs (Figure 4A-B). Nevertheless, GSK343 significantly reduced cell migration in MCF-7 (Figure 4C) and in MDA-MB-231 (Figure 4D). Although PTX reduced cell migration in MDA-MB-231 relative to vehicle control, the addition of GSK343 further reduced cell migration relative to PTX alone. Figure 5 represents images illustrating the migratory capacity of treated cells. MCF-7 did not show measurable invasive capacity in transwell invasion assay, while PTX increased cell invasion in MDA-MB-231 which was reduced below vehicle levels in combination with GSK343 (Figure 4E). In summary, the combination of PTX and GSK343 in MDA-MB-231 reduced both metastasis-related functions, cell migration and invasion, versus PTX alone, suggesting that this combination may potentially reduce invasiveness of TNBC cells.
Figure 4: Phenotypic analysis of MCF-7 and MDA-MB-231 cells treated with PTX, GSK343 or their combination. (A-B) Cell viability monitored as phase objective confluence and (C-D) cell migration measured as % wound healing up to 24 hrs post treatment on the Incucyte® live-cell analysis system. (E) Invasion of MDA-MB-231 cells measured using the QCM cell invasion kit 20 hrs post treatment [no invasion was observed in MCF-7]. Areas under the curve were calculated for triplicates and baseline corrected for CTL. Means were statistically compared by one-way ANOVA test and * on the bar represents comparison to the CTL treatment. * p<0.05, ** p<0.01, *** p<0.001, **** p<0.0001.
Cytotoxicity of paclitaxel and GSK343 as single or combination treatment against MCF-7 and MDA-MB-231 spheroids
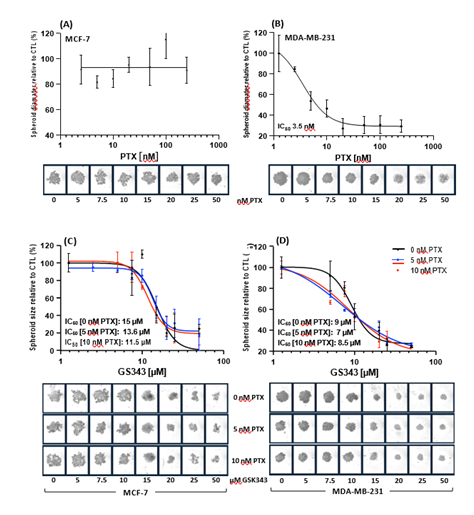
The cytotoxic effect of the PTX, GSK343 and their combination was assessed in a 3D model to mimic in vivo cell behavior and organization. MCF-7 spheroids showed no sensitivity for PTX (Figure 6A), while MDA-MB-231 spheroids showed high potency for PTX with an IC50 of 3.3 nM (Figure 6B). The combination of 0, 5 or 10 nM PTX with GSK343 showed comparable cytotoxic effect to MCF-7 with IC50 of 15, 13.6 and 11 nM respectively (Figure 6C). The combination of PTX (5 or 10 nM) with GSK343 showed a shift in spheroid size compared to PTX alone (Figure 6C). These findings suggest that PTX sensitizes MDA-MB-231 spheroids to GSK343.
Figure 6: Cytotoxicty of PTX, GSK343 or their combination in MCF-7 and MDA-MB-231 spheroids. (A-B) Dose-response of spheroids cultured in the presence of 0-500 nM PTX. (C-D) Dose-response spheroids cultured with GSK343 0-30 μM alone or in combination with either 5 or 10 nM of PTX. Spheroids were monitored in the Incucyte® live-cell analysis system for 7 days and spheroid size measured. Data represents biological duplicates (A-B) or triplicates (C-D). Areas under the curve for each treatment were calculated and baseline corrected for 0 hrs.
Discussion
In the present study, we report that dual treatment with PTX and EZH2 inhibitor can significantly reduce cell viability, increase apoptosis and reduce both migration and invasion compared to treatment with PTX alone in MDA-MB-231 TNBC cell line. Our cytotoxicity experiments identified the potency of PTX in MCF-7 and MDA-MB-231 cell lines demonstrating similar potency in both cell lines, which is in line with other reports in the literature (18). Furthermore, the potency of GSK343 in MCF-7 and MDA-MB-231 cell lines was identified showing higher potency in MCF-7 cells possibly due to significantly lower EZH2 expression in MCF-7 cells. The concentrations of 2.5 and 5 nM PTX were selected for combinational treatment with GSK343. It has been shown that MDA-MB-231 cells treated with 5 nM of PTX had similar intracellular concentration of PTX as the intra-tumoral concentration in patients mimicking the clinical setting (19). Although, treatment of MDA-MB-231 cells with either PTX or GSK343 significantly reduced colony formation capacity, some colonies are still able to form. MDA-MB-231 cells that survive high concentration of PTX treatment and long duration are highly proliferative and tumorigenic and share characteristics of cancer precursor cells (20), emphasizing the importance of means to eradicate residual cells to prevent resistance, recurrence and metastasis.
This is the first report to explore the combination of PTX with GSK343 in MCF-7 and MDA-MB-231 cell lines. We demonstrate that the combinations of 5 nM PTX + 2.5 μM GSK343 and 5 nM PTX + 5 μM GSK343 significantly reduced cell viability and increased the percentage of apoptotic cells compared to PTX alone. Importantly, these combinations show significantly lower cell migration and invasion capacities in MDA-MB-231 TNBC cell lines. Previous reports have shown that over expression of EZH2 in TNBC induces repression of TIMP2 transcription increasing the invasiveness of TNBC cells (21). Furthermore, in line with our findings, EZH2 has been shown to promote cell migration and invasion without significantly altering cell proliferation potential by suppressing E-cadherin in pancreatic cancer (22). Inhibition of EZH2 activity has been shown to differentiate metastatic EZH2high population of TNBC to luminal-like phenotype blocking metastasis (10). Therefore, the combination of the anti-proliferative activity of PTX and reduced migration and invasion potential of EZH2 inhibition could serve as an optimised treatment to condition TNBC for immunotherapy. Interestingly, treatment of MDA-MB-231 with PTX alone increased methylation of H3K27 by 2-folds, potentially activating the transcription of EZH2-target genes resulting in a marked increase in metastasis as observed in our report. Meanwhile, the dual treatment with EZH2 inhibition by GSK343 significantly reduced tri-methylation of H3K27. Consistent with our results, several studies have reported chemotherapy-induced PDL-1 upregulation in different cancer resulting in local immune suppression in ovarian cancer (23). Our results show that inhibition of EZH2 activity by GSK343 can reduce PTX-induced PDL-1-upregulation to baseline levels.
Materials and Methods
Breast cancer cell lines
Human breast cancer cell lines MDA-MB-231(HTB-26) and MCF7 (HTB-22) were purchased from American Type Culture Collection (ATCC) and maintained in Dulbecco's Modified Eagle Medium (DMEM) contained 25 mM D-Glucose (Gibco) supplemented with 10% heat-inactivated fetal bovine serum and 1% penicillin/streptomycin. Cells were maintained at 37°C, 5% CO2 and humidified atmosphere. 24 hrs following seeding, cells were treated with nanoparticle albumin–bound paclitaxel (nab-PTX SLBH6026V) [0-500 nM] or GSK343 (SML-0766) [0-30 μM] or combination at the concentrations: 2.5 nM PTX + 2.5 μM GSK343, 5 nM PTX + 2.5 μM GSK343 or 5 nM PTX + 5 μM GSK343. Vehicle control (CTL) cells were cultured in the same concentration of DMSO (0.05%).
MTT cell proliferation assay
48 hrs post following treatment, MTT assay was performed according to the manufacture’s instruction and absorbance was measured at 570 nm and reference with 690 nm using NanoQuant infinite M200 pro microplate reader. Four biological replicates were used for each condition.
Colony formation assay
Cells were treated as previously described and then cultured for 10 days. Media was refreshed with the respective concentration of GSK343 every 72 hrs. Colonies were then fixed with methanol, stained with 0.1% crystal violet and scanned on the iBright™ CL1500 Imaging System. For colony formation quantitation, following treatment with 10% acetic acid, absorbance of dissolved crystal violet was measured with NanoQuant infinite M200 pro microplate reader at 595 nm and colony formation ratio unit relative to CTL was calculated.
Live cell monitoring on the IncuCyte® live-cell system
Live, dead and apoptotic cells
Treated cells were stained with Live/Dead® viability/cytotoxicity kit (L3224) according to manufacturer instructions and incubated in the IncuCyte® live-cell system. Readings and images were recorded at 24 hrs intervals up to 96 hrs. Viability was measured as phase objective confluence (%), live cells as the number of green object counts per well and dead cells as the number of red object counts per well. Apoptotic cells were stained with Incucyte® Annexin V dyes kit (4759) according to the manufacture’s protocol. Annixen V flourescence measued as red object counts per well was captured at 5 hrs intervals up to 96 hrs.
Scratch wound healing cell migration assay
A scratch was made in cell-confluent plates using a 96-pin WoundMaker (Essen BioScience). Cells were then gently washed with pre-warmed growth medium to remove dislodged cells and cell debris and fresh media with treatment was added. Wound healing was monitored in the Incucyte® live-cell analysis system up to 48 hrs and relative wound density was measured (images were taken at 0, 12, 18 and 24, 36 and 39 hrs).
Spheroid generation and cell viability
1000 cells were seeded in Ultra-low attachment 96 well round bottom cell culture plates in complete growth medium, centrifuged at 290g for 10 minutes and incubated in 37°C, 5% CO2 for 7 days. PTX, GSK343 or combination were added to each well and plates were monitored in the IncuCyte® live-cell system. Spheroid images and area (μm2) were measured at 24 hr intervals for 7 days. Data presents the mean of technical triplicate experiments.
Total RNA isolation and RT-qPCR
RNA was extracted from MDA-MB-231 and MCF7 cell that were treated with different conditions for 48 hrs using the PureLink RNA Mini Kit according to the manufacturer’s protocol. RNA quantity and quality was measured using the Nanodrop spectrophotometer. cDNA was synthesized using the high-capacity cDNA reverse transcription kit according to the manufacturer’s instructions. Quantitative RT-PCR (RT-qPCR) was performed with PowerUp SYBR Green Master Mix in 15µl volume. The primers for RT-qPCR reactions were as follows: EZH2, 5`- TGGACTCTGTTCGCTCAGGT-3` and 5`-TGCCTCCTTCCGTACCACAT-3`; CD274, 5`- TGCCGACTACAAGCGAATTACTG-3`, 5`- CTGCTTGTCCAGATGACTTCGG-3` and reference gene TUBB primer sequence as 5`- TGGACTCTGTTCGCTCAGGT-3` and 5`- TGCCTCCTTCCGTACCACAT-3`. The RT-qPCR was performed on QuantStudio™ 7 Flex Real-Time PCR System (Applied Biosystems, Waltham, MA, USA). The relative gene expression was determined using 2-ΔΔCt and results presented as the mean gene expression ± standard deviation.
Protein extraction and Western blot analysis
Treated cells were lysed in RIPA buffer according to the manufacturer’s protocol. Protein was quantified using the DC (detergent compatible) protein assay kit. For immunoblotting, 20µg of protein with equal volume SDS loading buffer was boiled at 95oC for 5 minutes. Proteins were resolved on 4-15% gradient pre-casted gel and transferred to PVDF membrane. Blots were probed with primary antibodies; H3K27me3 monoclonal Ab (MA5-11198), EZH2 monoclonal Ab (MA5-18108), PD-L1 Ab (E1L3N), H3 (D1H2), Beta-actin or GAPDH (14C10) and the compatible secondary antibody. Blots were developed with SuperSignal™ West Pico PLUS Chemiluminescent Substrate and imaged on the ChemiDocTMMP imaging system. The intensities of protein bands were quantified using TotalLab Quant software and normalized to either GAPDH, Beta-actin or H3.
Cell invasion assay
For cell invasion, cells were seeded into the insert chamber in medium without FBS and medium with 10% FBS was added to the lower well. 20 hrs post treatment, cells that invaded the matrix were fixed with methanol and stained with 0.1% crystal violet. Images were taken under the light microscope. The quantitation of transwell invasion by fluorescence-based assay was performed using the QCMTM24-Well cell invasion assay kit following manufacture’s protocol. After treatment, invading cells were lysed with lysis buffer and dyed with CyQuant GR dye. Fluorescence was measured on FLUOstar Omega (BMGLABTECH) microplate reader at 480/520nm.
Statistical analysis
All statistical analysis was performed using GraphPad Prism® (v.7, GraphPad Software). The types of tests performed are indicated in respective Figure legends.
References
- Yin L, Duan JJ, Bian XW, et al. Triple-negative breast cancer molecular subtyping and treatment progress. Breast Cancer Research: BCR 22 (2020).
- Garrido-Castro AC, Lin NU, & Polyak K. Insights into molecular classifications of triple-negative breast cancer: Improving patient selection for treatment. Cancer Discovery 9 (2019): 176–198.
- Dent R, Trudeau M, Pritchard KI, et al. Triple-negative breast cancer: clinical features and patterns of recurrence. Clinical Cancer Research: An Official Journal of the American Association for Cancer Research 13 (2007): 4429–4434.
- Bou Zerdan M, Ghorayeb T, Saliba F, et al. Triple Negative Breast Cancer: Updates on Classification and Treatment in 2021. Cancers14 (2022).
- FDA grants accelerated approval to pembrolizumab for locally recurrent unresectable or metastatic triple negative breast cancer | FDA (2020).
- FDA approves pembrolizumab for high-risk early-stage triple-negative breast cancer | FDA. (2021).
- Emran AAl, Chatterjee A, Rodger EJ, et al. Targeting DNA Methylation and EZH2 Activity to Overcome Melanoma Resistance to Immunotherapy. Trends in Immunology. Elsevier Ltd (2019).
- Dunn J, & Rao S. Epigenetics and immunotherapy: The current state of play. Molecular Immunology. Elsevier Ltd (2017).
- Chang CJ & Hung MC. The role of EZH2 in tumour progression. British Journal of Cancer106 (2012): 243–247.
- Yomtoubian S, Lee SB, Verma A, et al. Inhibition of EZH2 Catalytic Activity Selectively Targets a Metastatic Subpopulation in Triple-Negative Breast Cancer. Cell Reports30 (2020): 755-770.
- Verma SK, Tian X, Lafrance Lv, et al. Identification of Potent, Selective, Cell-Active Inhibitors of the Histone Lysine Methyltransferase EZH2. ACS Medicinal Chemistry Letters3 (2012):
- FDA granted accelerated approval to tazemetostat for follicular lymphoma | FDA (2020).
- Song X, Gao T, Wang N, et al. Selective inhibition of EZH2 by ZLD1039 blocks H3K27methylation and leads to potent anti-tumor activity in breast cancer. Scientific Reports6 (2016):
- Yu Y, Qi J, Xiong J, et al. Epigenetic Co-Deregulation of EZH2/TET1 is a Senescence-Countering, Actionable Vulnerability in Triple-Negative Breast Cancer. Theranostics9 (2019): 761–777.
- Mustacchi G, & de Laurentiis M. The role of taxanes in triple-negative breast cancer: literature review. Drug Design, Development and Therapy9 (2015):
- Schmid P, Adams S, Rugo HS, et al. Atezolizumab and Nab-Paclitaxel in Advanced Triple-Negative Breast Cancer. The New England Journal of Medicine379 (2018): 2108–2121.
- Liedtke C, Mazouni C, Hess KR, et al. Response to neoadjuvant therapy and long-term survival in patients with triple-negative breast cancer. Journal of Clinical Oncology: Official Journal of the American Society of Clinical Oncology26 (2008b): 1275–1281.
- Zajdel A, Nycz J, & Wilczok A. Lapatinib enhances paclitaxel toxicity in MCF-7, T47D, and MDA-MB-321 breast cancer cells. Toxicology in Vitro75 (2021):
- Zasadil LM, Andersen KA, Yeum D, et al. Cytotoxicity of paclitaxel in breast cancer is due to chromosome missegregation on multipolar spindles. Science Translational Medicine6 (2014):
- Jeong YJ, Kang JS, Lee SI, et al. Breast cancer cells evade paclitaxel-induced cell death by developing resistance to dasatinib. Oncology Letters12 (2016):
- Chien Y-C, Liu L-C, Ye H-Y, et al. EZH2 promotes migration and invasion of triple-negative breast cancer cells via regulating TIMP2-MMP-2/-9 pathway. American Journal of Cancer Research8 (2018b):
- Han T, Jiao F, Hu H, et al. EZH2 promotes cell migration and invasion but not alters cell proliferation by suppressing E-cadherin, partly through association with MALAT-1 in pancreatic cancer. Oncotarget7 (2016):
- Peng J, Hamanishi J, Matsumura N, et al. Chemotherapy induces programmed cell death-ligand 1 overexpression via the nuclear factor-κBto foster an immunosuppressive tumor microenvironment in Ovarian Cancer. Cancer Research75 (2015): 5034–5045.
Figure S1: Visualization of live, dead and apoptotic MCF-7 and MDA-MB-231 cells treated with PTX, GSK343 or combination. MCF-7 and MDA-MB-231 cells were treated with 0, 2.5 or 5 nM PTX or 0, 2.5 or 5 μM GSK343, or combination. Cells were monitored live on the Incucyte live-cell analysis system up to 96 hrs post treatment. Live cells were stained with Calcein AM green dye and dead cells with Ethidium homodimer red fluorescence.


 Impact Factor: * 6.2
 Acceptance Rate: 76.33%
  Time to first decision: 10.4 days
  Time from article received to acceptance: 2-3 weeks