The Influence Factors of Mean Particle Size and Positive Control of Bacterial Filtration Efficiency System
Yayi Yi*,1,2, Dianlong Shi1, Chunlei He1,2, Kai Liu1,2, Qiangqiang He1
1Qingdao Junray Intelligent Instrument Co., Ltd., Qingdao, 266237, PR China
2Qingdao Key Laboratory of Particulate Matter Measurement and Application Technology
*Corresponding author: Yayi Yi, Qingdao Junray Intelligent Instrument Co, Ltd, Qingdao, 266237, PR China.
Received: 30 October 2023; Accepted: 07 November 2023; Published: 15 November 2023
Article Information
Citation: Yayi Yi, Dianlong Shi, Chunlei He, Kai Liu, Qiangqiang He. The Influence Factors of Mean Particle Size and Positive Control of Bacterial Filtration Efficiency System. Fortune Journal of Health Sciences. 6 (2023): 450-456
View / Download Pdf Share at FacebookAbstract
The Coronavirus Disease 2019 (COVID-19) has swept the whole world with high mortality. Since aerosol transmission is the main route of transmission, wearing a mask serves as a crucial preventive measure. An important parameter to evaluate the performance of a mask is the bacteria filtration efficiency (BFE). Aerosol mean particle size (MPS) and positive control value (PCV) are two key indexes of BFE system. In this study, we investigated the influence of Andersen sampler, spray flow, medium thickness, and peristaltic pump flow on MPS of bacterial aerosols and PCV of BFE system, respectively. The results show that the machining accuracy of Andersen sampler has great influence on aerosol MPS and PCV. With the increase of aerosol spray flow rate, the PCV will increase gradually, but the effect on MPS is not a simple linear relationship. As the agar medium thickness increased, the PCV and MPS increased gradually. With the increase of peristaltic pump flow, the PCV increased gradually, while the MPS was basically in a downward trend. When the peristatic pump flow rate was 0.1mL/min, the spray flow rate was 7.2L/min, the agar plate thickness was 27mL, and the Andersen sampler of Beijing Mingjie was used for the experiment, the aerosol MPS and PCV were both within the acceptable range and were the optimal parameters. This study provides guidance for the manufacturers of the BFE system and improves the protective performance of masks, which is important for the human health, especially during the occurrence of viral pandemics such as "COVID-19".
Keywords
<p>COVID-19; Mask; BFE system; MPS; PCV</p>
Article Details
1. Introduction
In December 2019, an outbreak of the Coronavirus Disease 2019 (COVID-19) occurred in the city of Wuhan, China. The COVID-19 has hit all regions in China and almost all countries worldwide at an unprecedented transmission rate, and was declared as a Public Health Emergency of International Concern (PHEIC) by the World Health Organization (WHO) [1]. The occurrence of viral pandemics with extensive transmission and the associated health impact is a big concern around the globe, which raises the importance of respiratory protection against the viral transmission. Aerosol transmission is the main routes of COVID-19 transmission. Coughing, sneezing, and talking can transmits microbial aerosols through the air, potentially carrying infectious diseases [2]. The associated risk can be exacerbated when pathogenic microbials including bacteria and virus are present in the air [3-6]. The role of respiratory protection becomes particularly important in the occurrence of viral pandemics such as "COVID-19", SARS, and H1N1 influenza [7,8]. Mask has been used for more than 100 years to prevent the spread of respiratory infectious diseases and surgical infections [9-15]. The role of mask is to prevent harmful aerosols from the human body instead of being inhaled into the lungs, including dust, smoke, bacteria, and virus. Using masks to prevent viral transmission has been recommend by many international guidelines [16–18]. MacIntyre et al. [19] reported that masks can reduce the risk of influenza infection significantly. Brienen et al. [20] showed that population-wide use of face masks could make an important contribution in delaying an influenza pandemic.
Van der Sande et al. [21] have indicated that the protective factor of surgical masks was 4.1–5.3, while the protective factor of homemade masks was 2.2–2.5, which could reduce the respiratory infections of the population to a certain extent. With the outbreak of "COVID-19", the disposable masks are in short supply, and the demand for masks bacterial filtration efficiency detector is rising rapidly [22]. From 20 Jan 2020 to 30 Jun 2020, the largest daily facemask shortages in China were predicted to be 589.5, 49.3, and 37.5 million in the mask-wearing policy in all regions of mainland, the mask-wearing policy only in Hubei province, and the non-implementation of the mask-wearing policy in other region, respectively [23, 24].An important parameter to evaluate the performance of a mask is the bacteria filtration efficiency (BFE) [25]. BFE refers to the percentage of the respirator material filtered out of the bacteria-containing suspended particles under the specified flow rate, which reflects the filtration of the respirator. The protective performance of a mask mainly depends on the filtration efficiency of the mask. How to ensure the mean particle size (MPS) of bacterial aerosols and the PCV are the most critical indicators of the mask BFE detector and is also the current research hotspots [26]. In this study, the major influence factors of the MPS and PCV of the BFE system were investigated, including Andersen sampler, spray flow, medium thickness, and peristaltic pump flow, which provides guidance for the manufacturers of the BFE detector and improve the protective performance of masks under the pandemics of COVID-19.
2. Materials and Methods
2.1 Materials
Tryptic soy agar (TSA), tryptic soy broth (TSB), peptone water, staphylococcus aureus ATCC6538, petri dish (φ90 mm), and vaccination ring
2.2 Equipment
High pressure steam sterilization pot (121°C~123°C), incubator (constant temperature 37°C±2°C), vortex type vortex mixer (up to 16 mm × 150 mm tube), orbital vibrator (100 r/min~250 r/min), refrigerator (2°C~8°C), bacteria filtration efficiency detector (ZR-1000, Qindao Junray Intelligent Instrument Co., Ltd), and colony counter (ZR-1100, Qindao Junray Intelligent Instrument Co., Ltd).
2.3 Experimental methods
2.3.1 Determination method of bacterial suspension concentration
A strain of staphylococcus aureus was vaccinated into 100mL TSB, then exposed to an incubator under 100r/min at 37°C. After 24h, the bacterial suspension was obtained. 1mL bacterial suspension was added to the test tube with 9mL peptone solution (1.5%), then diluted step by step to 10-7, and 0.1mL diluted bacterial suspension from 10-5 to 10-7 test tubes was added to TSA plate for culture. Two parallel plates were made for each gradient, then put them into the incubator at 37°C for 24h. Statistic the bacterial count of each TSA plate, then take the colony number of (0-100) CFU flat gradient to count, and the concentration of bacteria suspension concentrate can be calculated. Then diluted 1 mL bacteria suspension to about 5×10⁵ CFU/mL, and 20 mL of which were prepared.
2.4 PCV calculation
Perform a positive control run without a test specimen by BFE detector. Initiate the bacterial suspension by turning on the vacuum pump and adjust the flow rate through the Andersen sampler to 28.3L/min. Deliver the bacterial suspension by the peristaltic pump for 1 min. Sampling for 2 min, and the bacteria aerosols were collected on agar medium. Agar plate were cultivated in the incubator at (37±2)°C for (24±4) h, then count the number of staphylococcus aureus colonies on each plate, and use the “positive hole” conversion table in accordance with the instructions of the Andersen sampler manufacturer for stages 3 to 6. The sum of staphylococcus aureus colonies on each stage is a PCV of detector, and take the mean of the two totals for two positive control runs. ASTM F2101-2014 Evaluating the bacterial filtration efficiency (BFE) of medical face mask materials, using a biological aerosol of staphylococcus aureus [27] and BS EN 14683:2019 Medical face masks - Requirements and test methods [28] specifies, PCV should be within the scope of the (1700-3000) CFU.
2.5 Bacterial aerosol MPS calculation
After sampling, the agar medium were cultivated in the incubator at (37±2)°C for (24±4) h. From the positive control plates, the MPS of bacterial aerosol was calculated using the formula (1). BS EN 14683:2019 Medical face masks - Requirements and test methods [28] and YY0469-2011 Medical surgical masks technical requirements [29] rules, the MPS should be within the scope of (3.0±0.3) um.
Table 1: Andersen sampler particle size and colony count at all levels.
|
Stage number |
1 |
2 |
3 |
4 |
5 |
6 |
|
Size of particle |
P1 |
P2 |
P3 |
P4 |
P5 |
P6 |
|
Viable “particle” plate count |
C1 |
C2 |
C3 |
C4 |
C5 |
C6 |
Where P1=7.00um;P2=4.70um;P3=3.30um;P4=2.10um;P5=1.10um;P6=0.65um.
C1+C2+C3+C4+C5+C6 refer to PCV.
3. Results and Discussion
3.1 The influence of Andersen sampler
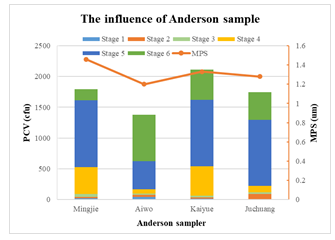
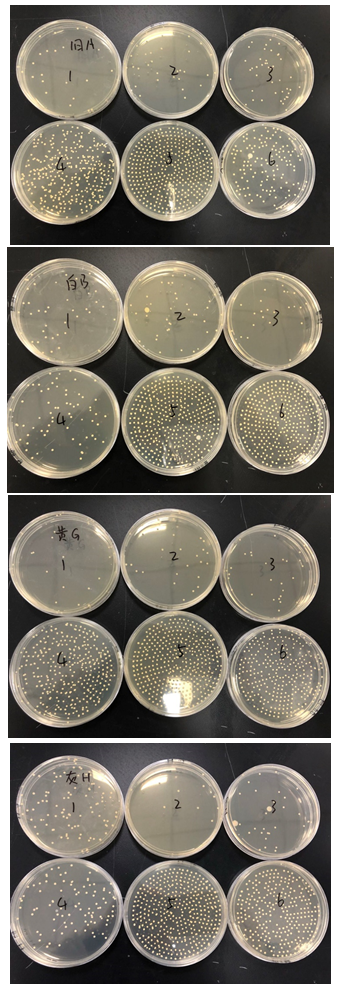
Four Andersen sampler from different manufacturers were selected to compare the influence of Andersen sampler in the aerosol MPS and PCV, including Beijing Mingjie, Qingdao Kaiyue, Qingdao Juchuang and Weifang Aiwo. The experiment condition was set as: the peristaltic pump flow is 0.1 mL/min, the spray flow is 10 L/min, and agar medium thickness is 15 mL. PCVs and aerosol MPS with different Andersen sampler manufacturer were shown in Table 2. By comparing and testing the Andersen sampler from different manufacturers, it is found that the aerosol MPS and PCV calculated from the experimental results of the Andersen sampler from different manufacturers is different under the same experimental conditions. The PCV of other three experiments were all within the scope of (1700-3000) CFU except using the Weifang Aiwo’s Andersen sampler. The order of aerosol MPS is Beijing Mingjie > Qingdao Kaiyue > Qingdao Juchuang > Weifang Aiwo, so the Beijing Mingjie’ Andersen sampler was recommended. The design principle of Andersen sampler is as follows: when microbial aerosols pass through a nozzle or jet stream, they shoot at the front impingement plate (or the surface of the medium) according to the principle of inertia, deflecting the airflow 90°~180°. Particles of sufficient momentum, acting by inertia, move in a straight line in the original direction without following the deflection of the fluid, and are collected by impingement on the collecting plate (or on the surface of the medium). Smaller particles can follow the fluid along the streamline under the air flow without crashing down, and these bacteria-bearing particles will slip off or escape because of their small inertia. The Andersen sampler can divide the bacterial aerosol into two parts. Particles larger than a certain aerodynamic diameter can crash down from the airflow, and smaller particles can escape with the aerosol fluid passing through the sampler. As each manufacturer has different requirements for pore accuracy, the size of bacterial aerosol captured by Andersen sampler of each manufacturer is also different, so the calculated aerosol MPS is also different. The pore size and capture particles range of Andersen sampler is shown in Table 3.
Table 2: PCV and aerosol MPS with different Andersen sampler manufacturer.
|
Sampler |
Bejing Mingjie |
Weifang Aiwo |
||
|
Peristaltic pump flow |
0.1 mL/min |
0.1 mL/min |
||
|
Spray flow |
10 L/min |
10 L/min |
||
|
Spray pressure |
21.2 kPa |
21.2 kPa |
||
|
Tablet thickness |
15 mL |
15 mL |
||
|
The stage number |
The positive pole count (r) |
Viable “particle” plate count (C) |
The positive pole count (r) |
Viable “particle” plate count (C) |
|
1 |
19 |
19 |
40 |
40 |
|
2 |
25 |
25 |
34 |
34 |
|
3 |
43 |
45 |
23 |
24 |
|
4 |
265 |
434 |
60 |
65 |
|
5 |
374 |
1093 |
274 |
462 |
|
6 |
144 |
179 |
339 |
752 |
|
PCV |
/ |
1795 |
/ |
1377 |
|
MPS |
1.46 |
1.2 |
||
|
Sampler |
Qingdao Kaiyue |
Qingdao Juchuang |
||
|
Peristaltic pump flow |
0.1 mL/min |
0.1 mL/min |
||
|
Spray flow |
10 L/min |
10 L/min |
||
|
Spray pressure |
20.8 kPa |
20.8 kPa |
||
|
Tablet thickness |
15 mL |
15 mL |
||
|
The stage number |
The positive pole count (r) |
Viable “particle” plate count (C) |
The positive pole count (r) |
Viable “particle” plate count (C) |
|
1 |
13 |
13 |
10 |
10 |
|
2 |
23 |
23 |
81 |
81 |
|
3 |
22 |
23 |
28 |
29 |
|
4 |
280 |
482 |
88 |
99 |
|
5 |
370 |
1078 |
373 |
1078 |
|
6 |
283 |
492 |
269 |
447 |
|
PCV |
/ |
2069 |
/ |
1744 |
|
MPS |
1.33 |
1.28 |
||
Table 3: The pore size and scope of capture particles of Andersen sampler
|
Andersen sampler stages |
Pore size (mm) |
The scope of capture particles (um) |
|
Stage 1 |
1.18 |
>7.0 |
|
Stage 2 |
0.91 |
4.7~7.0 |
|
Stage 3 |
0.71 |
3.3~4.7 |
|
Stage 4 |
0.53 |
2.1~3.3 |
|
Stage 5 |
0.34 |
1.1~2.1 |
|
Stage 6 |
0.25 |
0.65~1.1 |
3.2 The influence of spray flow rate
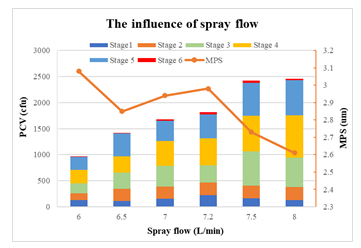
Different spray flow rates were set to compare the effects of spray flow in the aerosol MPS and PCV, including 6.0, 6.5, 7.0, 7.2, 7.5, and 8.0 L/min. The experiment condition was set as: the peristaltic pump flow is 0.1 mL/min, agar medium thickness is 25 mL, and Beijing Mingjie’ Andersen sampler was selected. The PCVs and aerosol MPS at different spray flow rates were shown in Figure 3. The PCV increases gradually with the increase of the flow rate of the sprayer, which may due to the increasing spray flow blowing more bacterial aerosols to the air chamber. However, there is no linear relationship between aerosol MPS and aerosol flow rate. When the spray flow rate is 7.2 L/min and 7.5 L/min, the PCVs conform to the range of (1700-3000) CFU, and the MPS of aerosol fall within the scope of (3.0±0.3) um. Compared to the MPS of aerosol under spray flow rate of 7.5 L/min, when the spray flow rate is 7.2 L/min, the MPS is maximum and the flow for this sprayer is the most appropriate option on the premise of meeting the standard value of positive control. The mean aerosol particles depend on comprehensive influence, including the size of the sprayer, spray flow rate, flow of peristaltic pump, physical properties of bacteria aerosol, pore diameter, the relative position and angle of fluid pore in mixing chamber of sprayer, so the appropriate spray flow will be different for every sprayer due to very slight error on each sprayer processing.
3.3 The influence of agar medium thickness
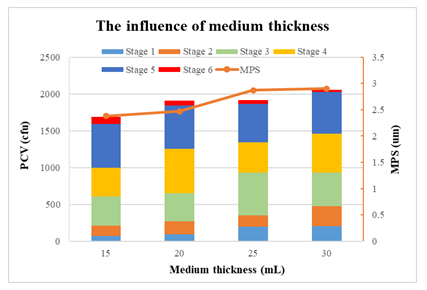
Different agar medium thickness of 15, 20, 25, and 30 mL were prepared to compare the influence of the thickness of agar medium in the aerosol MPS and PCV. The experiment condition was set as: the peristaltic pump flow is 0.1 mL/min, the spray flow rate is 7.2 L/min, and Beijing Mingjie’ Andersen sampler was selected. The PCVs and aerosol MPS under different medium thickness were shown in Figure 4. As the agar medium thickness increased, both the PCV and aerosol MPS increased gradually. When the agar medium thickness was 25mL or 30mL, the MPS could meet the requirement of (3±0.3) um. This is because the impact distance has an influence on the sampling efficiency. The aerosol particles cannot come down if the distance is too far, while it is difficult to operate with short distance. The impact distance of the Andersen sampler is about 2.5mm. When the sampler structure is fixed, the thickness of the agar medium in the plate determines the impact distance. Adding 24, 27 and 30mL agar medium to the petri dish, respectively, and their impact distances were 3, 2.5 and 2.0mm. But the percentage distribution of the three impact distance particles in the six nodes was roughly similar. Therefore, Ranz and Wong [30] recommend that adding 27mL agar medium into Andersen sampler is optimal.
3.4 The influence of peristaltic pump flow
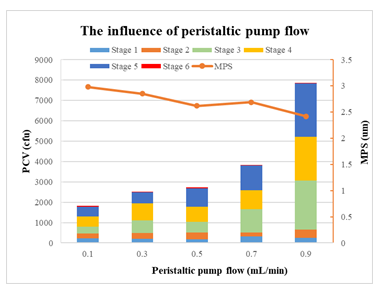
Different peristaltic pump flow rate was selected to compare the influence of peristaltic pump flow in the aerosol MPS and PCV, including 0.1, 0.3, 0.5, 0.7, 0.9 mL/min. The experiment condition was set as: the spray flow rate is 7.2 L/min, agar medium thickness is 25 mL, and Andersen sampler of Beijing Mingjie was selected. The PCVs and aerosol MPS under different peristaltic pump flow were shown in Figure 5. With the increase of peristaltic pump flow, the PCV gradually increased, while the aerosol MPS was basically in a downward trend. When the peristaltic pump flow was 0.1mL/min, the aerosol MPS reached its maximum value. This may be attributed to that the microbial quantity of bacterial aerosols entering the sprayer increased with the peristaltic pump flow under the same spray flow. However, small particle aerosols produced far more than large particles of bacterial aerosols, so the MPS of aerosols in a downtrend basically although the positive value increases gradually. Therefore, we suggest that the peristaltic pump flow of 0.1mL/min is the most appropriate option.
4. Conclusion
The mask BFE is one of the key indicators for detecting masks. The aerosol MPS and PCV are the key parameters of BFE system. This study discusses the major influence factors of the MPS of bacterial aerosols and PCV of BFE system, including Andersen sampler, spray flow, agar medium thickness, and peristaltic pump flow. The experimental results show that the machining precision of Andersen sampler have great influence on aerosol MPS and PCV. With the increase of spray flow rate, the PCV will increase gradually, but the effect on aerosol MPS is not a simple linear relationship. As agar medium thickness increased, the PCV and aerosol MPS increased gradually. With the increase of peristaltic pump flow, the PCV increased gradually, while the aerosol MPS was basically in a downward trend. When the peristatic pump flow rate was 0.1mL/min, the spray flow rate was 7.2L/min, the agar medium thickness was 27mL, and the Andersen sampler of Beijing Mingjie was used for the experiment, the PCV and aerosol MPS were both within the acceptable range and were the optimal parameters. This study provides guidance for manufacturers of BFE detector and theoretical basis for testing institutions to test the BFE of masks, which is important for the human health, especially during the occurrence of viral pandemics such as "COVID-19".
References
- WHO. Statement on the Second Meeting of the International Health Regulations (2005) Emergency Committee Regarding the Outbreak of Novel Coronavirus (2019-nCoV) (2020).
- Seojin Jung, Jaejin An, Hyungjin Na, Jooyoun Kim. Surface Energy of Filtration Media Influencing the Filtration Performance against Solid Particles, Oily Aerosol, and Bacterial Aerosol. Polymers 11 (2019): 935.
- Yan D, Zhang T, Su J, Zhao L-L, Wang H, Fang X-M, et al. Structural variation in the bacterial community associated with airborne particulate matter in Beijing, China, during Hazy and Nonhazy Days. Appl. Environ. Microbiol 84 (2018): e00004-18.
- Ding, Zhezheng Yi, Yayi, Wang, Wenxing, Zhang, et al. Understanding the role of Cl and NO3 radicals in initiating atmospheric oxidation of fluorene: A mechanistic and kinetic study. Science of the Total Environment 716 (2020): 136905.
- Ding Zhezheng; Yi, Yayi; Wang, Wenxing; Zhang, Qingzhu. Atmospheric oxidation of indene initiated by OH radical in the presence of O2 and NO: A mechanistic and kinetic study. Chemosphere, 2020, 259, 127331.
- Ding, Zhezheng, Yi Yayi, Wang, Wenxing, Zhang, et al. Atmospheric degradation of chrysene initiated by OH radical: A quantum chemical investigation. Chemosphere 263 (2021): 128267.
- Ali MU, Liu G, Yousaf B, Ullah H, Abbas Q, Munir MAM. A systematic review on global pollution status of particulate matter-associated potential toxic elements and health perspectives in urban environment. Environ. Geochem. Health (2018): 1–32.
- Prussin AJ, Garcia EB, Marr LC. Total concentrations of virus and bacteria in indoor and outdoor air. Environ. Sci. Technol. Lett 2 (2015): 84–88.
- Lai ACK, Poon CKM, Cheung ACT Effectiveness of facemasks to reduce exposure hazards for airborne infections among general populations. J. R. Soc. Interface 9 (2012): 938–948.
- Makison Booth C, Clayton M, Crook B, Gawn JM. Effectiveness of surgical masks against influenza bioaerosols. J. Hosp. Infect 84 (2013): 22–26.
- Rubino I, Choi HJ. Respiratory protection against pandemic and epidemic diseases. Trends Biotechnol 35 (2017): 907–910.
- Sublett JL. Effectiveness of air filters and air cleaners in allergic respiratory diseases: A review of the recent literature. Curr. Allergy Asthma Rep 11 (2011): 395–402.
- Ding Zhezheng, Yi Yayi, Zhang Qingzhu, Zhuang Tao. Theoretical investigation on atmospheric oxidation of fluorene initiated by OH radical. Science of the Total Environment 669 (2019): 920-929.
- Ding Zhezheng, Fang Timing, Zhou Guohui, Tang Xiao, Wang Yan, Liu Xiaomin. Theoretical investigation on interactions between N-methylpyrrolidone FeCl (3) and components in model oil: The role of S-Fe coordination in thiophene removal. Journal of Molecular Liquids 368 (2022): 120719.
- Ding Zhezheng, Tian Shuai, Dang Juan, Zhang Qingzhu. New mechanistic understanding for atmospheric oxidation of isoprene initiated by atomic chlorine. Science of the Total Environment 801 (2021): 149768.
- National plan for the prevention and control of influenza pandemic. Paris: General Secretariat for National Defence (2007).
- Australian health management plan for pandemic influenza: important information for all Australians. Canberra: Department of Health and Ageing, Commonwealth of Australia (2006).
- Department of Health and Human Services. HHS pandemic influenza plan. Washington: The Department (2005).
- MacIntyre CR, Cauchemez S, Dwyer DE, Seale H, Cheung P, Browne G, et al. Face Mask Use and Control of Respiratory Virus Transmission in Households. Emerg Infect Dis 15 (2009): 233–41.
- Brienen NCJ, Timen A, Wallinga J, Van Steenbergen JE, Teunis PFM. The Effect of Mask Use on the Spread of Influenza During a Pandemic. RISK ANAL 30 (2010): 1210–8.
- Van der Sande M, Teunis P, Sabel R. Professional and home-made face masks reduce exposure to respiratory infections among the general population. PLOS ONE 3 (2008): e2618.
- Sana Ullah, Azeem Ullah, Jaeyun Lee, Yeonsu Jeong, Motahira Hashmi, Chunhong Zhu, et al. Reusability Comparison of Melt-Blown vs Nanofiber Face Mask Filters for Use in the Coronavirus Pandemic. ACS Applied nano materials 3 (2020): 7231-7241.
- Wu H, Huang J, et al. Facemask shortage and the novel coronavirus disease (COVID-19) outbreak: Reflections on public health measures. E Clinical Medicine (2020): 100329.
- Hou F, Zhou F, Xu X, Wang D, Xu G, Jiang T, et al. Personnel protection strategy for healthcare workers in Wuhan during the COVID-19 epidemic. Precision Clinical Medicine 3 (2020): 169-174.
- Dijia Wang, Yanjun You, Xiaoli Zhou, Zhiyong Zong, Hao Huang, Hui Zhang, et al. Selection of homemade mask materials for preventing transmission of COVID-19: A laboratory study. PLOS ONE 15 (2020): e0240285.
- LKP Suen, YP Guo, SSK Ho, CH Au-Yeung, SC Lam. Comparing mask fit and usability of traditional and nanofiber N95 filtering facepiece respirators before and after nursing procedures. J Hosp Infect 104 (2020): 336-343.
- ASTM F2101. Evaluating the bacterial filtration efficiency (BFE) of medical face mask materials, using a biological aerosol of staphylococcus aureus (2014).
- BS EN14683. Medical face masks. Requirements and test methods. London: The British Standards Institution (2019).
- YY0469. Medical surgical masks technical requirements (2011).
- May KR. Calibration of a modified Andersen bacterial aerosol sampler. Appl Microbiol 12 (1964): 37.


 Impact Factor: * 6.2
 Acceptance Rate: 76.33%
  Time to first decision: 10.4 days
  Time from article received to acceptance: 2-3 weeks