Evolution of The Main Hospital Activity Indicators in Sikasso Hospital, Mali, 2015-2021
Dadé Ben Sidi Haidara*, 1, Barre K2, Cissouma A3, Traore Ak4, Traore SA5, Toure L6, Coulibaly Mb7, Kante M8, Diallo Ab9, Traore B10, Traore T11, Poma H12, Traore M13
1Epidemiologist, Administration Department, Sikasso Hospital, MD-PhD Epidemiology, Director General, Hôpital de Sikasso, Mali
2Medical Assistant, Administration Department, Health Information System, Sikasso Hospital, Mali
3Pediatrician, Administration Department, Sikasso Hospital, Mali
4Cardiologist, Cardiology Department, Sikasso Hospital, Mali
5Gynecologist, Gynecology Department, Sikasso Hospital, Mali
6Traumatologist, Traumatology Department, Sikasso Hospital, Mali
7Pediatric Surgeon, Surgery Department, Sikasso Hospital, Mali
8Resuscitation Anesthesiologist, Department of Anesthesia and Intensive Care, Sikasso Hospital, Mali
9General Surgeon, Surgery Department, Sikasso Hospital, Mali
10General Surgeon, Operating Room Service, Sikasso Hospital, Mali
11Traumatologist, Traumatology Department, Sikasso Hospital, Mali
12Pediatric Oncologist, Pediatric Department, Sikasso Hospital, Mali
13Infectiologist, Medical Department, Sikasso Hospital, Mali
*Corresponding author: Dadé Ben Sidi Haidara. Epidemiologist, Administration Department, Sikasso Hospital, MD-PhD Epidemiology, Director General, Hôpital de Sikasso, Mali.
Received: 16 February 2023; Accepted: 12 May 2023; Published: 19 May 2023
Article Information
Citation: Dadé Ben Sidi Haidara, Barre K, Cissouma A, Traore Ak, Traore SA, Toure L, Coulibaly Mb, Kante M, Diallo Ab, Traore B, Traore T, Poma H, Traore M. Evolution of The Main Hospital Activity Indicators in Sikasso Hospital, Mali, 2015-2021. Fortune Journal of Health Sciences. 6 (2023): 210-214.
View / Download Pdf Share at FacebookAbstract
Introduction: The right information system makes it possible to describe and evaluate hospital activity and the performance of a hospital establishment. The objective of this work was to describe the trends in Sikasso's hospital activity over the past seven years.
Methods: This was a descriptive study using existing data at Sikasso Hospital. Ports of entry staff handled all admissions between January 1, 2015 and December 31, 2021.
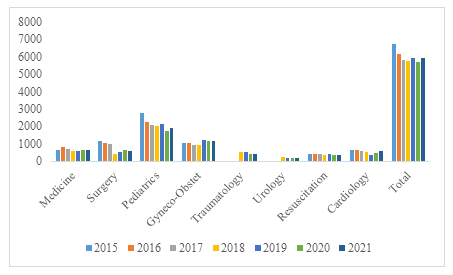
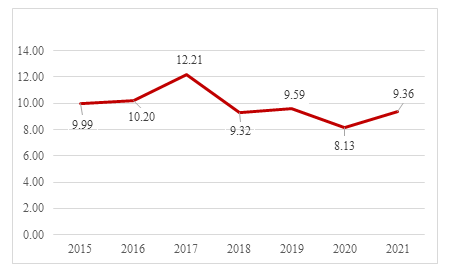
Results: Analysis of the data showed that Sikasso Hospital has 14 wards, eight of which are inpatient and have a capacity of 163 beds. The total number of hospitalizations decreased from 6747 (2015) to 5899 (2021). This evolution varied from one department to another with an increase over the years in hospitalizations from consultation at the expense of those from emergencies, especially at the level of pediatrics and gynecology. The average length of stay increased from three days in 2015 to four days in 2021, while the overall bed occupancy rate varied from year to year and from service to service. It averaged 44.55% with a minimum of 40% in 2020 and a maximum of 49.96% in 2016. During this period, the overall mortality rate was 9.62%, and 9.99% in 2015 to 9.35% in 2021.
Conclusion: The existing information system, with its shortcomings, allowed us to describe the main indicators of activity in our hospital
Keywords
<p>Indicator, Hospital activity, Hospital information system, Sikasso</p>
Article Details
1. Introduction
Mali has had a National Health and Social Information System Master Plan (SD-SNISS) since 1998. The information and indicators produced by SNISS make it possible to measure the performance, process or impact of programs, including the PDDSS and PRODESS [1]. The Health Information Sub-System includes 4 components: the Local Health Information System (SLIS), Hospital Information System (HIS), Epidemiological Alert System (EAS), and Drug and Laboratory Information System. The four components of the health information subsystem allow the collection of epidemiological data, surveillance of communicable and noncommunicable diseases, mortality data, and morbidity data from health centers and hospitals [1].
In 2016, Mali migrated to DHIS2 (District heath information software) with national coverage. With 100% deployment (hospitals, regions, health districts, health facilities, and private structures), DHIS2 integrates all the subsystems of the health information system (SIS) for the management of data on all diseases. Mali was one of the first Sahelian countries to deploy DHIS2 for surveillance and response to COVID-19 in 2020. The country is supported by several partners in strengthening the health information system, such as WHO, USAID, the Global Fund, UNICEF, GAVI, the World Bank and HISP WCA, which allow for the improvement of the performance of the national health information system to provide quality information for decision making and innovative proposals in the management of health data in Mali [2].
For each of these activities, performance indicators play an essential role, as they allow the quantification and measurement of various parameters necessary for decision making, such as resource utilization, productivity, and efficiency [3]. Thus, identifying and monitoring performance indicators through a dashboard is a key element in the implementation and success of any improvement project [4]. It is within this framework that we are interested in the evolution of relevant indicators adapted to certain services in the hospital of Sikasso (medicine, surgery, urology, traumatology, gynecology, cardiology, intensive care and pediatrics).
Our ultimate goal is to describe trends in hospital activity, allowing us to evaluate and monitor its performance on an ongoing basis. It should be noted that there is a particularity in some services in addition to care, the training mission of students. Indeed, in addition to their mission of providing non-programmed medical care to patients, they offer to different profiles of learners complements to their university training, such as internships and course sessions led by the head or doctors of the department. They also constitute research centers not only for the nursing staff and academics who are part of the medical staff but also for external researchers of different specialties. As part of a continuous improvement strategy, it is essential to describe the trend of hospital activity through the identification of appropriate indicators.
2. Methodology
2.1 Study setting: Sikasso Hospital
Sikasso Hospital is a public hospital of the 2nd general vocation created by Law N° 03 - 018/ P-RM of July 14, 2003, which gives it legal personality and financial autonomy in application of Law N°02-050 of July 22, 2002 on the hospital law. Decree 03-340/ P-RM of August 17, 2003, amended by Decree N°2016- 0363/ P-RM of May 31, 2016, sets the organization and operating procedures of Sikasso Hospital. The missions of the Sikasso hospital are to:
- Diagnose and treat sick, injured and pregnant women;
- Take charge of emergencies and referrals;
- To ensure the initial and ongoing training of health professionals;
- Conduct research in the medical field.
The hospital's capacities: In addition to the administration, accounting and social services, the hospital has 14 departments, including General Medicine (infectious diseases) with 163 beds. There are 253 agents, including 34 specialist doctors, 17 generalists, 46 medical assistants, 59 senior health technicians, 38 health technicians, 6 health auxiliaries, and 56 administrative staff.
2.2 Type of study:
This is a cross-sectional, retrospective study with descriptive and evaluative purposes from January 1, 2015, to December 31, 2021.
2.3 Study Population:
The study focused on service indicators according to their specificity.
Inclusion criteria: All departments where hospitalizations and patient care are performed or which were concerned by a selected indicator at Sikasso Hospital were included.
Non-inclusion criteria: services that did not provide hospitalization and care or that were not concerned by an indicator selected at Sikasso Hospital were excluded from this study.
2.4 Sampling
Sampling method: It was non-probabilistic with the exhaustive choice of the services concerned by a selected indicator, the supports concerned by a selected indicator, of the hospital of Sikasso from January 1, 2015, to December 31, 2021.
2.5 Sample size:
In total, the data from the services and supports concerned by the selected indicators were counted.
2.6 Data collection:
The data were collected through document reviews and data extraction from the main data collection and communication tools as well as from the ISSR databases (Monthly and Quarterly Activity Reports).
Thus, we wanted to identify appropriate performance indicators for hospital activity. According to several international standards, such as ISO 8402, the term indicator is defined as "selected information associated with a phenomenon, intended to periodically observe its evolution with respect to periodically defined objectives" [5]. More precisely, an indicator is a tool that measures the performance of a process through the quantification of phenomena related to its operations [6].It is useful to note that the choice of an indicator is quite delicate since a good indicator must be SMART [7]: - Specific/Simple: any indicator must be simple, understandable and specific to a well-defined phenomenon. Simplicity is often synonymous with effectiveness.
- Measurable: any indicator must be quantifiable.
- Ambitious/Accepted: any indicator must be ambitious and reflect the vision of the decision-maker. In addition, an indicator must be accepted to be adopted by all stakeholders.
- Realistic: an indicator that measures the achievement of an unattainable objective is useless.
- Temporal: it is essential to set a time horizon for achieving the objectives. According to the principles of management by objectives, the determination of the objectives to be achieved over a defined period of time must be carried out taking into account the opinions of the various stakeholders [7,8]. We have selected the following indicators:
- Hospitalization in the departments: number of patients admitted to the departments from January 1, 2015, to December 31, 2021, regardless of pathology
- Overall mortality rate: Number of deaths occurring in a department during a given period compared to the total number of patients admitted and hospitalized in the same department X 100
- Bed occupancy rate (BOR): Total number of hospital days in the given period/number of beds X number of days in the period. It reflects the adequacy between supply and demand for care.
- Average length of stay (ALOS): days performed or billed over a given period / number of admissions over the period number of admissions over the same period. Reflects the activity of the facility.
- Number of caesarean sections performed: total number of caesarean sections performed
- Number of deliveries carried out: This is the number of all the phenomena that result in the exit of the fetus and its appendages from the maternal genital tract once the pregnancy has reached the theoretical term of 28 days of pregnancy or the fetal weight is greater than or equal to 1,000 g at Sikasso Hospital.
- Intra-hospital maternal mortality rate related to childbirth: number of parturient women who died in hospital/total number of women who gave birth in hospital.
- Number of dropouts/evasions: The total number of patients who voluntarily left care/leaked
2.7 Collection Process:
Data collection took place from 03/10/2022 to 07/10/2022.
2.8 Data Analysis Plan:
The data collected in DHIS2 for the relevant departments were processed. Rate calculation, graph development, interpretation and use of the data were performed with a Microsoft Excel spreadsheet. Proportions were calculated to describe qualitative variables and means followed by standard deviation for quantitative variables with a symmetric distribution. Quantitative variables with a skewed distribution were presented with their means followed by the minimum and maximum. The bibliographic references are presented in the order of call according to the so-called Vancouver standard.
2.9 Ethical considerations
The confidentiality of the data collected was guaranteed by the hospital's HIS department.
3. Results
3.1 Hospitalization in the services
The number of hospitalizations has decreased from year to year and from one service to another, especially in pediatrics.
3.2 Overall mortality rate:
From 2015 to 2021, the overall mortality rate decreased with a peak increase in approximately 2017.
3.3 Bed Occupancy Rate (BOR):
The overall bed occupancy rate was variable from year to year and department to department. It averaged 44.55%, with a low of 40% in 2020 and a high of 49.96% in 2016.
3.4 Average length of stay (ALOS): The average length of stay increased from three days in 2015 to four days in 2021.
3.5 Number of deliveries and cesarean sections performed:
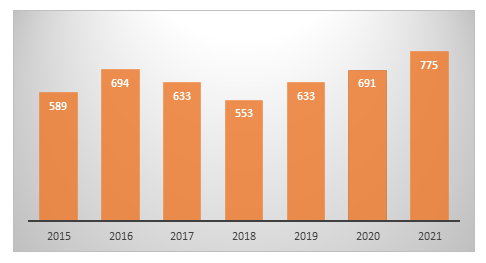
We see an upward trend in the number of C-sections performed year over year.
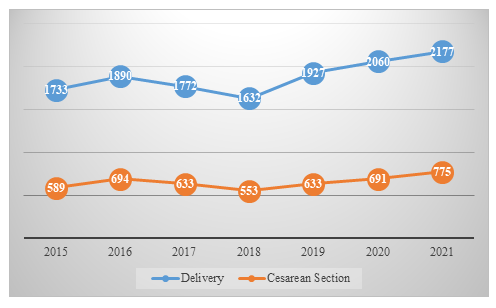
The number of deliveries increased yearly from 1733 in 2015 to 2177 cases in 2015, with a slight decrease towards 2018.
- Comparative trend of delivery and cesarean section trends from 2015 to 2021
The number of caesarean sections performed evolves in parallel with the number of deliveries between 2015 and 2021.
- Evolution of referrals received at the hospital from 2015 to 2021
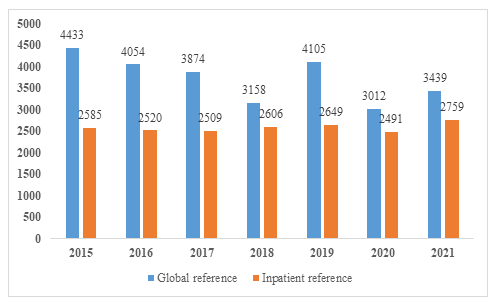
The overall referrals were very high in 2015 compared to other years. Of these overall referrals, 2021 had more hospitalizations, with 2759.
3.6 Number of dropouts/evasions
The number of dropouts/evasions decreased gradually during the period of our study, with an average of 507 dropout cases, a maximum of 671 cases in 2015 and a minimum of 412 cases in 2021.
4. Discussion
Validity of the data
There was no possibility of distortion of the information because the data were available in the software at the HIS level.
Limitations of the study
Often, a decrease in certain indicators was noted. One of the possible explanations is the observed weakness of the completeness of the source documents in addition to the existence of several consultation stations (several registers), a failure to archive the primary registers and the non-respect of the directives for correct registration of cases, not to mention the data entry errors. It should be noted that there is no data management procedures manual for the hospitals. With respect to the completeness of reporting, there were also shortcomings in the accuracy levels of the various indicators in one way or another.
Data Use
At the hospital level, the finding was that most of the data use revolves around performance discussions and decision-making, leaving data quality decisions to one side. The number of hospitalizations has decreased from year to year and from department to department, especially in pediatrics. It decreased from 6747 (2015) to 5899 (2021). On average, there were 5990 hospitalizations with a minimum of 5670 and a maximum of 6747 during our study period. C. Harizi et al [9] reported an increase in hospitalizations during their study. This difference could be explained by a high number of hospitalization services and specialists at their hospital. The overall mortality rate decreased with a peak increase in 2017 (Figure 2). an average of 9.83% during the period of our study. It is higher than that found by Harizi et al. [9]. The overall bed occupancy rate varied from year to year and from department to department. It averaged 44.55%, with a minimum of 40% in 2020 and a maximum of 49.96% in 2016. It is lower than the results reported by Harizi et al. [9].
The average length of stay increased from three days in 2015 to four days in 2021, which are well below those found by some others [9]. These differences can be explained by a higher attendance than ours but also by the availability of specialists for certain chronic pathologies, such as cancer, diabetes, and cardiovascular diseases. The cesarean section rate varied from 32.85% in 2019 to 36.72% in 2016, higher than that reported by C. T Cissé and others[11]. This could be explained by the mission of the Sikasso Hospital, which received all obstetrical referrals at the regional level. The number of referrals received is gradually increasing from year to year, especially hospitalizations. This could be explained by the facility's position as a second level of referral for the entire region. The number of patients who had abandoned care and/or escaped decreased progressively each year, with an average of 507 cases. This is a real problem at the facility level. This was described in a study conducted by DBS Haidara et al.[12], who reported a 40% dropout rate in the Medicine and Pediatrics departments of Sikasso Hospital. This decrease could be explained by the efforts of the authorities of the structure to solve this problem, especially with the sensitization of the accompanying persons and the patients.
5. Conclusion
The hospital information system, with its shortcomings, has enabled us to describe the main indicators of hospital activity. The accessibility of the results by the public constitutes important steps towards more transparency in the field of hospital care and the improvement of the quality of care.
Conflict of Interest
The authors declare that they have no conflicts of interest.
References
- PRISM (Performance Routin Information System Management) assessment report of Mali's hospital information system, October (2018).
- https://dhis2.org/fr/mali-covid-vaccination/
- Pace A, & Buttigieg SC. Can hospital dashboards provide visibility of information from bedside to board? A case study approach. Journal of health organization and management 31 (2017) : 142- 161.
- Buttigieg SC, Pace A & Rathert C. Hospital performance dashboards: a literature review. Journal of health organization and management 31 (2017): 385-406.
- ISO 8402. Quality management and quality assurance-Vocabulary. International Standard Organisation (1995).
- ISO 9001:2000. Quality management system: requirements. International standard organization (2000).
- Doran GT. There's a SMART way to write management's goals and objectives. Management review 70 (1981): 35-36.
- Selmer C. Designing the dashboard: Tools for control, steering and decision support. 3rd edition. Dunod (2011).
- Harizi, F. Saffar, A. Hchaichi, B. Kooli, et al. Evolution of the main indicators of hospital activity in the hospital A. Mami, Tunisia (2006-2015).
- EchoGeo Public hospital care services in the agglomeration of Sfax: functional specificities and spatial power, Mounir Jarraya and Gérard Beltrando OpenEdition Journals, Electronic Edition URL: https://journals.openedition.org/echogeo/13632.
- C T Cissé, P M Ngom, A Guissé, E O Faye, J C Moreau. Réflexions sur l'évolution des taux de caesarienne en milieu africain : exemple du CHU de Dakar entre 1992 et 2001, Gynécologie Obstétrique & Fertilité 32 (2004): 210-217.
- DBS Haïdara, A Cissouma, T Traoré, M Traoré, ML Mariko, L Touré et al. Abandonment of care at Sikasso Hospital in 2021: case of the Pediatrics and Medicine departments. Jaccr Africa 6 (2022): 312-317.


 Impact Factor: * 6.2
 Acceptance Rate: 76.33%
  Time to first decision: 10.4 days
  Time from article received to acceptance: 2-3 weeks