Rapid, Sensitive and High-Throughput Screening Method for Detection of SARS-Cov-2 Antibodies by Bio-Layer Interferometry
Sudarshan Reddy Lokireddy1*, Sridhar Rao Kunchala1, Ranga Pratyusha Godavarthy1, Venkata Sri Krishna Kona1, Laxmaiah Avula2, Rakesh Kumar Mishra3, Madhusudhana Rao Nalam3*
1Oncosmis Biotech Private Limited, CCMB Annexe II, CRTDH, Opp Genpact, Uppal Road, Hyderabad, Telangana, India
2ICMR-National Institute of Nutrition, Beside Tarnaka Metro Station, Jamai-Osmania PO, Hyderabad, Telangana, India
3CSIR-Centre for Cellular and Molecular Biology, Habsiguda, Uppal Road, Hyderabad, Telangana, India
*Corresponding Authors: Sudarshan Reddy Lokireddy, Oncosmis Biotech Private Limited, CCMB Annexe II, CRTDH, Opp Genpact, Uppal Road, Hyderabad-500007, TS, India.
Madhusudhana Rao Nalam, CSIR-Centre for Cellular and Molecular Biology, Habsiguda, Uppal Road, Hyderabad - 500007, TS, India.
Received: 10 October 2021; Accepted: 08 November 2021; Published: 01 December 2021
Article Information
Citation:
Lokireddy SR, Kunchala SR, Godavarthy RP, Kona VSK, Avula L, Mishra RK, Nalam MR. Rapid, sensitive and high-throughput screening method for detection of SARS-CoV-2 antibodies by bio-layer interferometry. A Case Report. Archives of Clinical and Medical Case Reports 5 (2021): 878-893.
View / Download Pdf Share at FacebookAbstract
In the present pandemic scenario, there exists an unmet global need for the development of a rapid and sensitive method for the detection and sero-surveillance of SARSCoV- 2 infection. The currently available options for identification of SARS-CoV-2 infection include detection of viral RNA by RT-PCR, antigen testing by Lateral Flow Assay (LFA) or antibody detection by Enzyme Linked Immunosorbent Assay (ELISA), LFA, chemiluminescence immunosorbent assay and immunofluorescence assay. Though many kits are available commercially to detect antibodies against SARS-CoV-2, none of them are simple, sensitive and high throughput. To overcome these limitations, we have developed a diagnostic method, the Bio- Layer Interferometry Total Antibody Assay (BLI-TAA) that uses the principle of BLI-TAA using "dip-and-read" format to detect antibodies (IgM/IgA/IgG) against SARS-CoV-2 virus during and after the infection. The BLI-TAA method provides real-time optical measurements of antigen loading, plasma antibody binding. This BLI-TAA based approach uses two recombinant proteins that include SARS-CoV-2 Spike S1 subunit and Nucleocapsid proteins to capture anti- SARS-CoV-2 antibodies (IgM/IgA/IgG) in serum or plasma or blood during and after SARS-CoV-2 infection. BLI-TAA shows very high sensitivity and specificity for detection of antibodies against SARS-CoV-2 virus compared to the existing standard ELISA. In addition to detecting of antibodies against SARS-CoV-2 virus, it can also be used for rapid screening of antibodies for vaccine development, clinical management of the disease, in the screening of antiviral therapy, evaluation of the convalescent plasma for COVID-19 antibody titers and sero-surveillance in epidemiological studies.
Keywords
<p>SARS-CoV-2; RT-PCR; ELISA; COVID-19</p>
Article Details
1. Introduction
The current human and economic devastation by SARS-CoV-2 pandemic has triggered a race for development of new and effective diagnostic methods, using all possible avenues [1]. To date, Reverse Transcriptase Polymerase Chain Reaction (RT-PCR) is one of the standard diagnosis methods to detect the presence of SARS-CoV-2 viral RNA in biological samples. Detection of SARS-CoV-2 viral RNA by RT-PCR usually takes only 4-6 hours. However, this test involves collection and transportation of viral specimen in a defined medium, isolation of RNA, specialized equipment and trained personnel to run the tests. The whole process takes approximately 24 to 48 hours. Another diagnostic method is the antigen testing approach, wherein the presence of viral antigens in the biological samples such as nasal swabs, saliva, etc. are tested in a qualitative manner [1-6]. However, high titers of viral antigens are required for detection by this method. The chances of false negatives necessitate further confirmation by RT-PCR testing.
Another diagnostic approach would be to devise tests for the presence of antibodies against the SARS-CoV-2 virus in blood [1,3-5,7]. Systemic immune response to infection results in the production of antibodies including IgM, IgA and IgG antibodies [6,8,9]. ELISA tests can be used to detect specific IgM, IgA and IgG against the virus in the blood of infected patients [5,8,10,11]. However, the quantity of circulating antibodies detectable by these assays will typically require 4-6 days for IgM antibodies, >6 days for IgA antibodies and 5-10 days for IgG post infection [1,10,12]. However, the major limitation in the serological assays for SARS-CoV-2 is that a few infected people develop more antibodies towards viral spike glycoprotein, whereas others develop more antibodies towards nucleocapsid proteins [1,10,13]. Most of the available antibody detection methods rely on the spike protein, hence leaving a void in identification of people who have antibodies against nucleocapsid protein [1,10,12]. Nevertheless, advanced serological testing remains one of the best methods to identify people who were recently infected, even if they are asymptomatic.
Taking into account the limitations of the existing diagnosis methods, we have developed a rapid antibody detection method based on Bio-Layer Interferometry Total Antibody Assay (BLI-TAA). BLI-TAA is a label-free optical analytical technology for measuring biomolecular interactions by analyzing the interference pattern of white light reflected from two surfaces [13-16]. The binding between a ligand immobilized on the biosensor and an analyte in solution produces an increase in optical thickness at the biosensor tip, which results in absorption properties with a wavelength shift, which is a direct measure of the change in thickness of the biological layer [13-16]. In the present assay, we immobilize virus-specific ligands on the sensor and use the patient plasma containing the antibodies as an analyte. This testing method takes less than a minute to detect the presence of SARS-CoV-2 antibodies during and after infection.
2. Material and Methods
2.1 Plasma or blood collections
All blood samples were collected by qualified health professionals and by abiding to human ethical approvals provided by the Centre for Cellular and Molecular Biology (CCMB), and the ICMR-National Institute of Nutrition (NIN), Hyderabad, TS, India. Blood from COVID-19 patients (RT-PCR positive) and healthy volunteers (RT-PCR Negative) or community samples which had never been tested before was collected in K3-EDTA vacutainers according to the manufacturer’s protocol or by Finger prick using lancets in K3-EDTA-containing micro centrifuge tubes. Plasma was separated by centrifugation at 3000Xg for 10 minutes. Clear plasma was collected and stored at -80oC until further process.
2.2 Chemicals and reagents
PEI max was obtained from Polysciences, USA; 10X PBS and Ni-NTA from Bio-Rad, USA; His2 Biosensors were procured from Fortebio, USA; Black plates 96 well plates from Greiner Bio-One, USA; Chemically defined FreeStyle-293 expression media was obtained from FreeStyle-CHO-S media, Glutamax, PenStrep, from Thermo Fisher Scientific, USA and Single used conical flask from Corning, USA. Anti-clumping agent was obtained from Irvin Scientific, USA; SARS-CoV-2 Spike S1-RBD IgG & IgM ELISA Detection Kit from Genscript, China; and the COVID KAWACH ELISA kit from Zydus-Cadila, India.
2.3 Cell lines and culture
FreeStyle-293 and FreeStyle-CHO-S mammalian cells from Thermo Fisher Scientific, USA were used for expression of Spike S1 subunit cloned into pcDNA3.1(+) vector. FreeStyle-293 cells and FreeStyle-CHO-S were maintained in chemically defined FreeStyle-293 expression media and FreeStyle-CHO-S media respectively.
2.4 Transfection and affinity purification
For transfecting FreeStyle 293/CHO-S cells, cell were grown in suspension at a density of 1X10⁶ cell/ml in growth medium and on the day of transfection, DNA: Polyethyleneimine (PEI) max (1:3 ratio) polyplexes were prepared and diluted in OptiMEM media (Invitrogen, USA) with careful mixing by pipetting (15 times) followed by incubation for 10 minutes at room temperature. Secreted recombinant S1 subunit protein was purified from filtered cell supernatant by passing through Ni-NTA resin in phosphate buffered solution (PBS) pH 7.5, 10 mM Imidazole as binding buffer and PBS pH 7.5, 300 mM Imidazole as elution buffer.
2.5 Immobilization of S1 Subunit and Nucleocapsid Proteins on Anti-His Biosensor
The bio-layer interferometry biosensor used for this purpose has anti-His antibodies (His2 sensors) on its tip. His-tag of protein was used for binding to the biosensors’ tip by antibody- antigen affinity. C-terminal His tag-containing proteins were immobilized on the biosensor using inline protocol according to the manufacturer’s instructions and then washed with PBS buffer. After removal of the excess unbound or loosely bound proteins from the biosensor, the biosensor is ready to use for analysis of detection and quantification of antibodies against SARS-Cov-2 in a biological plasma or blood sample.
2.6 Procedure for total antibodies detection against SARS-CoV-2 in plasma using BLI method (OctetRed96)
For all BLI-based analysis we have used the OctetRed 96 8 Channel machine. In the first step, biosensors are hydrated in PBS. In the second step, the hydrated biosensor is dipped into a solution with His-tagged SARS-CoV-2 Spike S1 subunit and Nucleocapsid protein (Antigen) for their immobilization on the tip of the biosensor. In the third step, the biosensor is washed in PBS to remove excess unbound protein or loosely bounded antigen. In the fourth step, the ligand- bound biosensor is dipped into plasma or blood samples. Data of interference pattern (bio-layer interferometry sensorograms) of white light by biosensor in real-time during steps 1,2,3 and 4 was acquired, and the data was analyzed using the data analysis software using Linear Point- point and R equilibrium. The real-time data of interference pattern for all the steps of the method (steps 1-4) was performed in 180-400 seconds.
2.7 Recombinant SARS-CoV-2 S1 subunit protein (full length, 16-681 amino acids) with C- terminal His-tag
Spike S1 subunit contains a Receptor-Binding Domain (RBD) that can specifically bind to Angiotensin-Converting Enzyme 2 (ACE2), the receptor on target cells. Spike protein plays an important role in the induction of neutralizing-antibodies and T-cell responses, as well as protective immunity. We have cloned S1 subunit (QHD43416, Val16-Pro681) expressing clone with C-terminal His-tag in pCDNA3.1 plasmid. Secreted recombinant S1 subunit protein was purified from filtered cell supernatant by passing through Ni-NTA resin in phosphate buffered solution (PBS) pH 7.5, 10 mM Imidazole as binding buffer and PBS pH 7.5, containing 300 mM Imidazole as elution buffer. Recombinant protein product has a calculated molecular mass of ∼75 kDa. due to the abundant glycosylation, it migrates as approximately ∼120 kDa major protein band in SDS-PAGE under DTT, β-mercaptoethanol reducing conditions.
2.8 Recombinant SARS-CoV-2 nucleocapsid protein with C-terminal His-tag
We have cloned Nucleocapsid protein (Ser2-Ala418) in pET28a(+) with C-terminal His-tag. Recombinant protein has a calculated molecular mass of ∼46 kDa. Nucleocapsid protein was purified from bacterial lysate by passing through Ni-NTA resin in phosphate buffered solution (PBS) pH 7.5, 10 mM Imidazole as binding buffer and PBS pH 7.5, 300 mM Imidazole as elution buffer.
2.9 ELISA
All ELISA experiments have been performed according to the manufacturer’s protocol provided with the kit. The Genscript ELISA kit uses the RBD domain as antigen, whereas the COVID KAVACH ELISA kit uses gamma-irradiated whole SARS-CoV-2 virus as antigen (23).
2.10 Statistical analysis
Statistical Analysis was performed using Student’s t tests, One-way ANOVA post hoc Bonferroni’s comparison, Receiver Operating Characteristic (ROC) curve analysis for sensitivity and specificity of tests and Pearson performed for Correlation studies. All values are expressed as means ± SD and p value >0.01 is considered as significant.
3. Results and Discussion
3.1 Bio-layer interferometry total antibody assay (bli-taa) for detection of total antibodies (igm/iga/igg) against sars-cov-2 infection
Total detection of antibodies against SARS-CoV-2 virus in blood/plasma using the BLI dip-and-read method includes four steps. In the first step, biosensors get hydrated in buffer, followed by antigen capture and washing in the second and third steps respectively (Figure-1A and S1A). In the fourth step, the antigen-coated biosensor is dipped into plasma antibodies (Figure-1A and Figure-S1A). During all these four steps, data is acquired in the form of bio-layer interferometry sensogram in advanced quantification mode (Figure-1A and Figure-S1A). To establish this method, experiments have been performed using Spike S1 subunit of SARS-CoV-2 as antigen [12] purified from FS-293 cells against SARS-CoV-2 positive (+ve) and negative (-ve) plasma samples (Figure-1B and Figure-S1A-B). The plasma sample positive for SARS-CoV-2 infection, but not the plasma sample negative for SARS-CoV-2 infection, shows a sharp raised sensogram (Figure-1A). However, when positive plasma for SARS-CoV-2 is incubated with biosensors in No Antigen Control (NAC) there was no increase in the sensogram, indicating that the raise in sensogram with plasma from SARS-CoV-2 patient when the antigen is present is indeed positive for presence of antibodies against SARS-CoV-2 (Figure-1A).
Next, to increase the sensitivity of detection of antibodies against SARS-CoV-2, we have tested another abundant and highly immunogenic protein- the Nucleocapsid phosphoprotein [1,10]. Affinity purified His-tag Nucleocapsid protein expressed in E. coli was used as antigen to coat the biosensors (Figure-S2C). Surprisingly, we have found that there were significantly higher antibodies (IgM/A/G) against the Nucleocapsid proteins compared to Spike S1 subunit in tested SARS-CoV-2 positive plasma sample (Figure-1B). Moreover, when an equimolar ratio of Spike S1 and Nucleocapsid proteins were used to coat biosensor, we noticed significant increase in binding rate of antibodies in SARS-CoV-2 positive plasma compared to their standalone use (Figure-1B). These observations indicate that the both antigens S1 subunit and Nucleocapsid proteins could be potentially useful for detecting antibodies against SARS-CoV-2 infection.
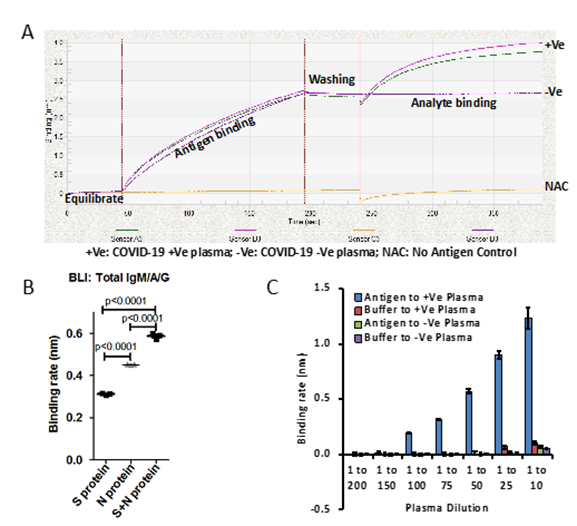
Figure 1: A) Binding curve represents plasma samples collected from patients which are diagnosed for SARS-CoV-2 by RT-PCR, Positive (+Ve) and negative (-Ve). No antigen control (NAC) have been used as internal control and background correction. Plasma samples were diluted 1 to 10. B) Graph represents binding rate (nm) for said protein (Spike S1 subunit or Nucleocapsid) or together against SARS-CoV-2 positive plasma samples. 1:1 molar ratio of Spike S1 and Nucleocapsid proteins has been used. Binding rate has been calculated based on Linear Point to Point and R equilibrium binding rate equation using Data Analysis Software provided by ForteBio. C) Bar graph represents the binding rate of various dilutions of plasma from SARS-CoV-2 positive patients and healthy volunteers in the presence and absence of antigens, (Spike S1 subunit and Nucleocapsid). Error bar represents SD.
p<0.0001 Furthermore, we also tested various dilutions of plasma on both antigens, Spike S1 and Nucleocapsid to find sensitivity range of BLI-TAA. Two independent SARS-CoV-2 positive plasma samples with similar binding rates were diluted up to 200 times with buffer and the binding rates were then determined. BLI-TAA method could detect total antibodies up to a 100th dilution of plasma with binding rates close to 0.20nm (Figure 1C). When concentrated plasma (1 to 10th dilution) was used, we observed non-specific binding to biosensors at a binding rate of ~0.07-0.12nm in both negative and positive plasma samples. Based on these results, for all subsequent experiments we have used 1 to 20 dilution of plasma to prevent non-specific interactions and to detect low level of antibodies in plasma. So, for all future experiments, we had considered a baseline of binding rate ≥0.10nm as positive and <0.099nm as negative.
3.2 BLI-TAA is more sensitive and specific compared to ELISA
We collected 40 plasma samples collected in month of November 2019 before the SARS-CoV-2 pandemic, and positive samples (3 samples) from SARS-CoV-2 patients confirmed by RT-PCR and performed the BTI-TAA to test the specificity of the method. None of the 40 samples collected before COVID-19 pandemic showed any binding against the antigen; however, plasma samples collected from SARS-CoV-2 infected patients showed significant binding rate against the antigens (Figure-S2A). Receiver Operating Characteristic (ROC) curve analysis in BLI-TAA shows 100% sensitivity and specificity (Figure-2A). Our data clearly indicates that the antigen used in BLI-TAA indeed recognizes the antibodies against the SARS-CoV-2 infection, but not the others.
Next, we compared the BLI-TAA with the commercially available ELISA kit, the SARS-CoV-2 Spike S1-RBD IgG & IgM ELISA Detection Kit from Genscript. A total of 17 RT-PCR negative and 31 RT-PCR positive plasma samples were tested to detect antibodies. BLI-TAA could detect IgM/A/G antibodies against SARS-CoV-2 in all the 31 RT-PCR positive plasma samples, but in none of the 17 plasma samples which were confirmed to be RT-PCR negative (Figure-S2B). On the other hand, of the 31 samples confirmed to be RT-PCR positive for SARS-CoV-2 infection, the ELISA kit could detect anti-IgM antibodies in only 24 plasma samples and anti-IgG antibodies in 29 of the 31 RT-PCR positive samples (Figure-S2C and S2D). Moreover, the ELISA kit was positive for anti-IgM antibodies in one and positive for anti-IgG antibodies in 4 plasma samples that were RT-PCR negative (Figure-S2C and S2D). Furthermore, the Receiver Operating Characteristic (ROC) curve analysis on this data showed 100% specificity and sensitivity with BLI-TAA (Figure-2B). ELISA kit shows ROC curve area 0.9023 for total IgG (confidence interval in between 0.8100 to 0.9945) and 0.9070 for total IgM (confidence interval 0.8243 to 0.9898) (Figure 2B and Figure S2C).
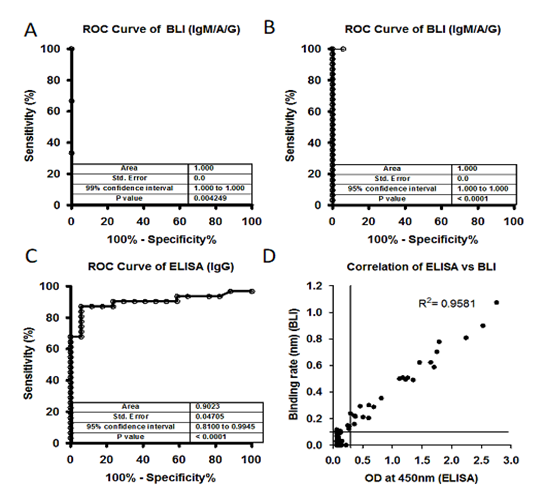
Figure 2: A) Receiver Operating Characteristic (ROC) curve of plasma samples (40) collected before COVID-19 pandemic (Nov 2019) and after COVID-19 pandemic (3) against S1 subunit and Nucleocapsid antigen. ROC area under the curve: 1.000, 95% confidence interval in between 1.000 to 1.000 and p values 0.004249. B) and C) A total of 17 controls (-Ve) and 31 SARS-CoV-2 positive (+Ve) plasma samples were tested using BLI-TAA and ELISA kit. BLI-TAA of ROC area shows 1.000, ELISA for IgG shows 0.9023 and for BLI-TAA 95% confidence interval in between 0.8100 to 0.9945 and ELISA for IgG 0.8100 to 0.9945. All three analysis shows p<0.0001. D) A total of 486 samples which were never tested before for SARS-CoV-2 were analyzed by BLI total Ab assay and ELISA kit (COVID KAVACH). Both COVID KAVACH ELISA and BLI-TAA have shown a correlation at R2=0.9581, Pearson r=0.9788 and p<0.0001. Line indicate cut off point.
Next, BLI-TAA was also compared with the COVID KAWACH ELISA [17] in a large set plasma samples (486) collected from the community where individuals were not diagnosed for COVID-19 infection neither by RT-PCR or ELISA. In COVID KAWACH ELISA, the kit uses gamma irradiated whole viral particle as antigen to detect anti-IgG antibodies against SARS-CoV-2 virus [17]. Results show that the COVID KAWACH ELISA kit was able to detect anti-IgG antibodies in 30 samples, whereas BLI-TAA detected antibodies in 32 samples against SARS-CoV-2 virus (Figure-S2E and S2F). Furthermore, there was more than 95% correlation in between COVID KAWACH ELISA kit and BLI-TAA (Figure-2D). Importantly, 4 plasma samples that were shown to be positive by BLI-TAA were not identified by the COVID KAWACH ELISA kit. This difference in detection of 4 additional plasma samples by BLI-TAA could be due to the fact that the COVID KAWACH ELISA kit detects only anti-IgG and not anti-IgM antibodies against SARS-CoV-2. Moreover, 2 plasma samples shown negative by BLI-TAA were identified as positive by the COVID KAWACH ELISA kit (Figure-3E). Since the COVID KAWACH ELISA kit detects antibodies raised against the gamma-irradiated whole virus particle, it is likely that the COVID KAWACH ELISA kit detected anti-IgG antibodies raised against proteins other than the S1 subunit of the spike protein and the nucleocapsid protein in the two plasma samples which were not detected by BLI-TAA that is specific for these proteins. Nonetheless, the BLI-TAA method shows greater sensitivity and specificity in detection of total IgM, IgA and IgG antibodies against SARS-CoV-2 during and after the infection.
3.3 BLI-TAA potentially useful for community surveillance
Using BLI-TAA, we performed high-throughput screening of a total of 1487 plasma samples collected from different communities in the Hyderabad region, Telangana State, and 123 plasma samples from SARS-CoV-2 infected patients confirmed to be positive by RT-PCR (Figure-S3). Out of the 1487 samples that had not been diagnosed for COVID-19, only 81 samples showed significant levels of antibodies against SARS-COV-2 virus (Figure-S4A and S4B). Moreover, 4 samples diagnosed by RT-PCR as positive for SARS-CoV-2 infection were found to be negative for antibodies (Figure- S4B) by the BLI-TAA method. The inability of BLI-TAA to detect antibodies in four plasma samples found to be positive for RT-PCR could probably be due to early detection of viral infection by RT-PCR. It is also possible that in these plasma samples, antibodies had been raised for antigens other than the S1 subunit of the spike protein and Nucleocapsid protein and hence were not detected by BLI-TAA. Moreover, ROC curve analysis of this data for BLI-TAA shows area of 0.9818, at 95% confidence interval in between 0.9663 to 0.9973 and p <0.0001 (Figure-3B). Thus, analysis of a large set of samples clearly demonstrated that ‘BLI-TAA’ is quite sensitive and specific to detection antibodies against SARS-CoV-2 virus during and after infection.
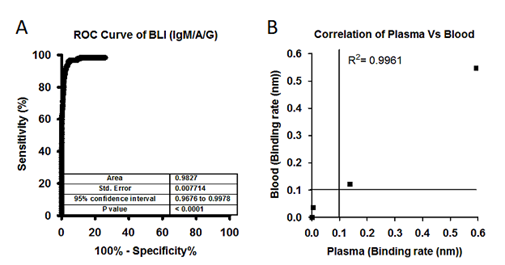
Figure 3: A) Large set of analysis has been performed to identify the individuals who has been exposed to SARS-CoV-2 virus. A total of 1487 plasma samples collected from a community who were never diagnosed for SARS-CoV-2 infection and 123 samples collected from SARS-CoV-2 patients. ROC area under the curve: 0.9818, 95% confidence interval in between 0.9663 to 0.9973. B) Correlation graph showing binding rate of both whole blood and plasma samples collected from SARS-CoV-2 patients and healthy controls. Both Blood and Plasma shows a correlation at R2=0.9961, Person r=0.9980 and p<0.0001. Line indicate cut off point.
Next, to reduce the sample preparation time, we tested whole blood samples and their respective plasma samples using BLI-TAA. Total 20µl of whole blood (diluted 10-fold) and 10µl of plasma (diluted 20-fold) for comparison studies. Bio-layered interferometry sensogram shows perfect correlation in detection of IgM/IgA/IgG antibodies against SARS-CoV2 virus both in whole blood and plasma samples (Figure-S1A-S1C and Figure-3B). Moreover, the correlation analysis shows R2 = 0.9961 and Pearson r =9980 and p=0.0001 between data on blood and corresponding plasma samples. Overall, the data presented convincingly demonstrates that BLI-TAA can be potentially useful to detect antibodies against SARS-CoV-2 in whole blood.
4. Conclusion
BLI-TAA exhibits very high sensitivity and specificity for detection of COVID-19 compared to the existing technologies like ELISA. BLI-TAA uses two recombinant proteins to capture anti-SARS-CoV-2 IgM/IgA/IgG in serum/plasma/blood during and after the infection. This approach can be used in community studies, vaccine development or in plasma therapy. The assay is rapid and quantitative against standards for detection of total antibodies with real-time data monitoring. Results can be obtained in less than half minute in 96 well format and 2 seconds per sample in 384 well format. Based on presented data it is concluded that BLI-based method has high potential for detecting infectious diseases including COVID-19.
Acknowledgements
Authors are grateful for the support from volunteers who donated blood samples to present study. We thank Ramakrishna MT, Rajesh N for proofreading the manuscript, Subhir B, Susheelendra V and Ishan S from ForteBio, India, for their assistance in setting up protocols on OctetRed96e. Oncosimis Biotech is also grateful to DBT, BIRAC for providing funding for AcceTT® platform.
Authors Contribution
SRL, SRK, and MRN conceived the study. SRL, SRK, RPG, and VSKK expressed and purified Spike S1 in FreeStyle293 cells and Nucleocapsid in E.coli. MRN and RKM supervised the blood collection and relevant ethical approvals. LA collected community samples and performed COVID KAWACH ELISA. SRL, SRK, and MRN analyzed the data. SRL and MRN prepared the figures. SRL, SRK and MRN wrote the manuscript. All authors edited the manuscript and approved.
Conflict of Interest
All authors declare no conflict of interest. OnCovid, AcceTT are trademarks of Oncosimis Biotech. Patent has been filed based on presented data. SRL, SRK, RPG, and VSKK employees of Oncosimis Biotech.
References
- Geurtsvan Kessel CH, Okba NMA, Igloi Z, et al. Nat Commun 11 (2020): 3436.
- Brochot E, Demey B, Handala L, et al. Comparison of different serological assays for SARS-CoV-2 in real life. J Clin Virol 130 (2020): 104569.
- den Hartog G, Schepp RM, Kuijer M, et al. SARS-CoV-2-specific antibody detection for sero-epidemiology: a multiplex analysis approach accounting for accurate seroprevalence. J Infect Dis (2020).
- Ji T, Liu Z, Wang G, et al. Detection of COVID-19: A review of the current literature and future perspectives Biosens Bioelectron 166 (2020): 112455.
- Lin D, Liu L, Zhang M, et al. Evaluations of the serological test in the diagnosis of 2019 novel coronavirus (SARS-CoV-2) infections during the COVID-19 outbreak. Eur J Clin Microbiol Infect Dis 39 (2020): 2271-2277.
- Nicol T, Lefeuvre C, Serri O, et al. Assessment of SARS-CoV-2 serological tests for the diagnosis of COVID-19 through the evaluation of three immunoassays: Two automated immunoassays (Euroimmun and Abbott) and one rapid lateral flow immunoassay (NG Biotech). J Clin Virol 129 (2020): 104511.
- Meschi S, Colavita F, Bordi L, et al. Performance evaluation of Abbott ARCHITECT SARS-CoV-2 IgG immunoassay in comparison with indirect immunofluorescence and virus microneutralization test. J Clin Virol 129 (2020): 104539.
- Amanat F, Stadlbauer D, Strohmeier S, et al. A serological assay to detect SARS-CoV-2 seroconversion in humans Nat Med 26 (2020): 1033-1036.
- Wu JL, Tseng WP, Lin CH, et al. Four point-of-care lateral flow immunoassays for diagnosis of COVID-19 and for assessing dynamics of antibody responses to SARS-CoV-2. J Infect 81 (2020): 435-442.
- Long QX, Liu BZ, Deng HJ, et al. Antibody responses to SARS-CoV-2 in patients with COVID-19. Nat Med 26 (2020): 845-848.
- Wrapp D, Wang N, Corbett KS, et al. Cryo-EM structure of the 2019-nCoV spike in the prefusion conformation. Science 367 (2020): 1260-1263.
- Okba NMA, Muller MA, Li W, et al. Severe Acute Respiratory Syndrome Coronavirus 2-Specific Antibody Responses in Coronavirus Disease Patients. Emerg Infect Dis 26 (2020): 1478-1488.
- Abdiche Y, Malashock D, Pinkerton A, et al. Determining kinetics and affinities of protein interactions using a parallel real-time label-free biosensor, the Octet. Anal Biochem 377 (2008): 209-217.
- Concepcion J, Witte K, Wartchow C, et al. Label-free detection of biomolecular interactions using BioLayer interferometry for kinetic characterization. Comb Chem High Throughput Screen 12(2009): 791-800.
- Petersen RL. Biosensors (Basel) 7(2017).
- Wallner J, Lhota G, Jeschek D, et al. Application of Bio-Layer Interferometry for the analysis of protein/liposome interactions. J Pharm Biomed Anal 72 (2013): 150-154.
- Sapkal G, Shete-Aich A, Jain R, et al. Development of indigenous IgG ELISA for the detection of anti-SARS-CoV-2 IgG. Indian J Med Res 151 (2020): 444-449.
- Johnson M, Wagstaffe HR, Gilmour KC, et al. Evaluation of a novel multiplexed assay for determining IgG levels and functional activity to SARS-CoV-2. J Clin Virol 130 (2020): 104572.
Supplementary Figures
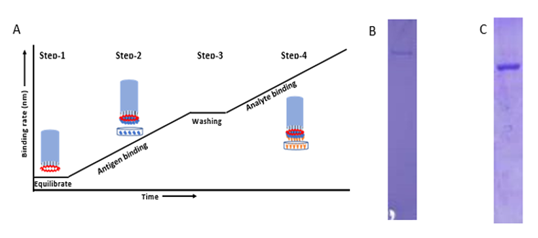
Figure S1: A) Graph represents typical pattern to detect total antibodies against SARS-CoV-2 virus in plasma. In the first step, biosensor is hydrated in 1X PBS. In the second step, after hydration the biosensor is dipped into His-tagged SARS-CoV-2 Spike and Nucleocapsid protein (Antigen) for immobilizing on the tip of the biosensor. In the third step, after antigen binding, the biosensor is washed in 1X PBS to remove excess unbound protein or loosely bounded antigen. In the fourth step, after washing of ligand bound biosensor is dipped into plasma or blood samples. Data of interference pattern (bio-layer interferometry sensorograms) of white light by biosensor in real- time is acquired during steps 1, 2, 3 and 4. B) &C) A total of 5 ug was loaded after affinity purification of S1 protein (A) and N protein (B) using Ni-NTA resin from FreeStyle 293 cells supernatant and Bacterial lysate in 8% and 12% SDS-PAGE gel respectively.
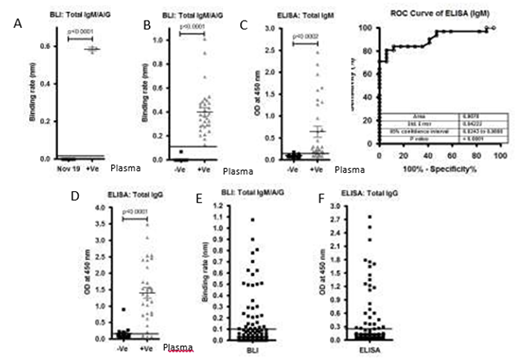
Figure S2: A)Graph represents the binding rate (Left graph) of plasma samples (40) collected before COVID-19 pandemic (Nov 2019) and after COVID-19 pandemic (3) against S1 subunit and Nucleocapsid antigen.B), C) andD)A total of 17 controls(-Ve) and 31 SARS-CoV-2 positive(+Ve)plasma samples were tested using BLI-TAA and ELISA kit (GenScript SARS-CoV-2 Spike S1-RBD IgG & IgM ELISA Detection Kit. ELISA IgM shows only 0.9070 and confidence interval in between 0.8243 to 0.9898. Line indicates cut off point.E) and F) A total of 486 community plasma samples which were not tested for SARS-CoV-2 were analyzed by BLI-TAA and ELISA kit (COVID KAVACH ELISA) developed by National Institute of Virology, India using killed SARS-CoV-2 viral particles. A total 30 plasma samples were shown positive by ELISA kit and 32 plasma samples by BLI-TAA. Line indicates cut off point.
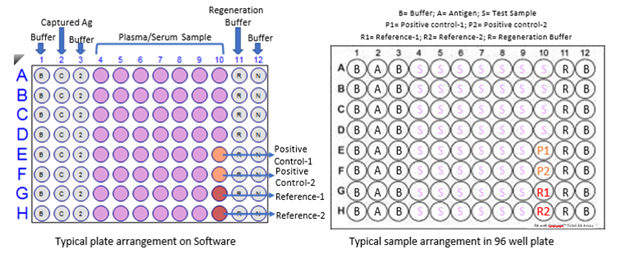
Figure S3: A typical 96 well plate arrangement for BLI-TAA. R represents Regeneration buffer (10 mM Glycine pH 2.0); N represents Neutralization buffer (PBS); B represents Buffer-1 (PBS), C represents Capture antigen (Spike S1 and Nucleocapsid proteins), Pink wells for samples (Plasma or blood), Orange for control and Red for Reference for subtraction. This is a typical Biosensor plate for 8 channel OctetRed 96 or any similar kind of machine.
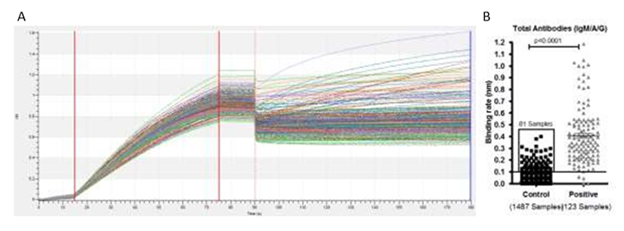
Figure S4: A) Bio-layer interferometry sensogram curve represents detection of total antibodies against SARS-CoV-2 in plasma samples collected from a community who were not diagnosed before for SARS-CoV-2 and positive plasma samples for SARS-CoV-2 infection. B) Binding rate have been calculated on a total of 1487 plasma samples collected from a community who were not diagnosed for SARS-CoV-2 and 123 plasma collected from patients diagnosed for SARS-CoV-2 using RT-PCR. We found binding rate above ≥0.1nm in 81 samples out of the 1487 previously undiagnosed samples. Line indicates cut off point.
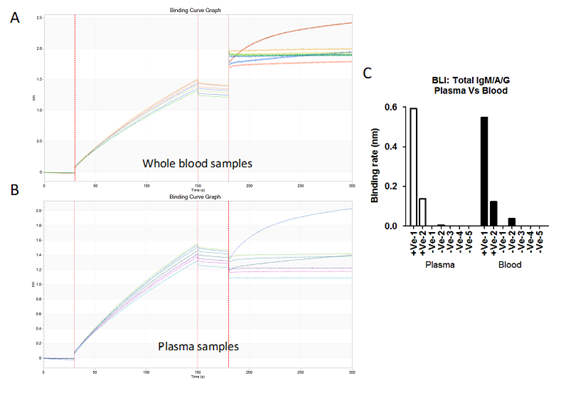
Figure S5: A) & B) Bio-layer interferometry sensogram curve represents detection of total antibodies against SARS-CoV-2 in 20 µl blood (A) and 10µl plasma (B) samples collected from patient diagnosed for SARS-CoV-2 (2 +Ve) and healthy volunteer (5 -Ve). C) Binding rates have been calculated on both blood and plasma samples collected from RT-PCR positive patients and healthy controls.


 Impact Factor: * 5.3
 Acceptance Rate: 75.63%
  Time to first decision: 10.4 days
  Time from article received to acceptance: 2-3 weeks